Name
均线与RSI指标结合的趋势跟踪策略Exponential-Moving-Average-and-Relative-Strength-Index-Combination-Trend-Following-Strategy
Author
ChaoZhang
Strategy Description
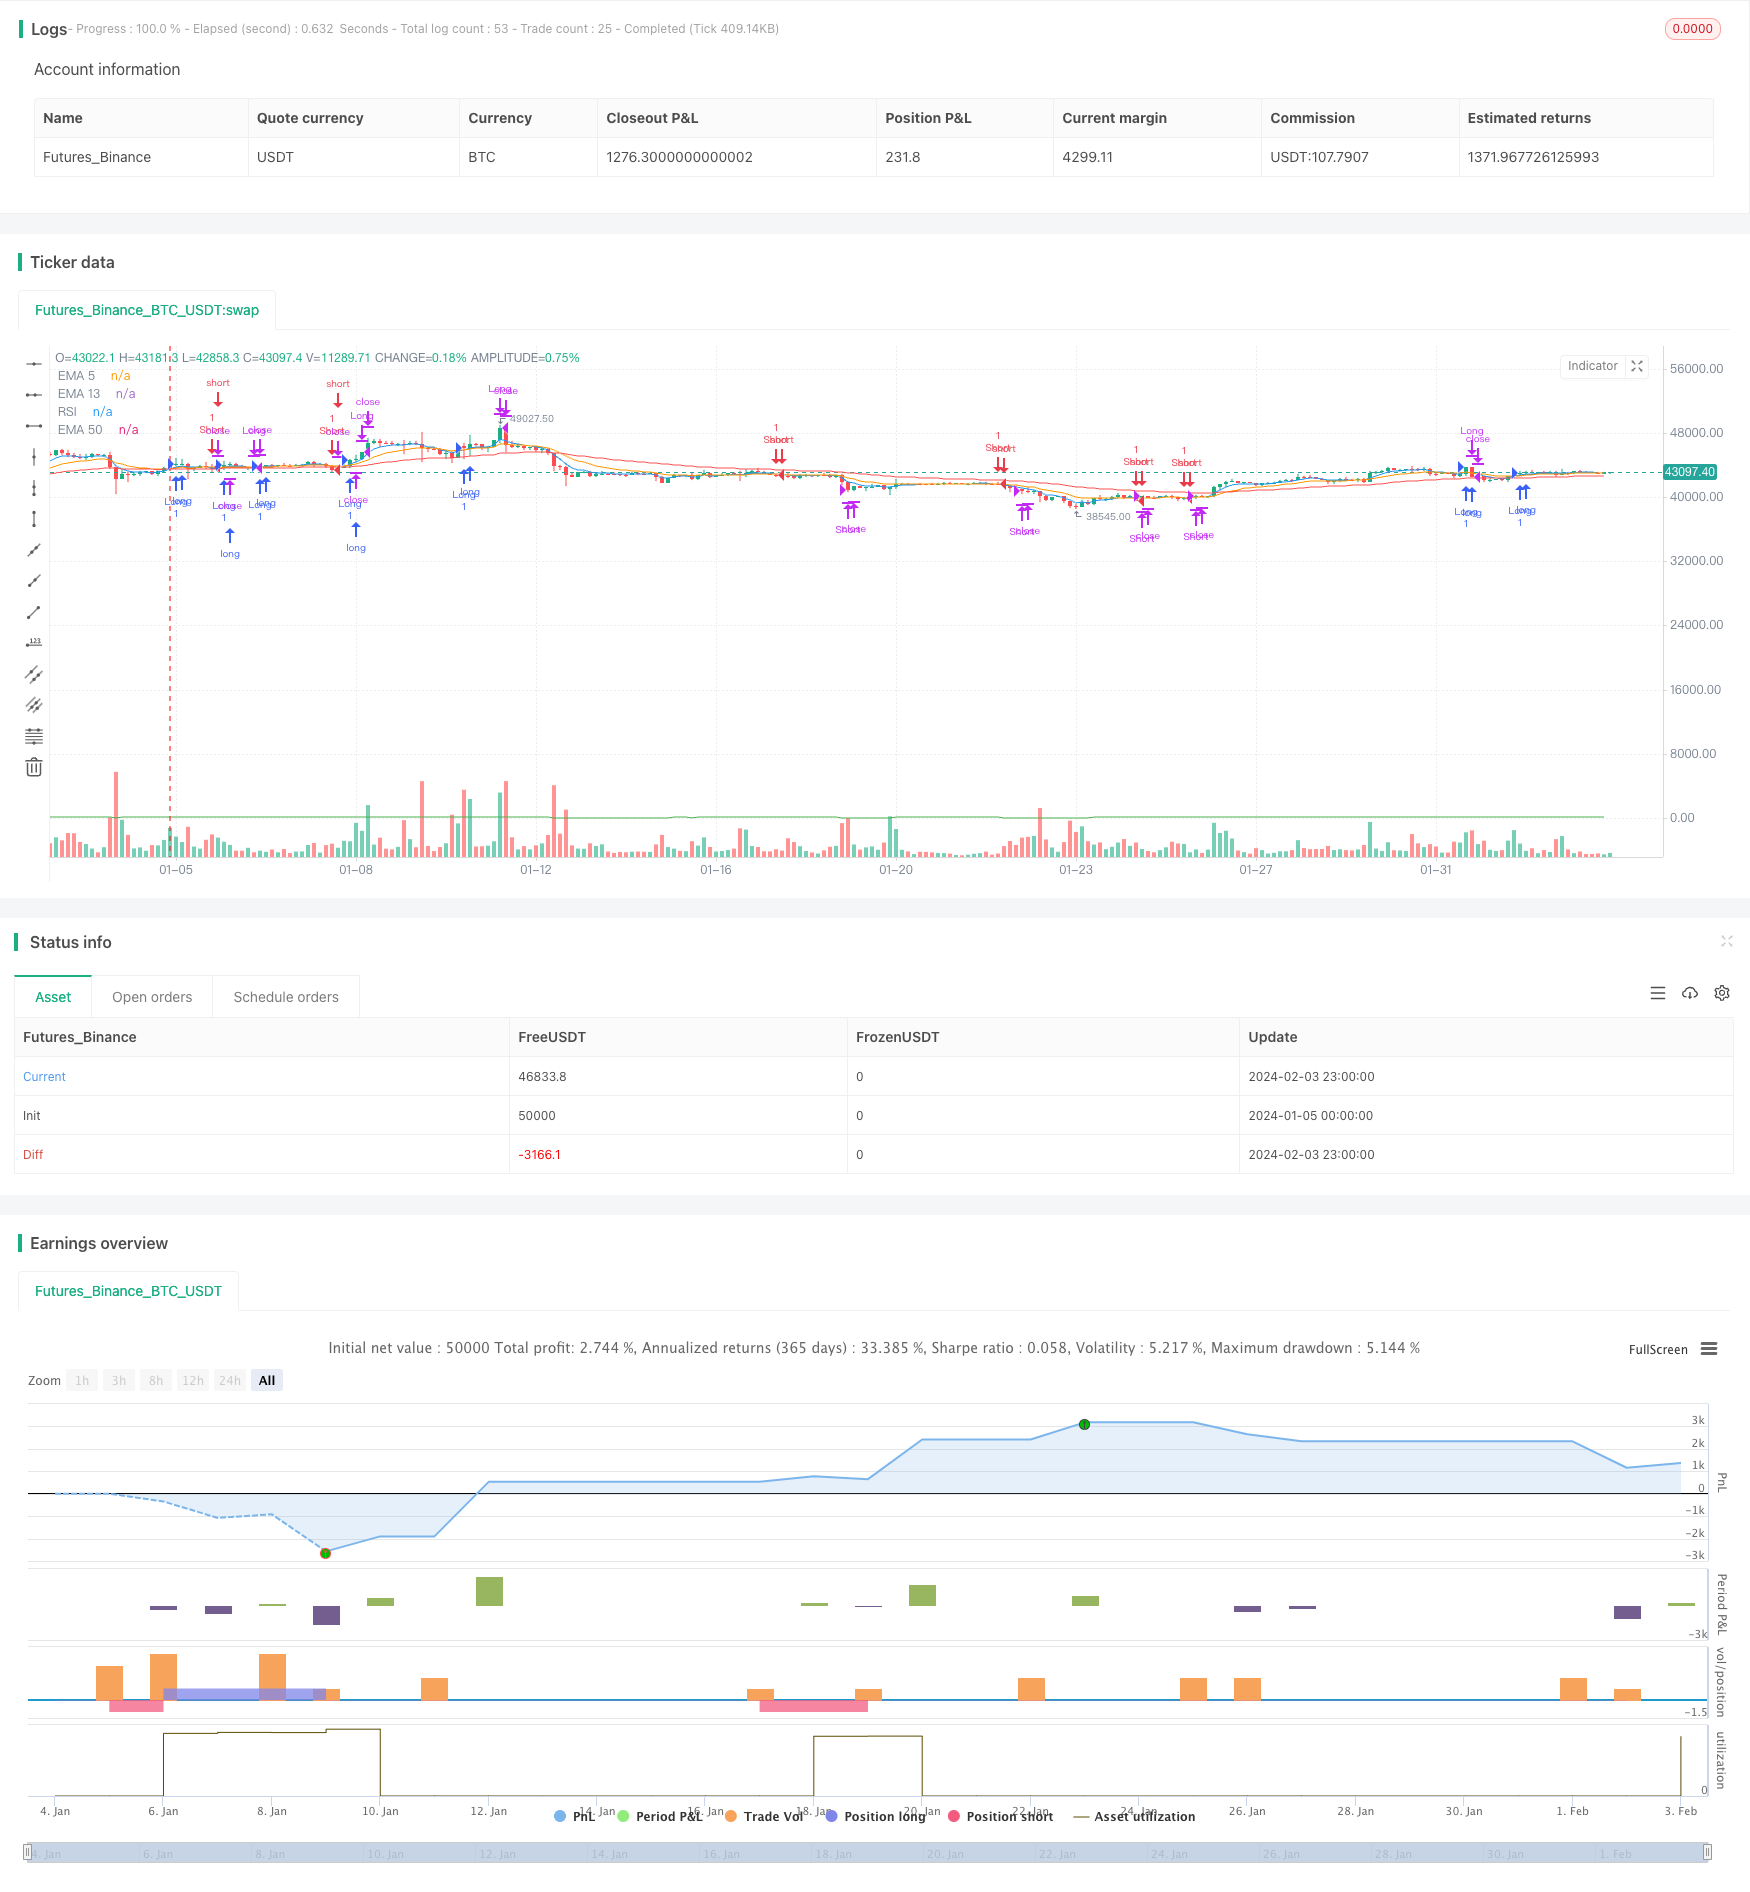
该策略通过结合EMA均线指标和RSI指标来识别趋势方向,在趋势方向确认后进行入场,并结合RSI指标避免过度追涨杀跌。策略简单实用,可用于中长线趋势交易。
策略使用5日EMA,13日EMA和50日EMA三条移动平均线。当5日EMA上穿13日EMA时视为获利机会,做多;当5日EMA下穿13日EMA时,视为止损机会,做空。同时,只有当价格高于50日EMA时才能开多单,当价格低于50日EMA时才能开空单,以确保交易方向和主趋势一致。
入场后,如果RSI超买(高于70)或者5日EMA重新下穿13日EMA,则平多单止盈;如果RSI超卖(低于30)或者5日EMA重新上穿13日EMA,则平空单止盈。
该策略结合趋势跟踪和超买超卖指标,可以有效锁定主要趋势方向的获利机会,避免在震荡行情中被套。利用EMA均线的平滑特性可以减少假信号。同时,RSI指标的设置可以避免在行情反转前过度追涨杀跌。
该策略主要依赖均线指标,在曲折反复的盘整行情中容易产生较多平仓信号,无法持有较长线的单子。如果行情出现突破 trader 可能无法及时跟进机会。此外,均线和RSI参数的设置也会对策略表现产生一定影响。
可以通过适当宽松持仓条件、优化参数组合、结合更多指标等方法来减少误判风险。
该策略可以从以下几个方面进行优化:
-
增加仓位管理机制,如固定份额等,控制单笔风险。
-
优化EMA和RSI的参数,寻找最佳参数组合。可以引入更多周期的参数进行测试。
-
增加更多指标过滤信号,如BO IntegerField等,结合更多因子判断趋势和反转。
-
增加自动止损点位设置。
该策略整体来说较为简单实用,由于仅使用了EMA和RSI两个指标,对参数优化和市场判断要求不高,容易掌握和回测。同时也正因如此,策略的灵活性和鲁棒性可能稍差,需要进行进一步优化以适应更加复杂的市场环境。但对于中长线趋势交易而言,该策略提供了一个可靠的思路。
||
This strategy combines the EMA and RSI indicators to identify trend direction and enter positions after trend confirmation, avoiding overbuying and overselling by incorporating the RSI indicator. The strategy is simple and practical for medium to long term trend trading.
The strategy utilizes the 5-day EMA, 13-day EMA and 50-day EMA moving averages. When the 5-day EMA crosses above the 13-day EMA, it is viewed as a profit opportunity to go long. When the 5-day EMA crosses below the 13-day EMA, it is viewed as a stop loss opportunity to go short. In addition, long positions can only be opened when the price is above the 50-day EMA, and short positions can be opened only when the price is below the 50-day EMA, ensuring the trading direction is consistent with the major trend.
After entering a position, if the RSI becomes overbought (above 70) or the 5-day EMA crosses back below the 13-day EMA, long positions will be closed for profit taking. If the RSI becomes oversold (below 30) or the 5-day EMA crosses back above the 13-day EMA, short positions will be closed for profit.
This strategy combines trend following signals and overbought/oversold indications, which can effectively capture profit opportunities along the main trend direction while avoiding being trapped in range-bound markets. The smoothness of EMAs helps reduce false signals. Also, the RSI settings prevent chasing gains and cutting losses excessively before trend reversals.
The strategy relies mainly on moving averages, which can generate more closing signals in winding consolidation markets, failing to hold longer-term positions. If a trend reversal occurs, the trader may not be able to follow the new opportunity promptly. In addition, the parameters of moving averages and RSI can impact strategy performance.
Risks can be reduced by loosening holding conditions, optimizing parameter combinations, incorporating more indicators, etc.
The strategy can be optimized in the following aspects:
-
Add position sizing mechanisms like fixed percentage to control single trade risk.
-
Optimize EMA and RSI parameters to find the best combination, testing more cycle lengths.
-
Incorporate more indicators like BO IntegerField to determine trends and reversals based on more factors.
-
Add automatic stop loss price setting.
The strategy is simple and practical overall. The use of only EMA and RSI requires less parameter optimization and market judgment, making it easy to grasp and backtest. However, flexibility and robustness may be slightly compromised, requiring further enhancements to adapt to more complex market environments. Still, for medium to long term trend trading, it provides a sound approach.
[/trans]
Strategy Arguments
| Argument | Default | Description |
|---|---|---|
| v_input_1 | 14 | RSI Length |
Source (PineScript)
/*backtest
start: 2024-01-05 00:00:00
end: 2024-02-04 00:00:00
period: 3h
basePeriod: 15m
exchanges: [{"eid":"Futures_Binance","currency":"BTC_USDT"}]
*/

//@version=5
strategy("EMA, RSI, and Price Crossover Strategy", overlay=true, default_qty_value = 1)

// Define the EMA lengths
ema5 = ta.ema(close, 5)
ema13 = ta.ema(close, 13)
ema50 = ta.ema(close, 50)

// Define the RSI length
rsiLength = input(14, title="RSI Length")
rsi = ta.rsi(close, rsiLength)

// Define the conditions for long and short positions
longCondition = ta.crossover(ema5, ema13) and close > ema50
shortCondition = ta.crossunder(ema5, ema13) and close < ema50

// Execute long and short positions
if (longCondition)
    strategy.entry("Long", strategy.long)
if (shortCondition)
    strategy.entry("Short", strategy.short)

// Define the exit conditions
exitLongCondition = rsi > 70 or ta.crossunder(ema5, ema13)
exitShortCondition = rsi < 30 or ta.crossover(ema5, ema13)

// Exit long and short positions
if (exitLongCondition)
    strategy.close("Long")
if (exitShortCondition)
    strategy.close("Short")

// Plot EMAs on the chart
plot(ema5, color=color.blue, title="EMA 5")
plot(ema13, color=color.orange, title="EMA 13")
plot(ema50, color=color.red, title="EMA 50")

// Create a separate panel for RSI
rsiPanel = plot(rsi, color=color.green, title="RSI")
Detail
https://www.fmz.com/strategy/441043
Last Modified
2024-02-05 09:57:16