Name
均线交叉量化策略Moving-Average-Crossover-Quantitative-Strategy
Author
ChaoZhang
Strategy Description
[trans]
该策略通过计算EMA指数移动平均线和MACD指标,结合二者的交叉信号来判断入场和出场。当价格上穿EMA线且MACD线上穿信号线时做多;当价格下穿EMA线且MACD线下穿信号线时做空。
该策略使用EMA指数移动平均线判断当前趋势方向。同时使用MACD指标的双均线交叉来产生买卖信号。只有当价格突破EMA线时,才判断MACD的金叉死叉信号。这样可以避免错误的信号。
该策略主要基于移动平均线交易策略与MACD交易策略的优点。移动平均线能比较好地判断趋势方向。MACD指数平滑移动平均线的快慢线交叉则可以提示买卖点位。二者结合使用,可以提高信号的准确性。
该策略结合EMA和MACD双重指标判断,可以有效过滤掉一些错误信号,提高信号质量。同时,EMA判断主趋势,MACD判断具体买卖点位,二者互补,可以取得较好收益。
另外,该策略仅在价格突破EMA均线时才考虑MACD信号,避免了在震荡行情中出现错误交易。这也增强了策略的稳定性。
该策略主要风险在于参数设置。如果EMA和MACD的参数设置不当,则会错过信号或者产生错误信号。此外,如果行情趋势发生转折,策略会产生一定亏损。
为降低风险,应适当调整参数,使EMA和MACD的参数匹配当前市场周期。同时建议采用止损来控制单笔损失。当市场进入磨底或者触及支撑位时,应考虑适当停止交易,避免持续亏损。
该策略可以从以下几个方面进行优化:
-
动态优化参数,使EMA和MACD的参数能根据实时行情和周期进行调整,保证参数的有效性
-
增加其他指标结合,如BOLL通道或KD指标等,丰富策略信号
-
采用机器学习方法自动优化策略参数,并根据回测结果调整参数
-
在突破EMA均线时,判断方向强度,避免假突破
-
增加止盈止损策略,以锁定利润并切损
该均线交叉量化策略结合EMA和MACD双重指标,可以有效产生高质量信号。优化参数设置、增加止损止盈、加入其他指标等都可以进一步增强策略稳定性和盈利能力。该策略有效而简单,对于量化交易者具有很好的参考和应用价值。
||
This strategy generates entry and exit signals by calculating the EMA exponential moving average and the MACD indicator and combining the crossover signals of both. It goes long when the price crosses above the EMA line and the MACD line crosses above the signal line, and goes short when the price crosses below the EMA line and the MACD line crosses below the signal line.
This strategy uses the EMA exponential moving average to determine the current trend direction. At the same time, it uses the moving average crossover of the MACD indicator to generate trading signals. Only when the price breaks through the EMA line will the MACD golden cross and death cross signals be considered. This avoids false signals.
The strategy is mainly based on the advantages of moving average trading strategies and MACD trading strategies. The moving average can judge the trend direction quite well. The fast and slow line crossovers of the MACD exponential moving average can indicate buy and sell points. Using both in combination can improve the accuracy of the signals.
This strategy combines the EMA and MACD dual indicators to effectively filter out some false signals and improve signal quality. At the same time, the EMA judges the major trend and the MACD judges specific entry and exit points. The two complement each other and can achieve good returns.
In addition, this strategy only considers the MACD signal when the price breaks through the EMA line, avoiding wrong trades in choppy markets. This also enhances the stability of the strategy.
The main risk of this strategy lies in parameter settings. If the parameters of EMA and MACD are set improperly, signals may be missed or false signals may be generated. In addition, if the market trend reverses, the strategy will incur some losses.
To reduce risks, parameters should be adjusted appropriately to match the current market cycle of EMA and MACD. At the same time, it is recommended to use stop loss to control single loss. When the market enters a bottoming process or touches support, trading should be suspended to avoid sustained losses.
The following aspects of the strategy can be optimized:
-
Dynamically optimize parameters to adjust EMA and MACD parameters according to real-time market conditions and cycles to ensure parameter validity
-
Add other indicators in combination, such as BOLL channels or KD indicators, to enrich strategy signals
-
Use machine learning methods to automatically optimize strategy parameters and adjust parameters based on backtest results
-
When breaking through the EMA line, judge the strength of the direction to avoid false breakouts
-
Add profit taking and stop loss strategies to lock in profits and cut losses
The moving average crossover quantitative strategy combines dual EMA and MACD indicators to effectively generate high quality signals. Optimizing parameter settings, adding stop loss/profit taking, adding other indicators, etc. can further enhance the stability and profitability of the strategy. This effective and simple strategy has great reference and application value for quantitative traders.
[/trans]
Strategy Arguments
| Argument | Default | Description |
|---|---|---|
| v_input_1 | 12 | Fast Length |
| v_input_2 | 26 | Slow Length |
| v_input_3 | 9 | MACD Length |
| v_input_4 | 13 | EMA Length |
Source (PineScript)
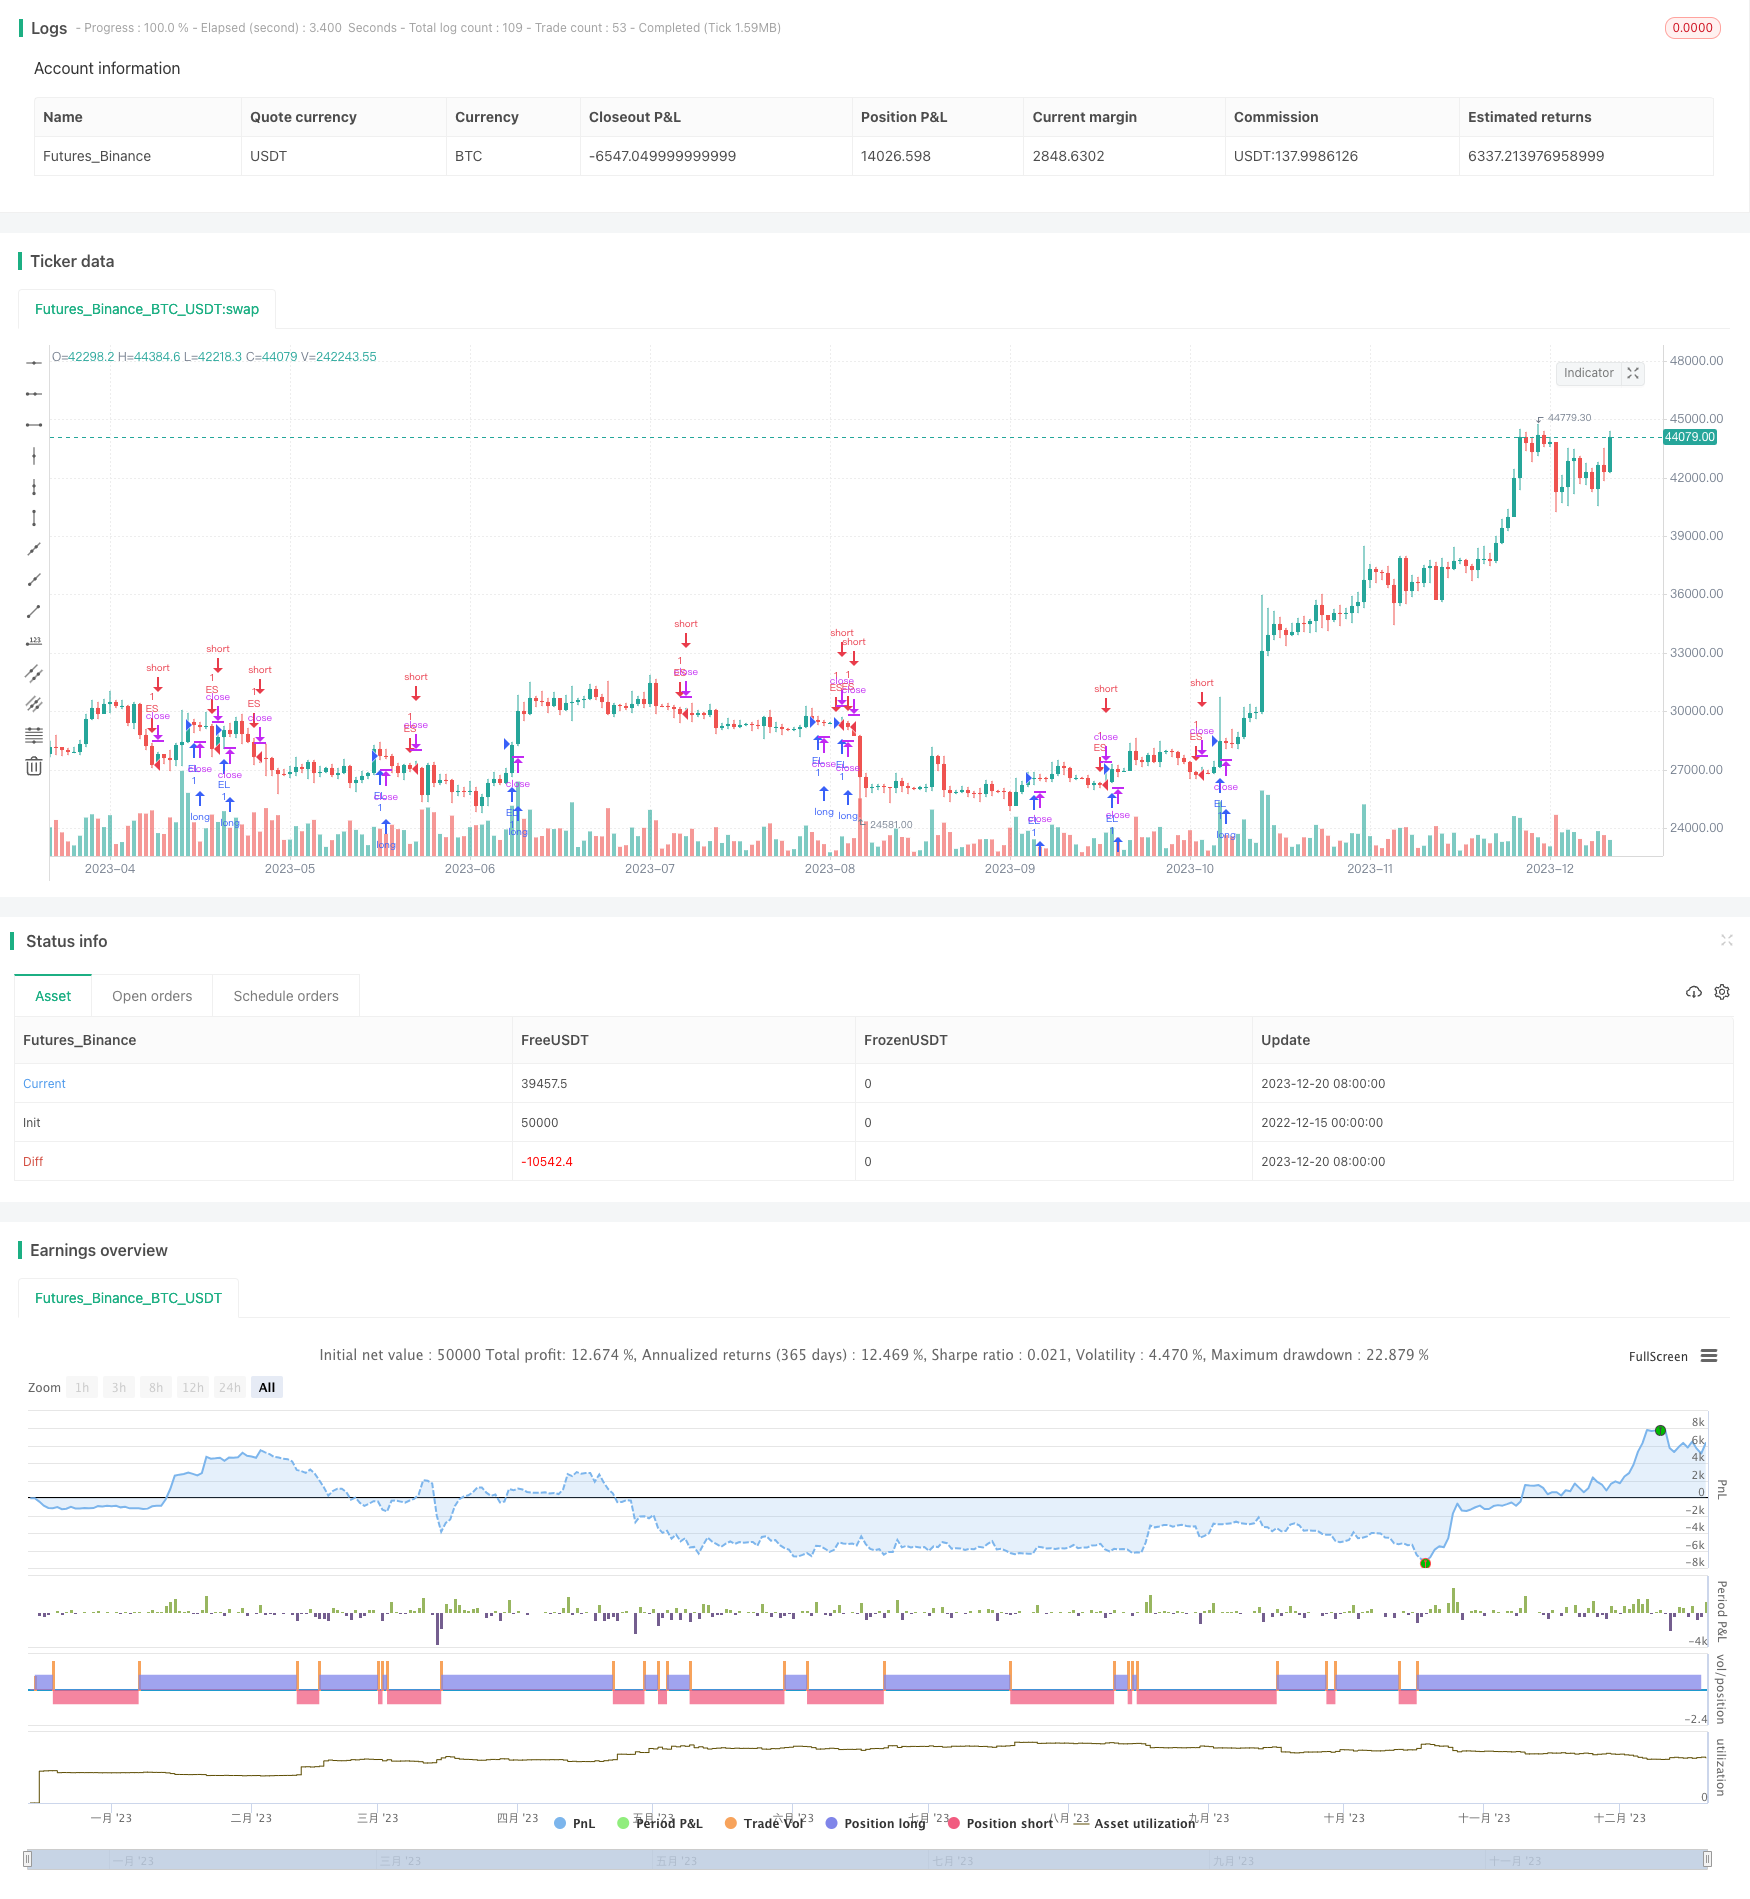
/*backtest
start: 2022-12-15 00:00:00
end: 2023-12-21 00:00:00
period: 1d
basePeriod: 1h
exchanges: [{"eid":"Futures_Binance","currency":"BTC_USDT"}]
*/

//@version=5
strategy("LONERTESTV2", overlay=true)

// Input definitions
fastLength = input(12, title="Fast Length")
slowlength = input(26, title="Slow Length")
MACDLength = input(9, title="MACD Length")
emaLength = input(13, title="EMA Length")
//smaLength = input(200, title="SMA Length")

// SMA Indicator - Are we in a Bull or Bear market according to 200 SMA?
//SMA = ta.ema(close, smaLength)

// EMA Indicator - Are we in a rally or not?
EMA = ta.ema(close, emaLength)

// MACD Indicator - Is the MACD bullish or bearish?
MACD = ta.ema(close, fastLength) // - ta.ema(close, slowlength)
aMACD = ta.ema(MACD, MACDLength)
delta = MACD - aMACD

// Set Buy/Sell conditions
buy_entry = close > EMA and delta > 5 ? true : close > EMA and delta > -5
sell_entry = close < EMA and delta < -5 ? true : close < EMA and delta < 5

if buy_entry
    strategy.entry(id='EL', direction=strategy.long)

if sell_entry
    strategy.entry(id='ES', direction=strategy.short)

// strategy.entry("Buy", strategy.long)
// strategy.entry("Sell", strategy.short)
Detail
https://www.fmz.com/strategy/436251
Last Modified
2023-12-22 15:05:24