Name
埃勒斯随机周期量化交易策略Ehlers-Stochastic-Cyber-Cycle-Strategy
Author
ChaoZhang
Strategy Description
[trans]
埃勒斯随机周期策略是一种运用埃勒斯的随机周期指标来产生交易信号的量化交易策略。该策略结合了随机指标和周期指标的优点,旨在抓住市场中的周期性机会。
该策略首先构建一个 smoothed 周期指标,然后基于该指标构建一个随机指标值。交易信号的产生是根据这个随机指标值的移动平均线的交叉来决定的。
具体而言,smoothed 周期指标的计算方法是:
smooth = (src + 2 * src[1] + 2 * src[2] + src[3]) / 6
其中 src 是输入的价格数据,比如收盘价。该指标结合了当前价格和之前3个时间段的价格,构建出一个平滑的周期信号。
基于该 smoothed 指标,然后可以计算出随机指标 cycle:
cycle := (1 - .5 * alpha) * (1 - .5 * alpha) *
           (smooth - 2 * smooth[1] + smooth[2]) +
           2 * (1 - alpha) * cycle[1] -
           (1 - alpha) * (1 - alpha) * cycle[2]
该计算公式中包含了平滑后的周期信号的二阶差分项,以及之前两个周期的值。α是平滑因子,调节了新旧周期值的权重。
最后,根据这个 cycle 指标计算出一个 0-100 的随机值 value1。并根据 value1 的 10 日移动平均构建出信号值 signal。当 signal 的移动平均线上穿或下穿时,发出交易信号。
该策略结合随机指标和周期指标,综合了两者的优点。相比简单的移动平均等趋势策略,该策略可以更好地捕捉周期性机会,从而获得较佳的效果。
主要优势有:
- 周期指标可以识别循环模式,随机指标提供xFB交易时机
- 双重指标设计,可以有效过滤假信号
- 可自定义参数,适应不同市场环境
该策略主要存在以下风险:
- 参数设置不当可能导致交易频繁,增加交易费用和滑点成本
- 无法有效处理价格剧烈波动的市场,可能造成较大亏损
- 周期指标对曲线拟合的依赖性强,拟合不当可能产生错误信号
可以通过优化参数设置、设置止损点、结合其他过滤指标等方法来控制风险。
该策略还可以从以下几个方向进行优化:
- 结合其他技术指标进行信号过滤,如布林带、RSI等,减少错误信号
- 加入自适应退出机制,根据市场波动程度动态调整止损点
- 利用机器学习方法自动优化参数,使之能够动态适应市场
- 优化资金利用率,通过杠杆、复利等手段增强资金使用效率
埃勒斯随机周期策略综合运用随机指标和周期指标的优势,通过双重信号设计有效控制风险,能够在周期性较强的市场中获得较好收益。通过进一步优化,该策略可以成为一个值得推荐的量化交易策略。
||
The Ehlers Stochastic Cyber Cycle Strategy is a quantitative trading strategy that generates trading signals using Ehlers' stochastic cycle indicator. This strategy combines the advantages of stochastic indicators and cycle indicators, aiming to capture cyclical opportunities in the market.
This strategy first constructs a smoothed cycle indicator, then builds a stochastic indicator value based on that indicator. The generation of trading signals is determined by the crossover of the moving average line of this stochastic indicator value.
Specifically, the smoothed cycle indicator is calculated as:
smooth = (src + 2 * src[1] + 2 * src[2] + src[3]) / 6
Where src is the input price data, such as closing price. This indicator combines the current price and the prices of the previous 3 time periods to construct a smoothed cycle signal.
Based on this smoothed indicator, the stochastic cycle cycle can then be calculated:
cycle := (1 - .5 * alpha) * (1 - .5 * alpha) *
           (smooth - 2 * smooth[1] + smooth[2]) +
           2 * (1 - alpha) * cycle[1] -
           (1 - alpha) * (1 - alpha) * cycle[2]
This calculation formula contains the second order difference of the smoothed periodic signal, and the values of the previous two cycles. α is a smoothing factor that adjusts the weight of new and old cycle values.
Finally, a 0-100 random value value1 is calculated based on this cycle indicator. And the signal value signal is constructed based on the 10-day moving average of value1. Trading signals are issued when the moving average line of signal crosses up or down.
This strategy combines stochastic indicators and cycle indicators to integrate the advantages of both. Compared to simple trend strategies such as moving averages, this strategy can better capture cyclical opportunities and thus achieve better results.
The main advantages are:
- Cycle indicators can identify cyclic patterns, stochastic indicators provide trading opportunities
- Dual indicator design can effectively filter false signals
- Customizable parameters suit different market environments
The main risks of this strategy are:
- Improper parameter settings may lead to frequent trading, increasing trading costs and slippage costs
- Cannot effectively handle markets with violent price fluctuations, which may lead to large losses
- Cycle indicators rely heavily on curve fitting, improper fitting may generate wrong signals
Risks can be controlled by optimizing parameter settings, setting stop loss points, combining other filtering indicators, etc.
This strategy can also be optimized in the following aspects:
- Combine with other technical indicators for signal filtering, such as Bollinger Bands, RSI, etc., to reduce false signals
- Add adaptive exit mechanisms, dynamically adjust stop loss points according to market volatility
- Use machine learning methods to automatically optimize parameters to dynamically adapt to the market
- Optimize capital utilization through leverage, compounding and other means
The Ehlers Stochastic Cyber Cycle Strategy integrates the advantages of stochastic and cycle indicators through dual signal design to effectively control risks, and can achieve good returns in markets with strong cyclicality. With further optimization, this strategy can become a worthwhile quantitative trading strategy to recommend.
[/trans]
Strategy Arguments
| Argument | Default | Description |
|---|---|---|
| v_input_1_hl2 | 0 | Source: hl2 |
| v_input_2 | 0.07 | Alpha |
| v_input_3 | 9 | Lag |
| v_input_4 | 8 | Stochastic len |
| v_input_5 | true | oppositeTrade |
Source (PineScript)
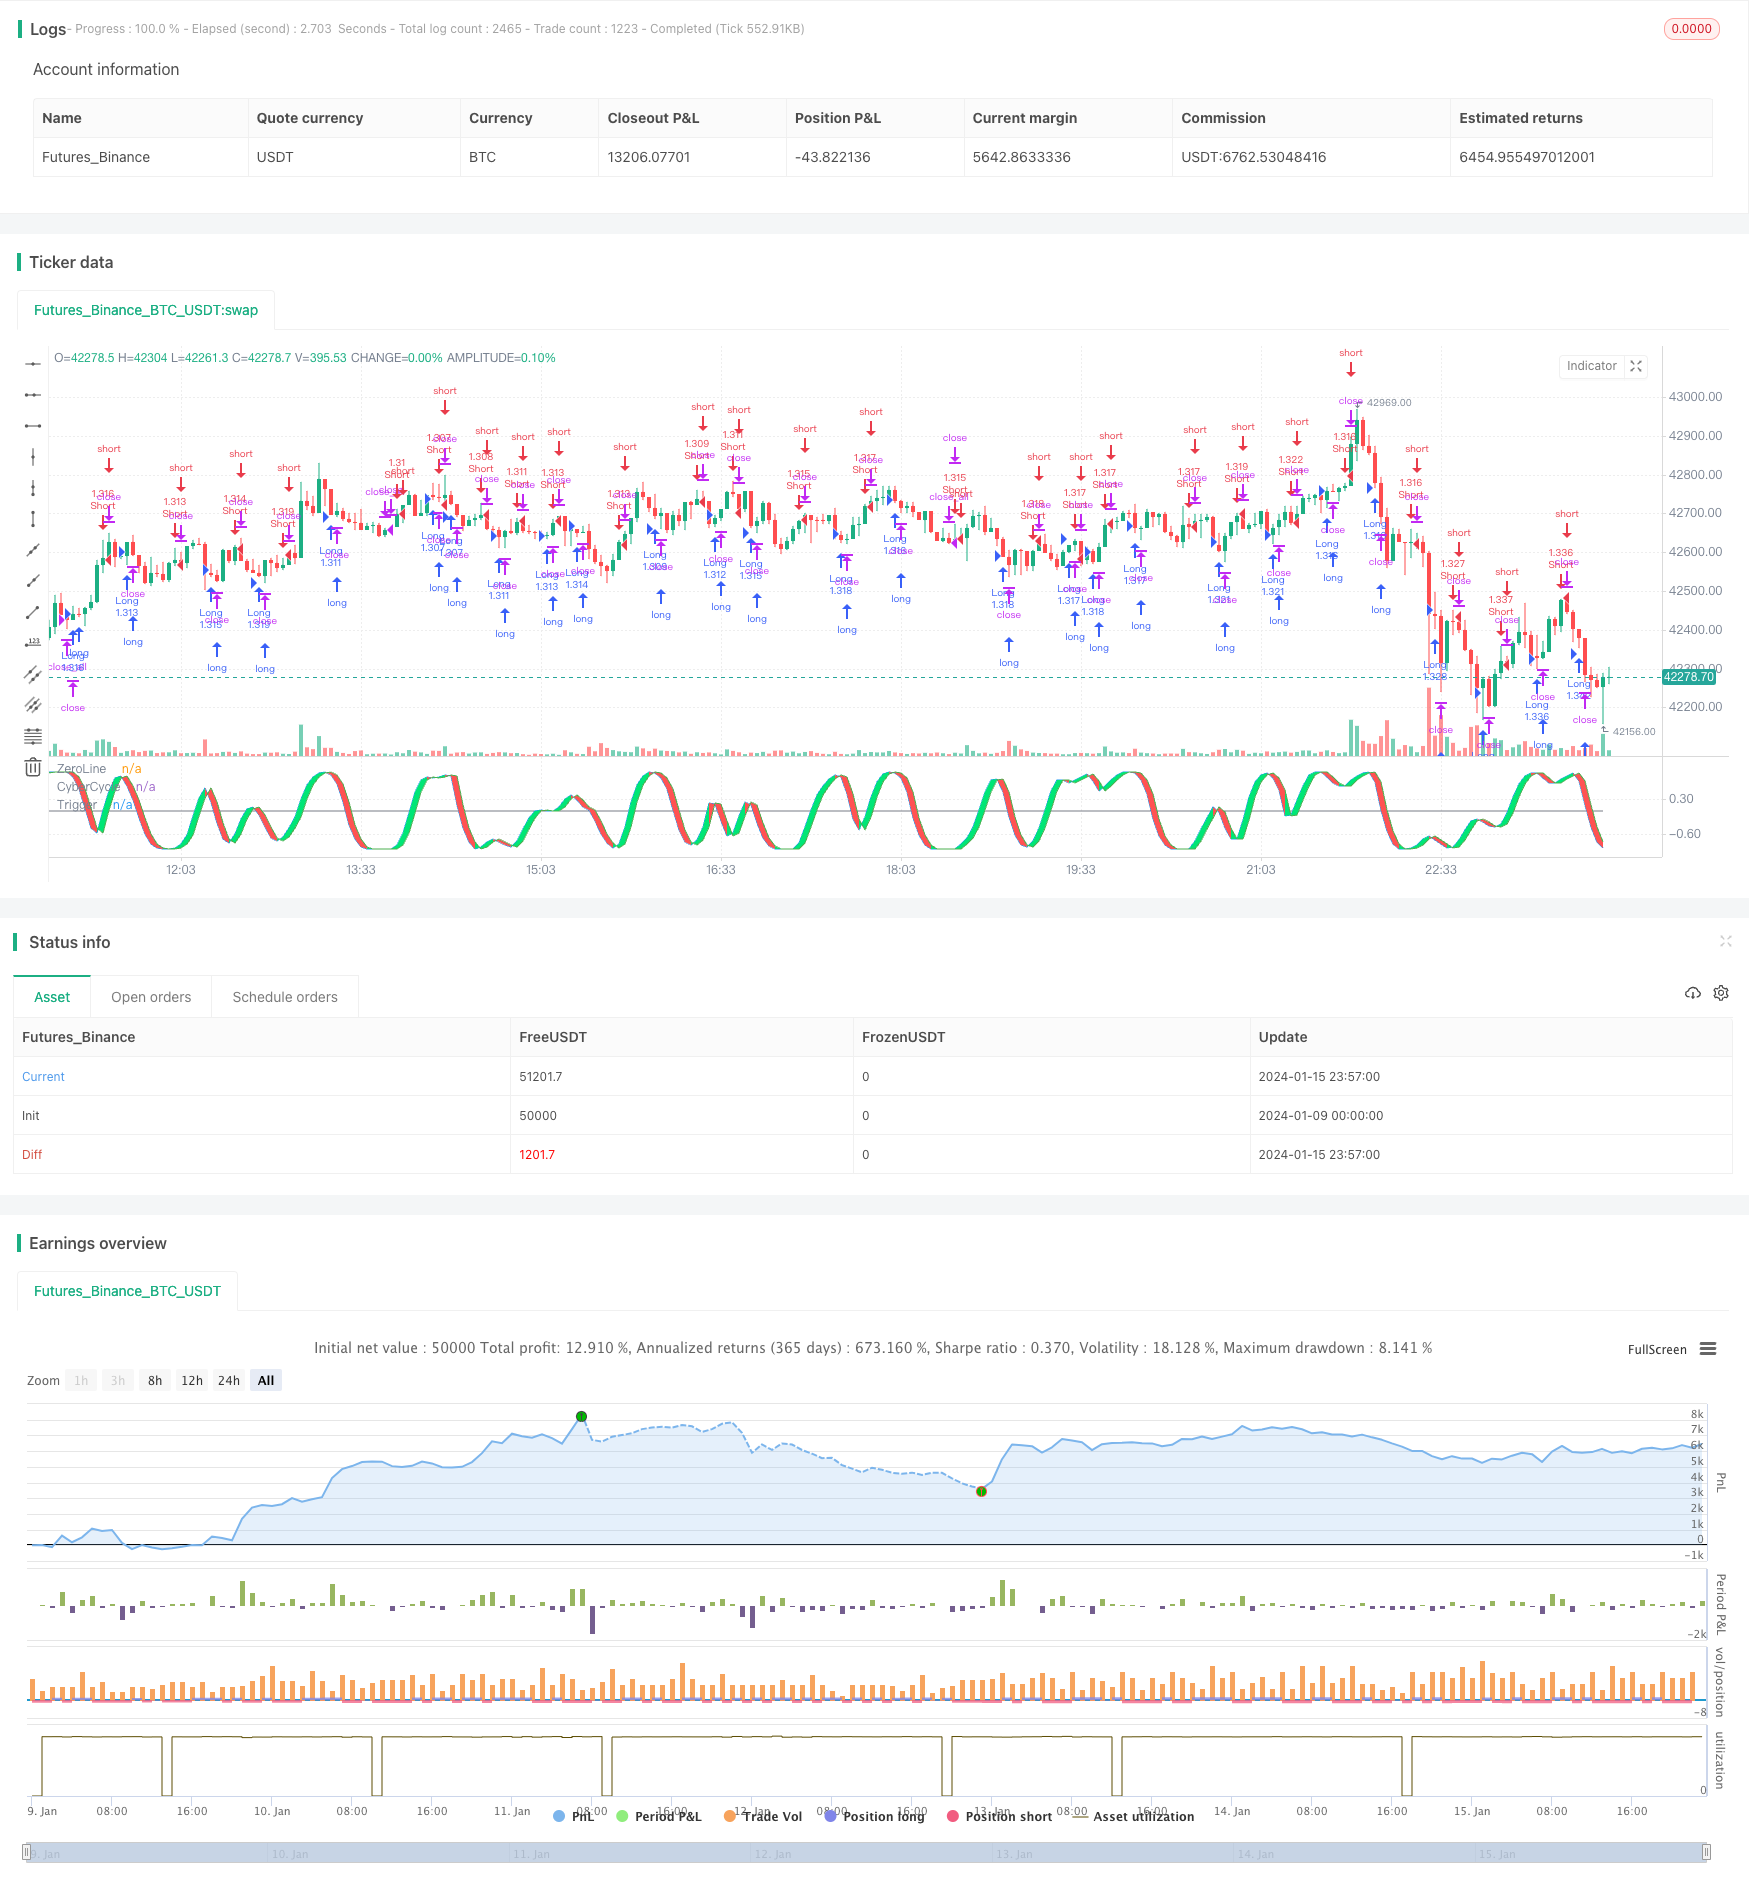
/*backtest
start: 2024-01-09 00:00:00
end: 2024-01-16 00:00:00
period: 3m
basePeriod: 1m
exchanges: [{"eid":"Futures_Binance","currency":"BTC_USDT"}]
*/

//@version=3
strategy("Ehlers Stochastic Cyber Cycle Strategy",overlay=false, default_qty_type = strategy.percent_of_equity, default_qty_value = 100.0, pyramiding = 1, commission_type = strategy.commission.percent, commission_value = 0.1)
src = input(hl2, title = "Source")
alpha = input(.07, title = "Alpha")
lag = input(9, title = "Lag")
smooth = (src + 2 * src[1] + 2 * src[2] + src[3]) / 6
len = input(8, title = "Stochastic len")
cycle = na
if na(cycle[7])
    cycle := (src - 2 * src[1] + src[2]) / 4
else
    cycle := (1 - .5 * alpha) * (1 - .5 * alpha) * (smooth - 2 * smooth[1] + smooth[2]) + 2 * (1 - alpha) * cycle[1] - (1 - alpha) * (1 - alpha) * cycle[2]

value1 = stoch(cycle, cycle, cycle, len) / 100
value2 = 2 * ((4 * value1 + 3 * value1[1] + 2 * value1[2] + value1[3]) / 10 - 0.5)

signal = value2
oppositeTrade = input(true)
barsSinceEntry = 0
barsSinceEntry := nz(barsSinceEntry[1]) + 1
if strategy.position_size == 0
    barsSinceEntry := 0
if (crossover(signal, signal[1]) and not oppositeTrade) or (oppositeTrade and crossunder(signal, signal[1]))
    strategy.entry("Long", strategy.long)
    barsSinceEntry := 0
if (crossunder(signal, signal[1]) and not oppositeTrade) or (oppositeTrade and crossover(signal, signal[1]))
    strategy.entry("Short", strategy.short)
    barsSinceEntry := 0
if strategy.openprofit < 0 and barsSinceEntry > 8
    strategy.close_all()
    barsSinceEntry := 0


plot(0, title="ZeroLine", color=gray)
plotSrc = signal
cyclePlot = plot(plotSrc, title = "CyberCycle", color = blue)
triggerPlot = plot(plotSrc[1], title = "Trigger", color = green)
fill(cyclePlot, triggerPlot, color = plotSrc < plotSrc[1] ? red : lime, transp = 50)
Detail
https://www.fmz.com/strategy/439084
Last Modified
2024-01-17 16:03:30