Name
基于价格与SMA交叉的量化交易策略Quantitative-Trading-Strategy-Based-on-Price-Crossover-with-SMA
Author
ChaoZhang
Strategy Description
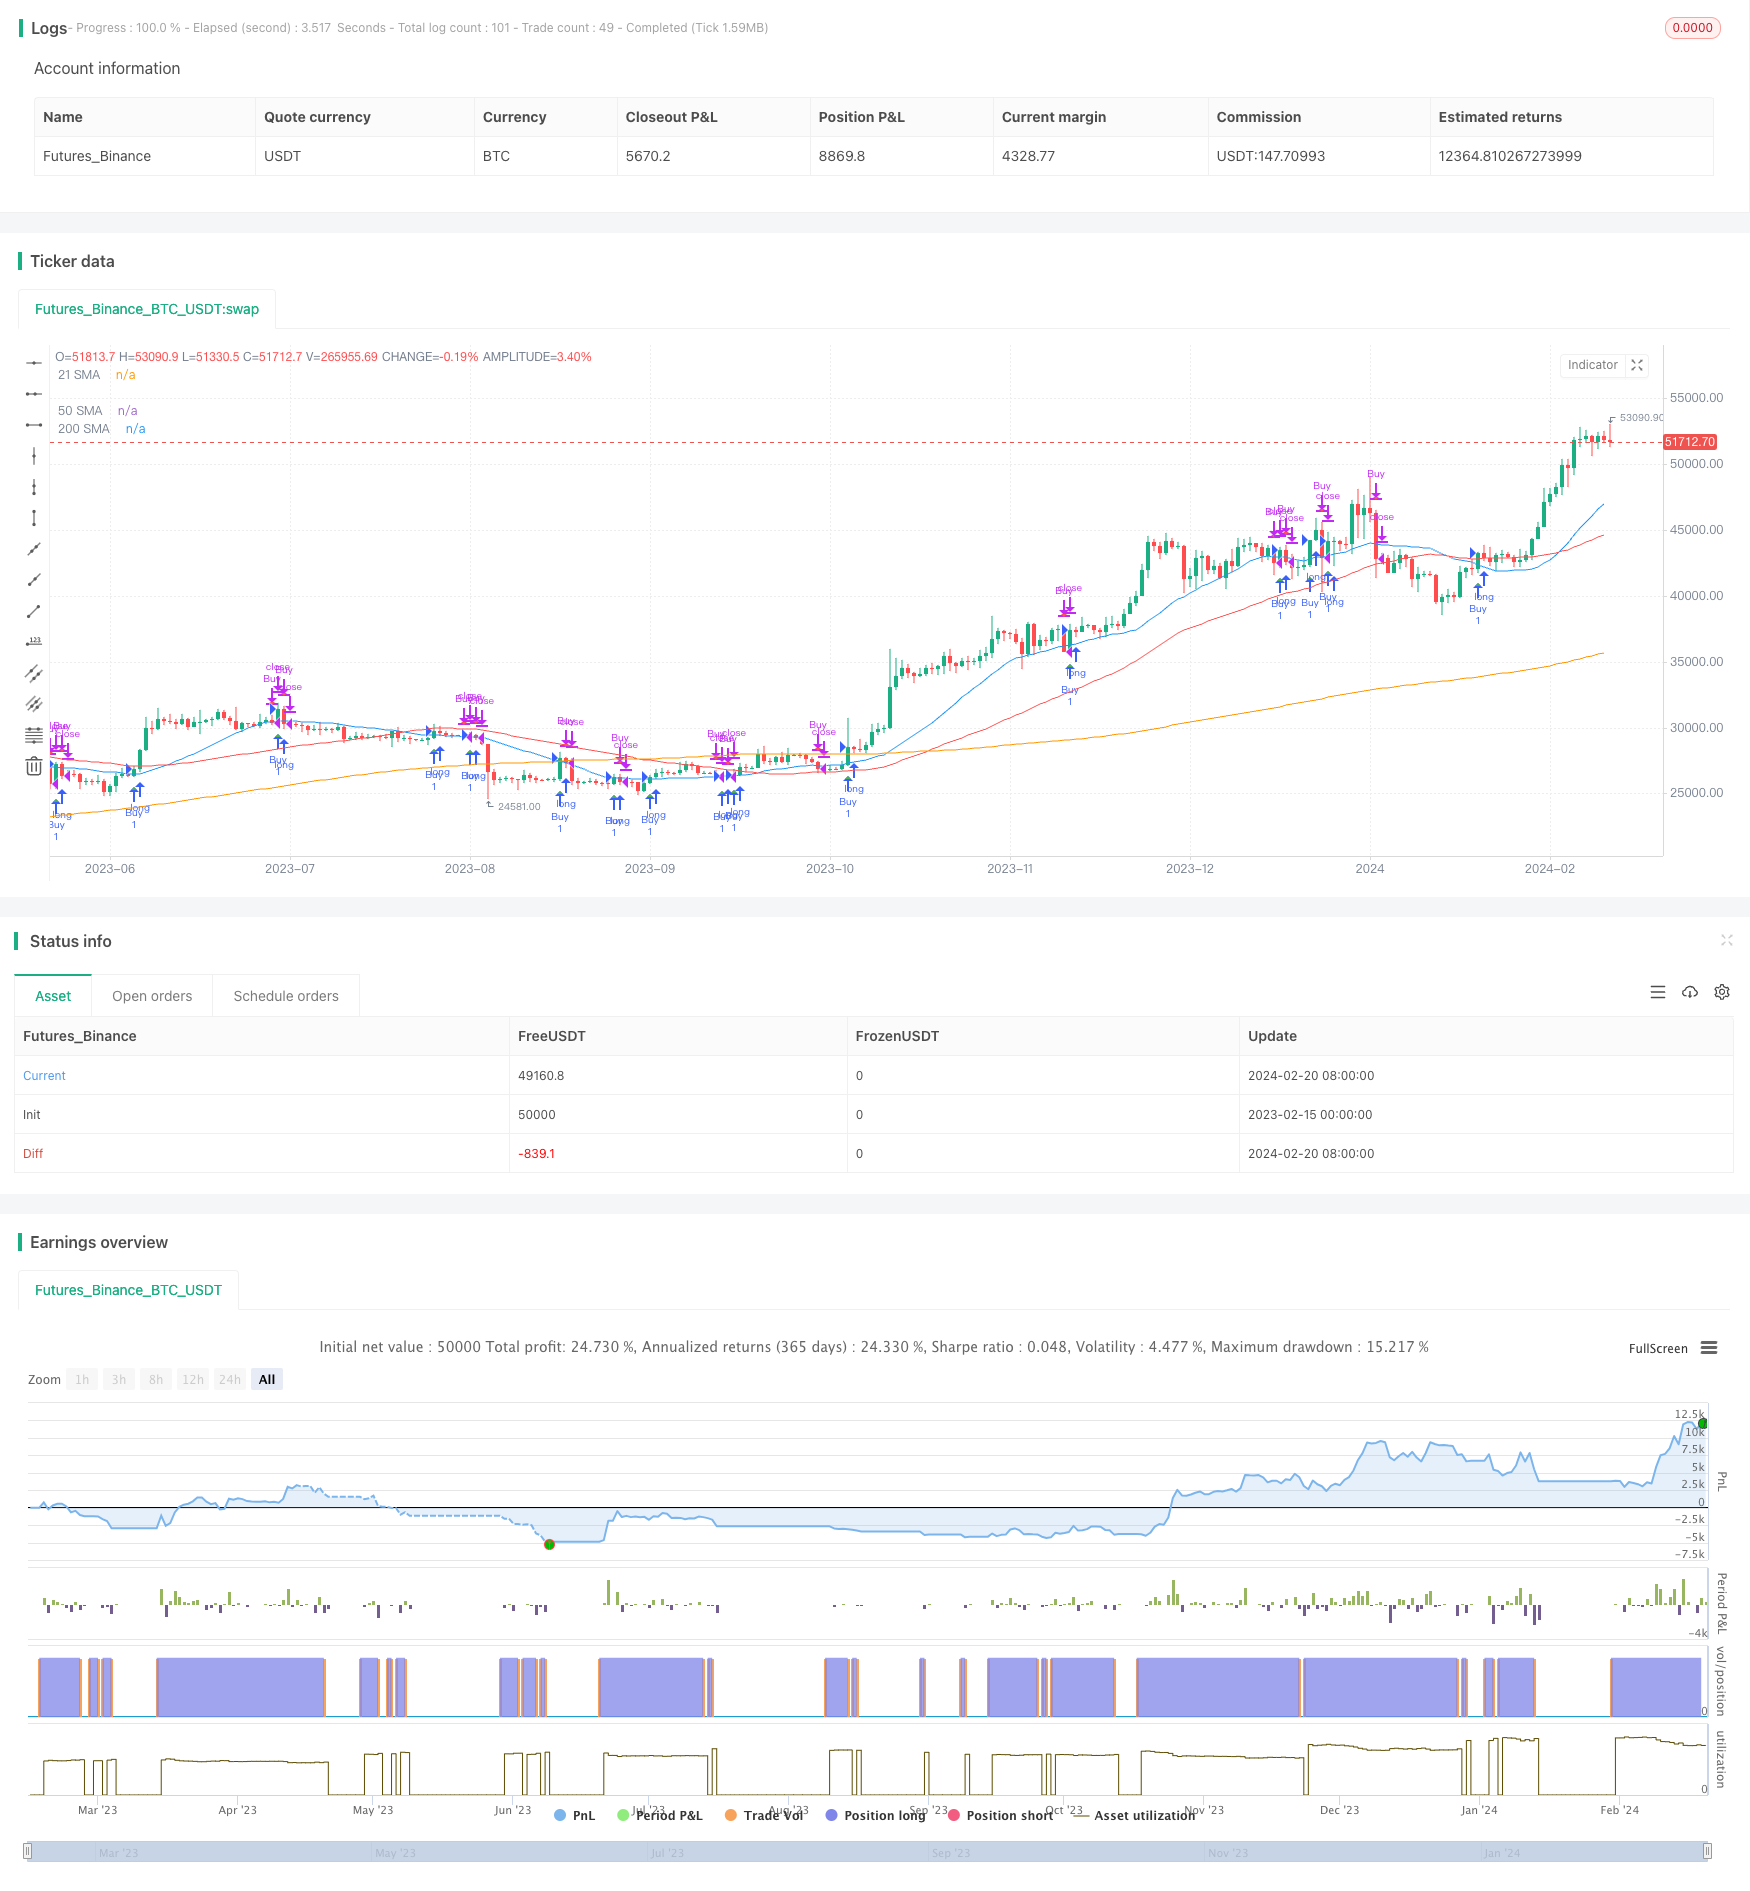
该策略名为“基于价格与SMA交叉的量化交易策略”,主要通过计算不同周期的SMA,并跟踪价格与SMA的交叉情况来产生交易信号。当价格从下向上突破SMA时,产生买入信号;当价格从上向下跌破SMA时,产生卖出信号。
该策略的核心逻辑是跟踪价格与21日简单移动均线(SMA)的交叉情况。同时,策略还计算了50日SMA和200日SMA,这有助于判断大致趋势。
具体来说,策略会请求获取股票在指定日期范围内的收盘价,然后基于输入的SMA周期计算不同的SMA。如果价格从下向上突破21日SMA,就会设置买入信号;如果价格从上向下跌破21日SMA,就会设置卖出信号。
在计算SMA和判断交叉的同时,策略会跟踪当前的持仓情况。当买入信号触发时,策略会进入持仓;当卖出信号触发时,策略会平仓。通过这个方式,完成基于SMA交叉系统的自动交易。
该策略最大的优势是简单易行,容易理解和实现。SMA是一种常用的技术分析指标,SMA交叉是常见的交易信号之一。这种基于指标交叉的策略,可以轻松地应用于不同的股票和时间范围,适合自动化交易。
另一个优势是该策略可以通过调整SMA参数进行优化。例如可以测试不同的SMA周期组合,寻找最佳参数,以适应特定股票的波动规律。此外,策略也可以通过添加其他指标来实现 확证和优化。
该策略最大的风险在于指标类策略会产生较多的错误信号。例如在盘整震荡期,价格可能频繁地上下穿越SMA,导致不必要的交易信号。
常见的解决方法包括设置止损,调整参数,或者添加过滤条件等。例如可以设置最大损失比例来限制风险;也可以调整SMA周期,选取更稳定的参数组合;或者添加其他指标的确认来过滤部分信号。
该策略可以通过以下几个方向进行优化:
-
测试并选择最佳的SMA参数组合。可以回测不同的SMA长度,寻找最合适的周期。
-
增加其他指标FilterSignal confirmation,例如RSI,MACD等。这可以过滤掉一些错误信号。
-
添加止损逻辑。设置最大容忍损失或者移动止损可以控制风险。
-
优化入场时机。可以考虑在重要的突破点附近进入,而不是严格追踪SMA交叉。
-
测试复合策略。可以考虑与其他类型策略,例如趋势跟踪,组合使用。
该策略通过简单的SMA指标交叉来实现自动化交易。优点是简单易行,容易理解;缺点是信号频繁,容易被套。我们可以通过参数优化、增加filter、止损等方式来改善策略效果。该策略为我们提供了一个基础框架,可以通过不断添加新的要素来丰富和提高策略。
||
The strategy is named "Quantitative Trading Strategy Based on Price Crossover with SMA". It mainly generates trading signals by calculating SMAs of different periods and tracking price crossover with SMAs. When price breaks SMA upwards, it triggers buy signal. When price breaks SMA downwards, it triggers sell signal.
The core logic of this strategy is to track price crossover with 21-day simple moving average (SMA). Meanwhile, it also calculates 50-day SMA and 200-day SMA to determine the general trend.
Specifically, the strategy requests close price within given date range, and calculates different SMAs based on input periods. If price breaks 21-day SMA upwards, it sets buy signal. If price breaks 21-day SMA downwards, it sets sell signal.
Along with calculating SMAs and determining crossovers, the strategy tracks current position as well. It enters position when buy signal triggers, and flattens position when sell signal triggers. In this way, it realizes automated trading system based on SMA crossover.
The biggest advantage of this strategy is being simple and easy to understand and implement. SMA is a commonly used technical indicator and SMA crossover is one of the most common trading signals. This kind of indicator crossover strategies can be easily applied to different stocks and time range for automated trading.
Another advantage is that this strategy can be optimized by adjusting SMA parameters. For example, we can test different combinations of SMA periods to find the optimal one for specific stocks. Also, the strategy can be improved by adding other indicators for confirmation and optimization.
The biggest risk of this strategy is that indicator-based strategies tend to generate excessive false signals. For instance, price may frequently crossover SMA during range-bound periods, resulting in unnecessary trades.
Common solutions include setting stop loss, tuning parameters, or adding filter conditions. For example, we can set maximum loss ratio to limit risk, adjust SMA periods to find more stable parameters, or use other indicators to filter some trading signals.
The strategy can be optimized in the following aspects:
-
Test and select optimal SMA parameter combinations. Backtest different SMA lengths to find the best periods.
-
Add other indicators for filterSignal confirmation, like RSI, MACD etc. This helps filter false signals.
-
Incorporate stop loss logic. Set maximum tolerable loss or trailing stop to better control risks.
-
Optimize entry timing. Consider entering around major breakouts rather than strictly following SMA crossover.
-
Test composite strategies. Combine with other strategy types like trend following.
The strategy realizes automated trading with simple SMA crossover signals. The pros are being easy to understand and implement. The cons are excessive signals and prone to whipsaws. We can improve it by parameter tuning, adding filters, stop loss etc. The strategy provides us a basic framework. We can enrich it by incorporating more components.
[/trans]
Strategy Arguments
| Argument | Default | Description |
|---|---|---|
| v_input_int_1 | 2022 | Start Year |
| v_input_int_2 | 2022 | End Year |
| v_input_int_3 | true | Start Month |
| v_input_int_4 | 12 | End Month |
| v_input_int_5 | 21 | SMA Length |
| v_input_int_6 | 50 | 50 SMA Length |
| v_input_int_7 | 200 | 200 SMA Length |
Source (PineScript)
/*backtest
start: 2023-02-15 00:00:00
end: 2024-02-21 00:00:00
period: 1d
basePeriod: 1h
exchanges: [{"eid":"Futures_Binance","currency":"BTC_USDT"}]
*/

//@version=5
strategy("Price Cross Above/Below SMA Strategy", shorttitle="Tressy Strat", overlay=true)

// Define start and end year inputs
start_year = input.int(2022, title="Start Year")
end_year = input.int(2022, title="End Year")

// Define start and end month inputs
start_month = input.int(1, title="Start Month", minval=1, maxval=12)
end_month = input.int(12, title="End Month", minval=1, maxval=12)

// Define SMA length inputs
sma_length = input.int(21, title="SMA Length")
sma_length_50 = input.int(50, title="50 SMA Length")
sma_length_200 = input.int(200, title="200 SMA Length")

// Filter data within the specified date range
filter_condition = true
filtered_close = request.security(syminfo.tickerid, "D", close[0], lookahead=barmerge.lookahead_on)

// Define SMAs using the input lengths
sma = ta.sma(filtered_close, sma_length)
sma_50 = ta.sma(filtered_close, sma_length_50)
sma_200 = ta.sma(filtered_close, sma_length_200)

// Initialize position
var bool in_position = false

// Condition for a price cross above SMA within the date range
cross_above = filter_condition and ta.crossover(filtered_close, sma)

// Condition for a price cross below SMA within the date range
cross_below = filter_condition and ta.crossunder(filtered_close, sma)

// Buy condition
if cross_above
    in_position := true

// Sell condition
if cross_below
    in_position := false

// Strategy entry and exit
if cross_above
    strategy.entry("Buy", strategy.long)
if cross_below
    strategy.close("Buy")

// Plot the SMAs on the chart
plot(sma, color=color.blue, title="21 SMA")
plot(sma_50, color=color.red, title="50 SMA")
plot(sma_200, color=color.orange, title="200 SMA")

// Plot the Buy and Sell signals with "tiny" size
plotshape(cross_above, style=shape.triangleup, location=location.belowbar, color=color.green, size=size.tiny, title="Buy Signal")
plotshape(cross_below, style=shape.triangledown, location=location.abovebar, color=color.red, size=size.tiny, title="Sell Signal")
Detail
https://www.fmz.com/strategy/442558
Last Modified
2024-02-22 17:34:09