Name
基于价格偏离的趋势追踪策略Deviation-Based-Trend-Tracking-Strategy
Author
ChaoZhang
Strategy Description
[trans]
本策略基于价格偏离指标,结合费波那契回调区域,实现趋势的识别和追踪。当价格从某一方向偏离越来越远时,可判断为趋势形成,从而产生交易信号。
该策略使用VWAP作为价格的中轴线。然后根据价格中的波动性,计算出上下各1.618倍和2.618倍标准差的价格偏离带。当价格从下向上突破下轨时,产生做多信号;当价格从上向下突破上轨时,产生做空信号。
做多做空后的止损 EXIT 信号是:做多止损线为下轨,做空止损线为上轨。
具体来说,有以下几个步骤:
-
计算VWAP作为价格的中轴线
-
计算价格的标准差sd作为衡量价格波动性的指标
-
根据sd计算上下轨:上轨为 VWAP + 1.618sd 和 VWAP + 2.618sd;下轨为 VWAP - 1.618sd 和 VWAP - 2.618sd
-
当价格从下向上突破1.618倍下轨时,产生做多信号;当价格从上向下突破1.618倍上轨时,产生做空信号
-
做多止损 EXIT:价格突破2.618倍下轨;做空止损 EXIT:价格突破2.618倍上轨
该策略具有以下优势:
-
使用价格偏离指标,可以有效判断价格趋势和追踪趋势
-
结合费波那契回调区域,使 entrada 入场和止损退出更加明确
-
VWAP作为价格中轴线,也提高了指标的参考价值
-
通过参数调整,可以适应不同品种和周期
该策略也存在一些风险:
-
在趋势反转时,可能出现较大亏损
-
参数设置不当也会影响策略效果
-
价格剧烈波动时,止损风险较大
对策:
-
适当缩短持仓周期,及时止损
-
优化参数,寻找最佳参数组合
-
加大仓位管理,控制单笔亏损
该策略还可以从以下几个方向进行优化:
-
结合趋势指标,避免逆势交易
-
加入仓位管理机制
-
优化参数设置
-
在多时间周期上进行回测优化
本策略基于价格偏离思想,结合 VWAP 和费波那契标准差倍数区域,实现了对趋势的识别和追踪。相比单一使用均线等指标,本策略判断更为清晰,风险控制也更为明确。通过参数调整和优化,该策略可以适用于不同品种和周期,从而获取较好的策略效果。
||
This strategy identifies and tracks trends based on price deviation indicators combined with Fibonacci retracement areas. Trading signals are generated when the price deviates further and further from one direction.
The strategy uses VWAP as the midpoint line of the price. Then the upper and lower bands of 1.618 and 2.618 standard deviation of price fluctuations are calculated. A long signal is generated when the price breaks through the lower band upwards. A short signal is generated when the price breaks through the upper band downwards.
The stop loss EXIT signals after opening long or short positions are: the stop loss line for long positions is the lower band, and for short positions is the upper band.
Specifically, it involves the following steps:
-
Calculate VWAP as the midpoint line of the price
-
Calculate the standard deviation sd of the price as an indicator of price volatility
-
Calculate the upper and lower bands based on sd. The upper bands are VWAP + 1.618sd and VWAP + 2.618sd. The lower bands are VWAP - 1.618sd and VWAP - 2.618sd.
-
A long signal is generated when the price breaks through the 1.618 lower band upwards. A short signal is generated when the price breaks through the 1.618 upper band downwards.
-
Long stop loss EXIT: price breaks through 2.618 lower band; Short stop loss EXIT: price breaks through 2.618 upper band.
The strategy has the following advantages:
-
Price deviation indicators can effectively determine price trends and track trends
-
Fibonacci retracement areas make entry and stop loss exits clearer
-
VWAP as the midpoint line of the price also enhances the reference value of the indicator
-
Parameters can be adjusted to suit different products and timeframes
The strategy also has some risks:
-
It may incur greater losses during trend reversals
-
Improper parameter settings can also affect strategy performance
-
There is a higher stop loss risk during violent price fluctuations
Countermeasures:
-
Appropriately shorten the holding period and stop losses in time
-
Optimize parameters to find the best parameter combination
-
Increase position sizing management to control single loss
The strategy can also be optimized in the following areas:
-
Incorporate trend indicators to avoid counter trend trading
-
Add position sizing management mechanisms
-
Optimize parameter settings
-
Backtest and optimize over multiple timeframes
This strategy identifies and tracks trends based on the price deviation concept combined with VWAP and Fibonacci standard deviation bands. Compared to using single indicators like moving averages, this strategy has clearer judgments and risk control. Through parameter adjustment and optimization, the strategy can be adapted to different products and timeframes to achieve better performance.
[/trans]
Strategy Arguments
| Argument | Default | Description |
|---|---|---|
| v_input_1 | 1.618 | Fibo extension 1 |
| v_input_2 | 2.618 | Fibo extension 2 |
| v_input_3 | W | Resolution VWAP |
| v_input_4 | 150 | Deviation value min. |
Source (PineScript)
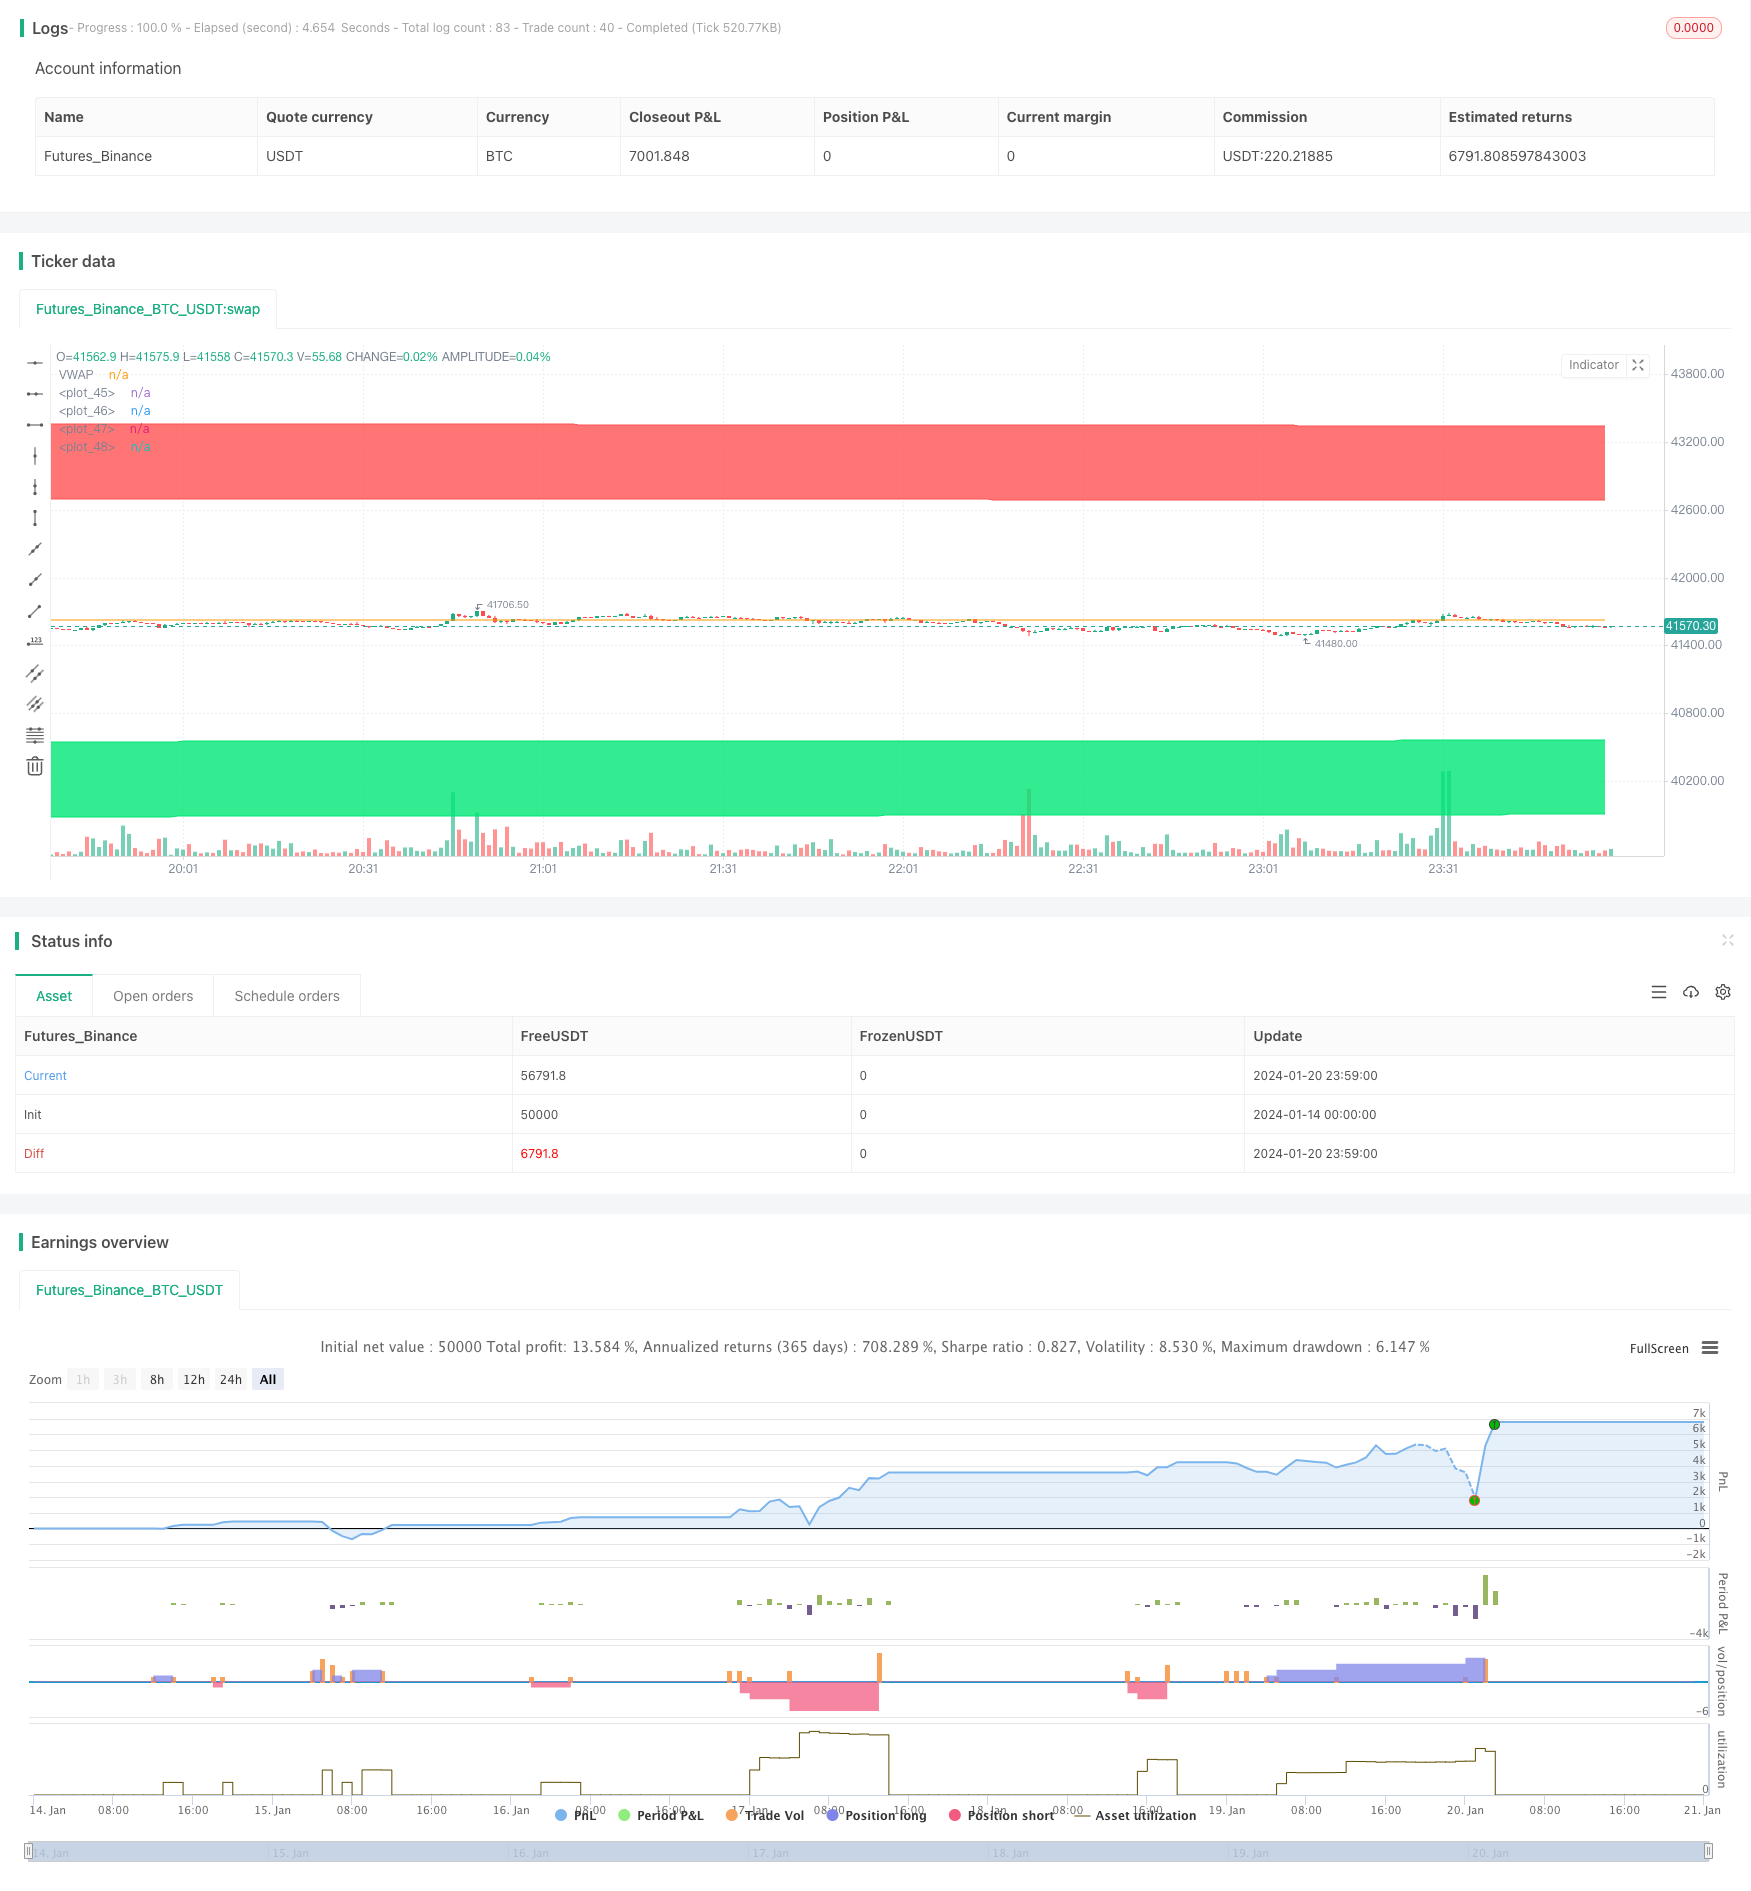
/*backtest
start: 2024-01-14 00:00:00
end: 2024-01-21 00:00:00
period: 1m
basePeriod: 1m
exchanges: [{"eid":"Futures_Binance","currency":"BTC_USDT"}]
*/

// This source code is subject to the terms of the Mozilla Public License 2.0 at https://mozilla.org/MPL/2.0/
// © Mysteriown

//@version=4
strategy(title="VWAP + Fibo Dev Extensions Strategy", overlay=true, pyramiding=5, commission_value=0.08)

// -------------------------------------
// ------- Inputs Fibos Values ---------
// -------------------------------------

fib1 = input(title="Fibo extension 1", type=input.float, defval=1.618)
fib2 = input(title="Fibo extension 2", type=input.float, defval=2.618)
reso = input(title="Resolution VWAP", type=input.resolution, defval="W")
dev = input(title="Deviation value min.", type=input.integer, defval=150)


// -------------------------------------
// -------- VWAP Calculations ----------
// -------------------------------------

t = time(reso)
debut = na(t[1]) or t > t[1]

addsource = hlc3 * volume
addvol = volume
addsource := debut ? addsource : addsource + addsource[1]
addvol := debut ? addvol : addvol + addvol[1]
VWAP = addsource / addvol

sn = 0.0
sn := debut ? sn : sn[1] + volume * (hlc3 - VWAP[1]) * (hlc3 - VWAP)
sd = sqrt(sn / addvol)

Fibp2 = VWAP + fib2 * sd
Fibp1 = VWAP + fib1 * sd
Fibm1 = VWAP - fib1 * sd
Fibm2 = VWAP - fib2 * sd


// -------------------------------------
// -------------- Plots ----------------
// -------------------------------------

plot(VWAP, title="VWAP", color=color.orange)
pFibp2 = plot(Fibp2, color=color.red)
pFibp1 = plot(Fibp1, color=color.red)
pFibm1 = plot(Fibm1, color=color.lime)
pFibm2 = plot(Fibm2, color=color.lime)

fill(pFibp2,pFibp1, color.red)
fill(pFibm2,pFibm1, color.lime)


// -------------------------------------
// ------------ Positions --------------
// -------------------------------------

bull = crossunder(low[1],Fibm1[1]) and low[1]>=Fibm2[1] and low>Fibm2 and low<Fibm1 and sd>dev
bear = crossover(high[1],Fibp1[1]) and high[1]<=Fibp2[1] and high<Fibp2 and high>Fibp1 and sd>dev

//plotshape(bear, title='Bear', style=shape.triangledown, location=location.abovebar, color=color.red, offset=0)
//plotshape(bull, title='Bull', style=shape.triangleup, location=location.belowbar, color=color.green, offset=0)


// -------------------------------------
// --------- Strategy Orders -----------
// -------------------------------------

strategy.entry("Long", true, when = bull)
strategy.close("Long", when = crossover(high,VWAP) or crossunder(low,Fibm2))

strategy.entry("Short", false, when = bear)
strategy.close("Short", when = crossunder(low,VWAP) or crossover(high,Fibp2))
Detail
https://www.fmz.com/strategy/439617
Last Modified
2024-01-22 11:51:28