Name
基于动量趋势同步策略Momentum-Trend-Synergy-Strategy
Author
ChaoZhang
Strategy Description
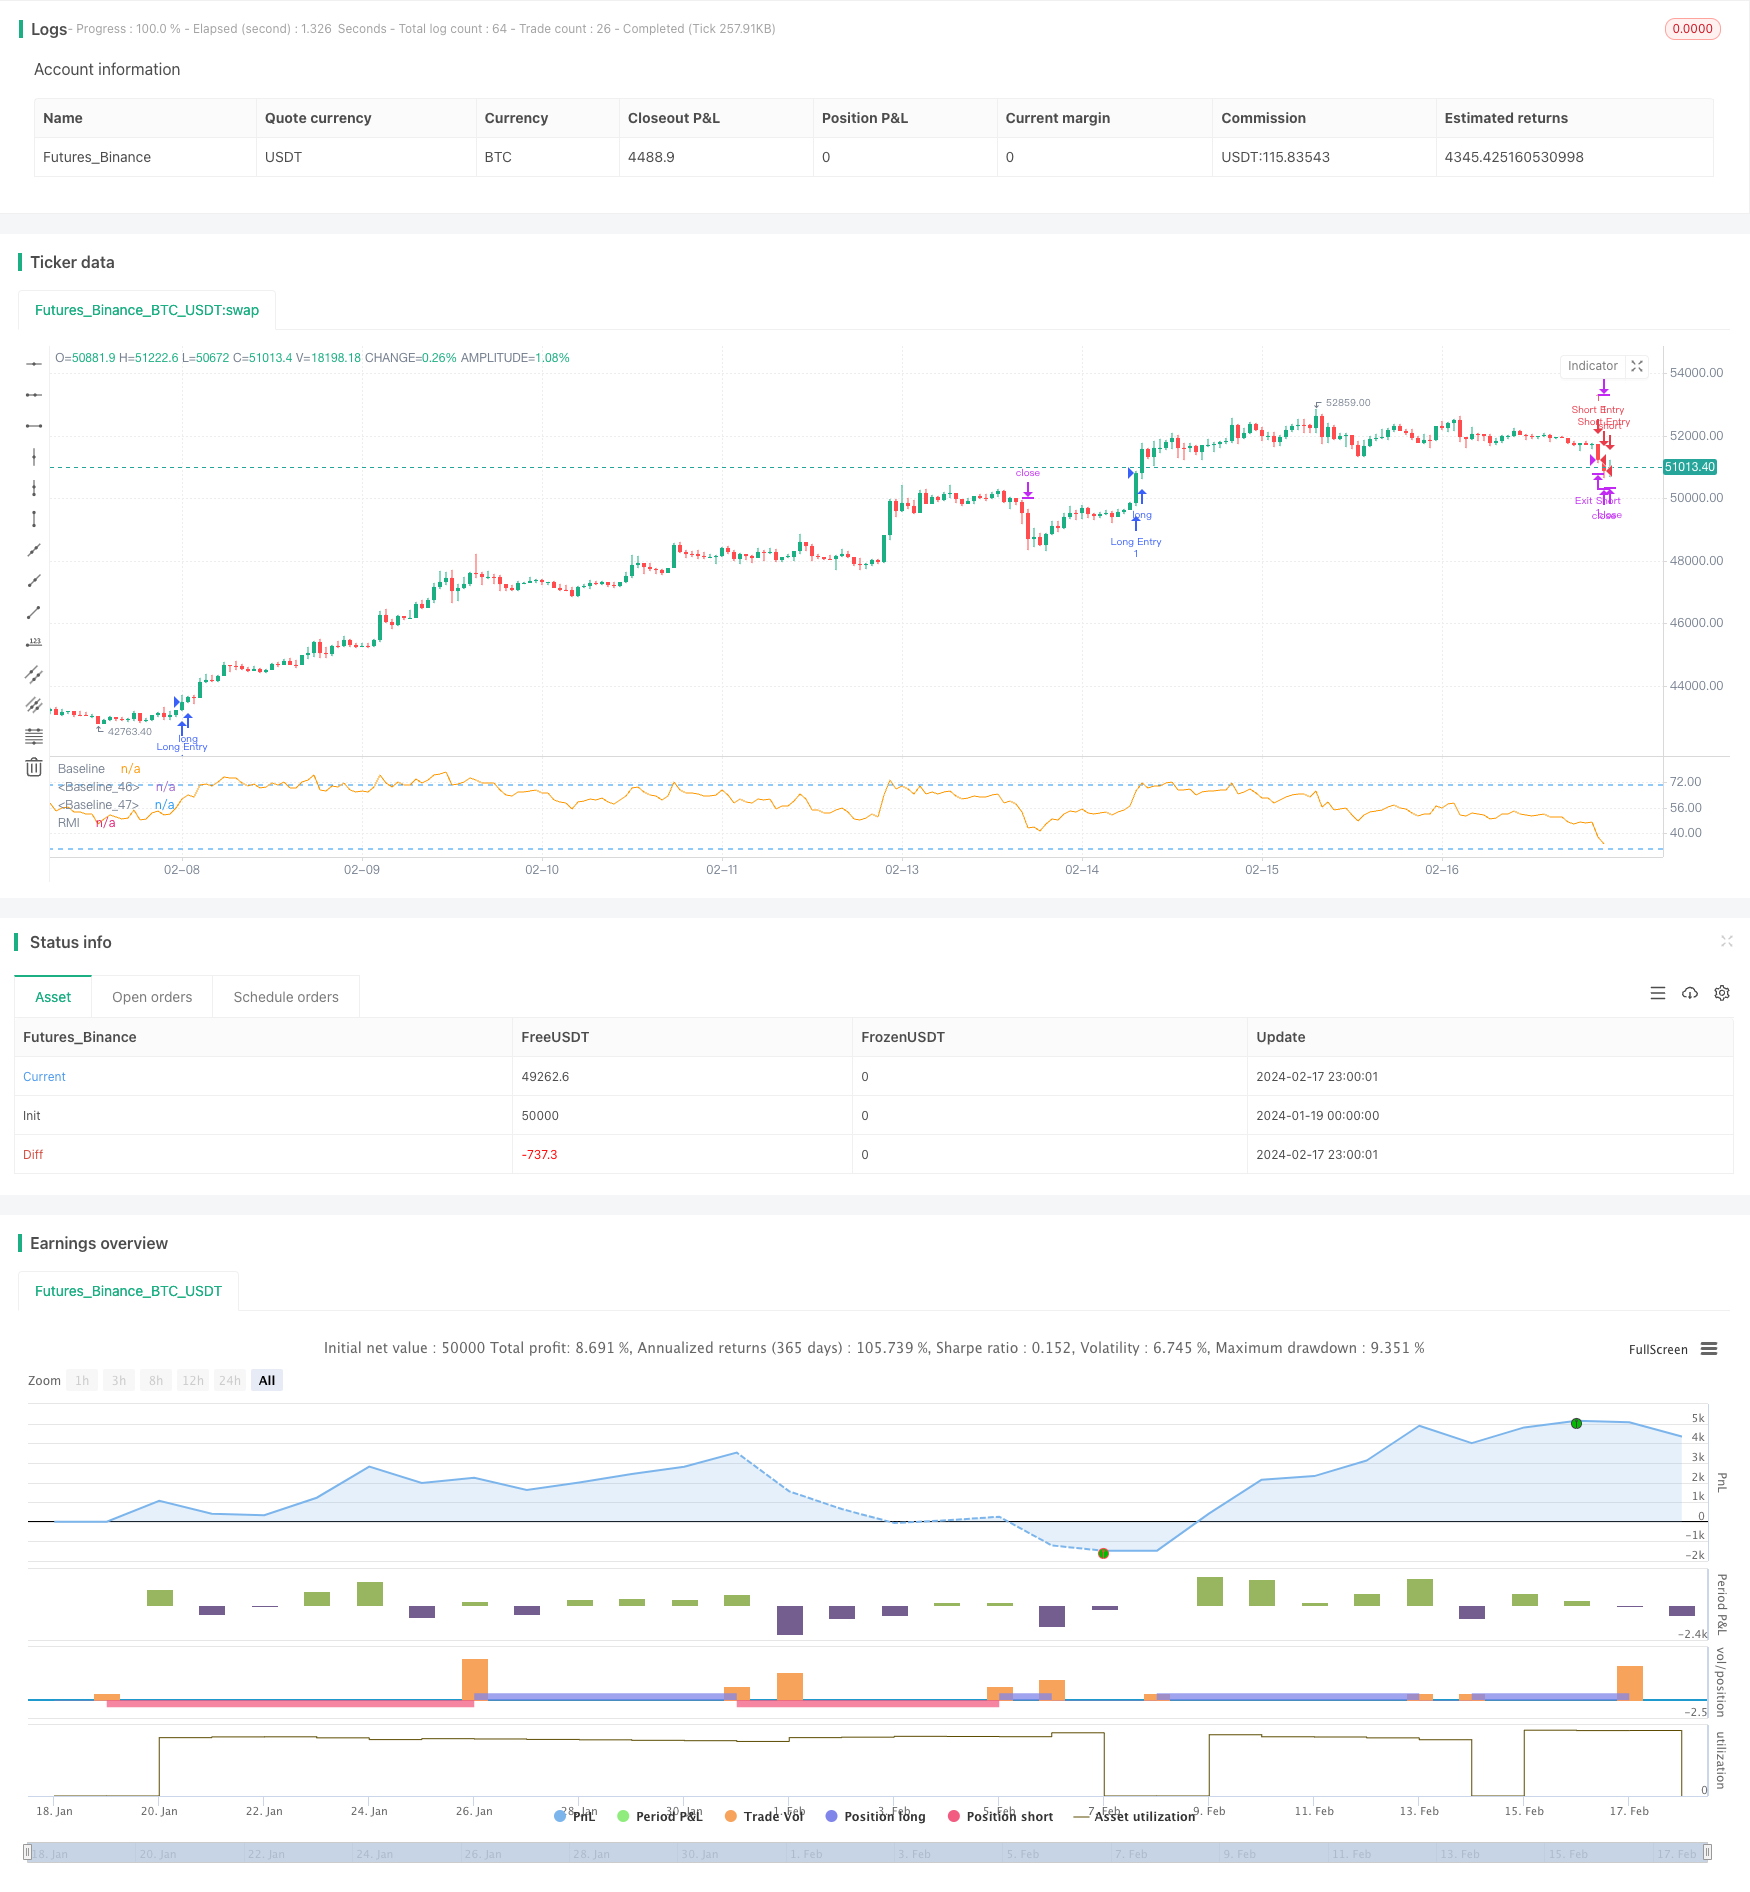
动量趋势同步策略是一种结合了相对动量指数(RMI)和自定义的presentTrend指标的交易策略。该策略采用了多层次方法,将动量分析与趋势判断相结合,为交易者提供更加灵活和敏感的交易机制。
RMI指标是相对强弱指数(RSI)的变体,它测量的是价格上涨和下跌的动量大小相对于之前一段时间的价格变化。其计算公式为:
RMI = 100 - 100/(1 + 上涨平均数/下跌平均数)
- 上涨平均数是过去N周期的平均上涨数
- 下跌平均数是过去N周期的平均下跌数
RMI指标的值介于0到100之间,数值越大表示上涨势头越强,数值越小表示下跌势头越强。
presentTrend指标结合真实波动范围(ATR)和移动平均线来判断趋势方向和动态支撑或阻力位。其计算公式为:
-
上轨:移动平均线 + (ATR × F)
-
下轨:移动平均线 - (ATR × F)
-
移动平均线是过去M周期的收盘价平均值
-
ATR是过去M周期的平均真实波动范围
-
F是调整灵敏度的乘数
当价格突破presentTrend的上下轨时,表示趋势发生转变,可能的入场或离场信号点。
入场条件:
- 做多:当RMI超过阈值(如60),表示强烈的牛市势头,同时价格高于presentTrend上轨,确认趋势向上时,做多入场。
- 做空:当RMI低于阈值(如40),表示强烈的熊市势头,同时价格低于presentTrend下轨,确认趋势向下时,做空入场。
离场条件(带有动态止损):
- 做多离场:当价格跌破presentTrend下轨或RMI回落至中性区域,提示牛势减弱时离场。
- 做空离场:当价格涨破presentTrend上轨或RMI回升至中性区域,提示熊势减弱时离场。
动态止损的计算公式:
- 做多头寸:入场后以presentTrend下轨作为离场价格
- 做空头寸:入场后以presentTrend上轨作为离场价格
该策略的优势在于融合了RMI的动量判断和presentTrend的趋势及动态止损,能够在跟踪趋势的同时,有效控制风险。
该策略具有以下优势:
- 多层次判断机制,结合动量指标和趋势指标,提高决策效率
- 动态止损机制,能够根据市场变化调整止损位置,有效控制风险
- 可根据个人偏好选择做多、做空或双向交易,灵活性强
- RMI Parameter可调整,适应不同周期判断
- presentTrend Parameter可调整,可控制策略的敏感度
该策略也存在一定的风险:
- 交易信号较多,容易过度交易而增加交易成本和滑点风险
- 双重判断机制,可能错过部分交易机会
- 需适当调整参数,与自己的交易风格匹配
- 仍需人工判断大的趋势方向,避免逆势交易
可以通过适当放宽入场条件,优化参数组合,结合趋势判断来降低上述风险。
该策略可以从以下几个方向进行优化:
- 结合波动率指标,避免高波动时的误入场
- 增加量能指标判断,确保有足够的目前力支持入场
- 优化动态止损的幅度,在保证止损的同时争取更大盈利
- 添加重新入场条件,充分捕捉趋势机会
- 参数优化和回测,找到最优参数以最大化收益率
动量趋势同步策略是一种多层次的交易策略,同时考量动量指标和趋势指标,具有判断精准、风险控制优良的特点。该策略可根据个人偏好进行灵活调整,深度优化后,能够充分发挥趋势捕捉的优势,是一种值得推荐的交易策略。
||
The Momentum Trend Synergy Strategy combines the Relative Momentum Index (RMI) and a custom presentTrend indicator into one powerful trading approach. This multifaceted strategy integrates momentum analysis with trend direction to provide traders with a more nuanced and responsive trading mechanism.
The RMI is a variation of the Relative Strength Index (RSI) that measures the momentum of up moves and down moves relative to previous price changes over a given period. The RMI over N periods is calculated as:
RMI = 100 - 100/(1 + Upward Avg/Downward Avg)
- Upward Avg is the average upward price change over N periods.
- Downward Avg is the average downward price change over N periods.
RMI values range from 0 to 100. Higher figures indicate stronger upward momentum while lower values suggest stronger downward momentum.
The presentTrend indicator combines Average True Range (ATR) with a moving average to determine trend direction and dynamic support/resistance levels. presentTrend over M periods and multiplier F is:
-
Upper Band: MA + (ATR x F)
-
Lower Band: MA - (ATR x F)
-
MA is the moving average close over M periods.
-
ATR is the Average True Range over M periods.
-
F is the multiplier to adjust sensitivity.
Trend direction switches when price crosses the presentTrend bands, signaling potential entry or exit points.
Entry Conditions:
- Long Entry: Triggered when RMI exceeds a threshold like 60, indicating strong bullish momentum, and price is above presentTrend upper band, confirming uptrend.
- Short Entry: Occurs when RMI drops below a threshold like 40, showing strong bearish momentum, and price is below presentTrend lower band, indicating a downtrend.
Exit Conditions with Dynamic Trailing Stop:
- Long Exit: Initiated when price crosses below presentTrend lower band or when RMI falls back towards neutral, suggesting weakening bullish momentum.
- Short Exit: Executed when price crosses above presentTrend upper band or when RMI rises towards neutral, indicating weakening bearish momentum.
Equations for Dynamic Trailing Stop:
- For Long Positions: Exit price is set at lower presentTrend band once entry condition is met.
- For Short Positions: Exit price is determined by upper presentTrend band post-entry.
The dual analysis of RMI momentum and presentTrend direction/trailing stop is the strength of this strategy. It aims to enter trending moves early and exit positions strategically to maximize gains and reduce losses across various market conditions.
The advantages of this strategy include:
- Multilayered decision framework combining momentum and trend indicators improves efficiency.
- Dynamic trailing stops adjust to markets to effectively manage risk.
- Flexibility in trade direction caters to preferences and market conditions.
- Customizable RMI and presentTrend parameters suit different trading timeframes and sensibilities.
Potential risks to consider:
- More signals may increase overtrading, costs, slippage.
- Dual analysis judges may miss some trade opportunities.
- Parameters need alignment with personal trading style.
- Requires manual trend direction bias to avoid counter-trend trades.
Proper parameter optimization, trend alignment, and refinements to entry logic can reduce the above risks.
Areas for strategy improvement include:
- Incorporate volatility indicator to avoid high volatility false signals.
- Add volume analysis to ensure sufficient momentum on entries.
- Optimize dynamic stop loss levels to balance protection and profitability.
- Introduce re-entry conditions to fully capitalize on trends.
- Parameter optimization and backtesting to maximize return metrics.
The Momentum Trend Synergy Strategy provides a multilayered approach, incorporating both momentum and trend indicators for accurate and risk-managed trading. The high customizability of this strategy allows traders to tailor it to their personal style and market environments. When optimized, it can fully leverage its trend-capturing capabilities for strong performance. Thus, it represents a recommended addition for most trading toolboxes.
[/trans]
Strategy Arguments
| Argument | Default | Description |
|---|---|---|
| v_input_string_1 | 0 | Trade Direction: Both |
| v_input_int_1 | 21 | RMI Length |
| v_input_int_2 | 5 | presentTrend Length |
| v_input_float_1 | 4 | presentTrend Multiplier |
Source (PineScript)
/*backtest
start: 2024-01-19 00:00:00
end: 2024-02-18 00:00:00
period: 1h
basePeriod: 15m
exchanges: [{"eid":"Futures_Binance","currency":"BTC_USDT"}]
*/

// This Pine Script™ code is subject to the terms of the Mozilla Public License 2.0 at https://mozilla.org/MPL/2.0/
// © PresentTrading

//@version=5
strategy("PresentTrend RMI Synergy - Strategy [presentTrading]", shorttitle="PresentTrend RMI Synergy - Strategy [presentTrading]", overlay=false)

// Inputs
tradeDirection = input.string("Both", title="Trade Direction", options=["Long", "Short", "Both"])
lengthRMI = input.int(21, title="RMI Length")
lengthSuperTrend = input.int(5, title="presentTrend Length")
multiplierSuperTrend = input.float(4.0, title="presentTrend Multiplier")

// RMI Calculation
up = ta.rma(math.max(ta.change(close), 0), lengthRMI)
down = ta.rma(-math.min(ta.change(close), 0), lengthRMI)
rmi = 100 - (100 / (1 + up / down))

// PresentTrend Dynamic Threshold Calculation (Simplified Example)
presentTrend = ta.sma(close, lengthRMI) * multiplierSuperTrend // Simplified for demonstration

// SuperTrend for Dynamic Trailing Stop
atr = ta.atr(lengthSuperTrend)
upperBand = ta.sma(close, lengthSuperTrend) + multiplierSuperTrend * atr
lowerBand = ta.sma(close, lengthSuperTrend) - multiplierSuperTrend * atr
trendDirection = close > ta.sma(close, lengthSuperTrend) ? 1 : -1
// Entry Logic
longEntry = rmi > 60 and trendDirection == 1
shortEntry = rmi < 40 and trendDirection == -1

// Exit Logic with Dynamic Trailing Stop
longExitPrice = trendDirection == 1 ? lowerBand : na
shortExitPrice = trendDirection == -1 ? upperBand : na

// Strategy Execution
if (tradeDirection == "Long" or tradeDirection == "Both") and longEntry
    strategy.entry("Long Entry", strategy.long)
    strategy.exit("Exit Long", stop=longExitPrice)

if (tradeDirection == "Short" or tradeDirection == "Both") and shortEntry
    strategy.entry("Short Entry", strategy.short)
    strategy.exit("Exit Short", stop=shortExitPrice)

// Visualization
plot(rmi, title="RMI", color=color.orange)
hline(50, "Baseline", color=color.white)
hline(30, "Baseline", color=color.blue)
hline(70, "Baseline", color=color.blue)
Detail
https://www.fmz.com/strategy/442117
Last Modified
2024-02-19 14:48:37