Name
基于动量震荡交易策略Momentum-Swing-Trading-Strategy
Author
ChaoZhang
Strategy Description
本策略是一个基于动量技术的日间隔震荡交易策略,使用ATR止损。该策略由Stably的Kory Hoang制作。
策略利用动量指标识别趋势方向,结合ATR指标设置止损线,实现低买高卖的震荡交易策略。
代码中首先设置了回测的时间范围。
然后是指标部分,计算了以下几个指标:
- atr(): 计算ATR指标,用于设置止损;
- max_/min_: 记录上一根K线的最高价/最低价;
- is_uptrend: 判断是否处于上升趋势;
- vstop: 止损线;
判断趋势的主要逻辑是:
如果close高于之前下跌的止损线vstop,则判断为上升趋势;如果close低于之前上涨的止损线vstop,则判断为下降趋势。
在趋势发生转变时,调整止损线的位置。
具体来说,在上升趋势时,止损线定为之前K线最高价减去ATR的数值;在下降趋势时,止损线定为之前K线最低价加上ATR的数值。
这样可以实现趋势跟踪止损。
交易规则部分,在突破止损线时开仓做多做空。
该策略具有以下优势:
- 使用动量技术判断趋势方向,及时捕捉转折点,避免假突破。
- ATR止损跟踪最高价/最低价,可以很好控制风险。
- 策略逻辑简单清晰,容易理解实现。
- 可在趋势间实现低买高卖的震荡交易。
该策略也存在一些风险:
- ATR数值选择不当可能导致止损过于宽松或过于紧凑。
- 震荡趋势中可能出现剧烈波动,连续止损。
- 交易次数可能较多,手续费成本较高。
可以从以下几个方面进行优化:
- 测试不同的ATR参数,找到最优参数组合。
- 在ATR基础上结合波动率指标优化止损线。
- 结合趋势过滤,避免震荡市无谓开仓。
该策略可以从以下几个方向进行优化:
-
测试不同的ATR参数,找到最优参数组合。可以回测多组参数,评估收益风险比。
-
在ATR基础上结合波动率指标优化止损线。可以引入波动率指标,在波动加大时适当放宽止损幅度。
-
结合趋势过滤,避免震荡市无谓开仓。可以增加趋势判断指标,只在趋势明确时开仓。
-
增加仓位管理机制。可以根据资金利用率、连续止损次数等调整仓位。
-
增加夜间隔隙风险控制。可以在收盘前主动止损,避免隔夜价格跳空。
本策略作为一个基础的日内震荡交易策略,总体思路清晰,使用动量技术判断趋势,并利用ATR指标进行滑点跟踪止损,可以有效控制风险。
优化空间还很大,后续可以从趋势判断、止损方式、仓位管理等多个角度进行改进,使策略更适合实盘交易。总体来说,本策略为量化交易提供了一个不错的基础框架。
||
This is a daily interval swing trading strategy based on momentum techniques using ATR Stops. It was created by Kory Hoang from Stably.
The strategy identifies trend direction using momentum indicators and sets stop loss lines based on ATR to implement low-buy-high-sell swing trading.
The code first sets the backtesting time range.
Then in the indicator section, the following indicators are calculated:
- atr(): calculate ATR for stop loss;
- max_/min_: highest/lowest price of the previous bar;
- is_uptrend: judge if it's in an uptrend;
- vstop: stop loss line;
The main logic to judge trend is:
If close is higher than the previous downside stop loss line vstop, it's judged as an uptrend; if close is lower than the previous upside stop loss line vstop, it's judged as a downtrend.
When trend changes, adjust the stop loss line position.
Specifically, in an uptrend, the stop loss line is set to the highest price of the previous bar minus the ATR value; in a downtrend, the stop loss line is set to the lowest price of the previous bar plus the ATR value.
This realizes trend following stop loss.
In the trading rules section, open long/short positions when price breaks the stop loss line.
The advantages of this strategy:
- Judge trend direction using momentum techniques, timely catch turning points and avoid false breakouts.
- ATR stop loss traces highest/lowest price, can control risk well.
- Simple and clear strategy logic, easy to understand and implement.
- Can make low-buy-high-sell trades between swings.
There are also some risks:
- Improper ATR parameter may cause stop loss to be too loose or too tight.
- Fierce whipsaws may happen in ranging trends, causing consecutive stop loss.
- High trading frequency, higher commissions.
Some optimizations:
- Test different ATR parameters to find the optimal.
- Optimize stop loss combining volatility metrics on top of ATR.
- Add trend filter to avoid unnecessary trades during choppy markets.
Some directions to optimize this strategy:
-
Test different ATR parameters to find the optimal. Backtest multiple parameter sets and evaluate return/risk ratio.
-
Optimize stop loss combining volatility metrics on top of ATR. Add volatility metrics, relax stop loss properly during periods of increasing volatility.
-
Add trend filter to avoid trades during choppy market. Add trend judgment indicators, only trade when trend is clear.
-
Add position sizing mechanism. Adjust position size based on account utilization ratio, consecutive stop loss times etc.
-
Add overnight gap risk control. Actively cut loss before market close to avoid overnight gap risk.
As a basic daily swing trading strategy, the overall logic is clear. It judges trend with momentum techniques and utilizes ATR for trailing stop loss, effectively controlling risk.
Still large room for optimization, can improve from aspects like trend judgment, stop loss method, position sizing etc. to make the strategy more practical. Overall this strategy provides a solid framework for quantitative trading.
[/trans]
Strategy Arguments
| Argument | Default | Description |
|---|---|---|
| v_input_1 | true | From Month |
| v_input_2 | true | From Day |
| v_input_3 | 2010 | From Year |
| v_input_4 | 12 | To Month |
| v_input_5 | 31 | To Day |
| v_input_6 | 2020 | To Year |
| v_input_7 | 3 | length |
| v_input_8 | true | mult |
| v_input_9 | true | Strategy Direction |
Source (PineScript)
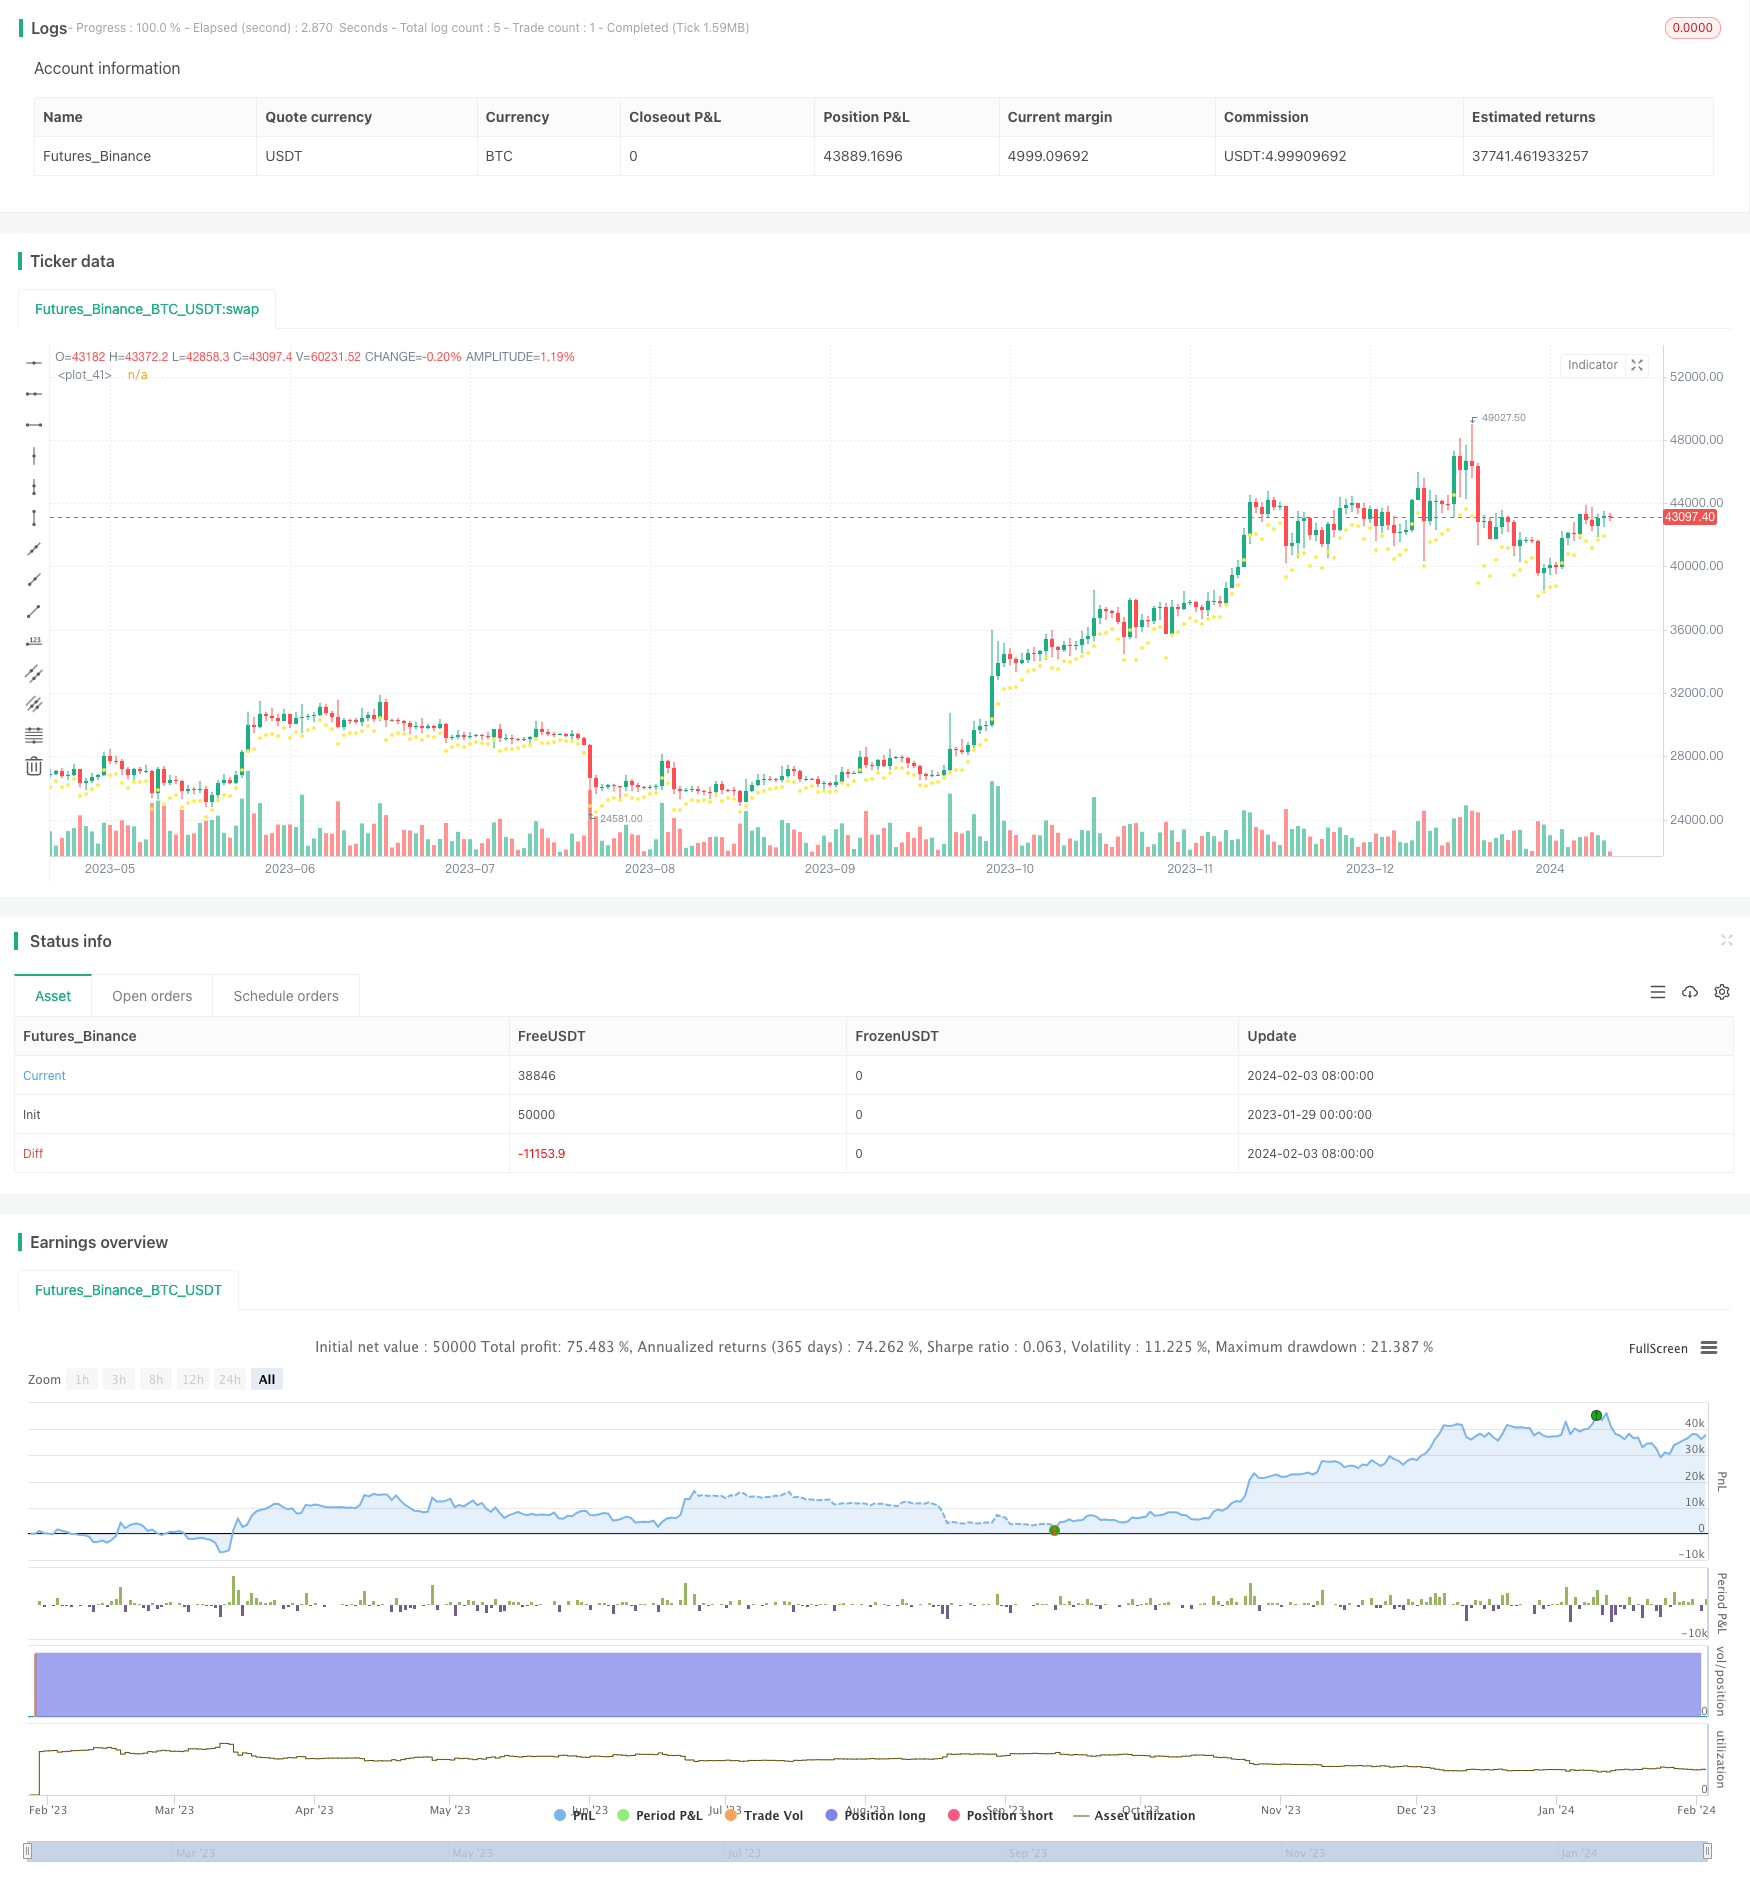
/*backtest
start: 2023-01-29 00:00:00
end: 2024-02-04 00:00:00
period: 1d
basePeriod: 1h
exchanges: [{"eid":"Futures_Binance","currency":"BTC_USDT"}]
*/

//@version=2
strategy("BTC Swinger", overlay=true, commission_value = 0.25, default_qty_type=strategy.percent_of_equity, default_qty_value = 100)

/////////////////////////////////////////////////////////////
//START - SET DATE RANGE

// === BACKTEST RANGE ===
FromMonth = input(defval = 1, title = "From Month", minval = 1)
FromDay   = input(defval = 1, title = "From Day", minval = 1)
FromYear  = input(defval = 2010, title = "From Year")
ToMonth   = input(defval = 12, title = "To Month", minval = 1)
ToDay     = input(defval = 31, title = "To Day", minval = 1)
ToYear    = input(defval = 2020, title = "To Year")

startDate = time > timestamp(FromYear, FromMonth, FromDay, 1, 1)
endDate = time < timestamp(ToYear, ToMonth, ToDay, 23, 59)
withinTimeRange = true

/////////////////////////////////////////////////////////////
//END - SET DATE RANGE


/////////////////////////////////////////////////////////////
//START - INDICATORS

length = input(3)
mult = input(1, minval = 0.01)
atr_ = atr(length)
max1 = max(nz(max_[1]), close)
min1 = min(nz(min_[1]), close)
is_uptrend_prev = nz(is_uptrend[1], true)
stop = is_uptrend_prev ? max1 - mult * atr_ : min1 + mult * atr_
vstop_prev = nz(vstop[1])
vstop1 = is_uptrend_prev ? max(vstop_prev, stop) : min(vstop_prev, stop)
is_uptrend = close - vstop1 >= 0
is_trend_changed = is_uptrend != is_uptrend_prev
max_ = is_trend_changed ? close : max1
min_ = is_trend_changed ? close : min1
vstop = is_trend_changed ? is_uptrend ? max_ - mult * atr_ : min_ + mult * atr_ : vstop1
plot(vstop, color = is_uptrend ? yellow : red, style=circles, linewidth=2)

/////////////////////////////////////////////////////////////
//END - INDICATORS


/////////////////////////////////////////////////////////////
//START - TRADING RULES
direction = input(defval=1, title = "Strategy Direction", minval=-1, maxval=1)
strategy.risk.allow_entry_in(direction == 0 ? strategy.direction.all : (direction < 0 ? strategy.direction.short : strategy.direction.long))

condition1 = close > vstop and withinTimeRange
condition2 = close < vstop and withinTimeRange

strategy.entry("BUY", strategy.long, when = condition1)
strategy.entry("SELL", strategy.short, when = condition2)

/////////////////////////////////////////////////////////////
//END - TRADING RULES
Detail
https://www.fmz.com/strategy/441051
Last Modified
2024-02-05 10:44:19