Name
基于卡马和均线的趋势跟踪策略Kama-and-Moving-Average-Based-Trend-Following-Strategy
Author
ChaoZhang
Strategy Description
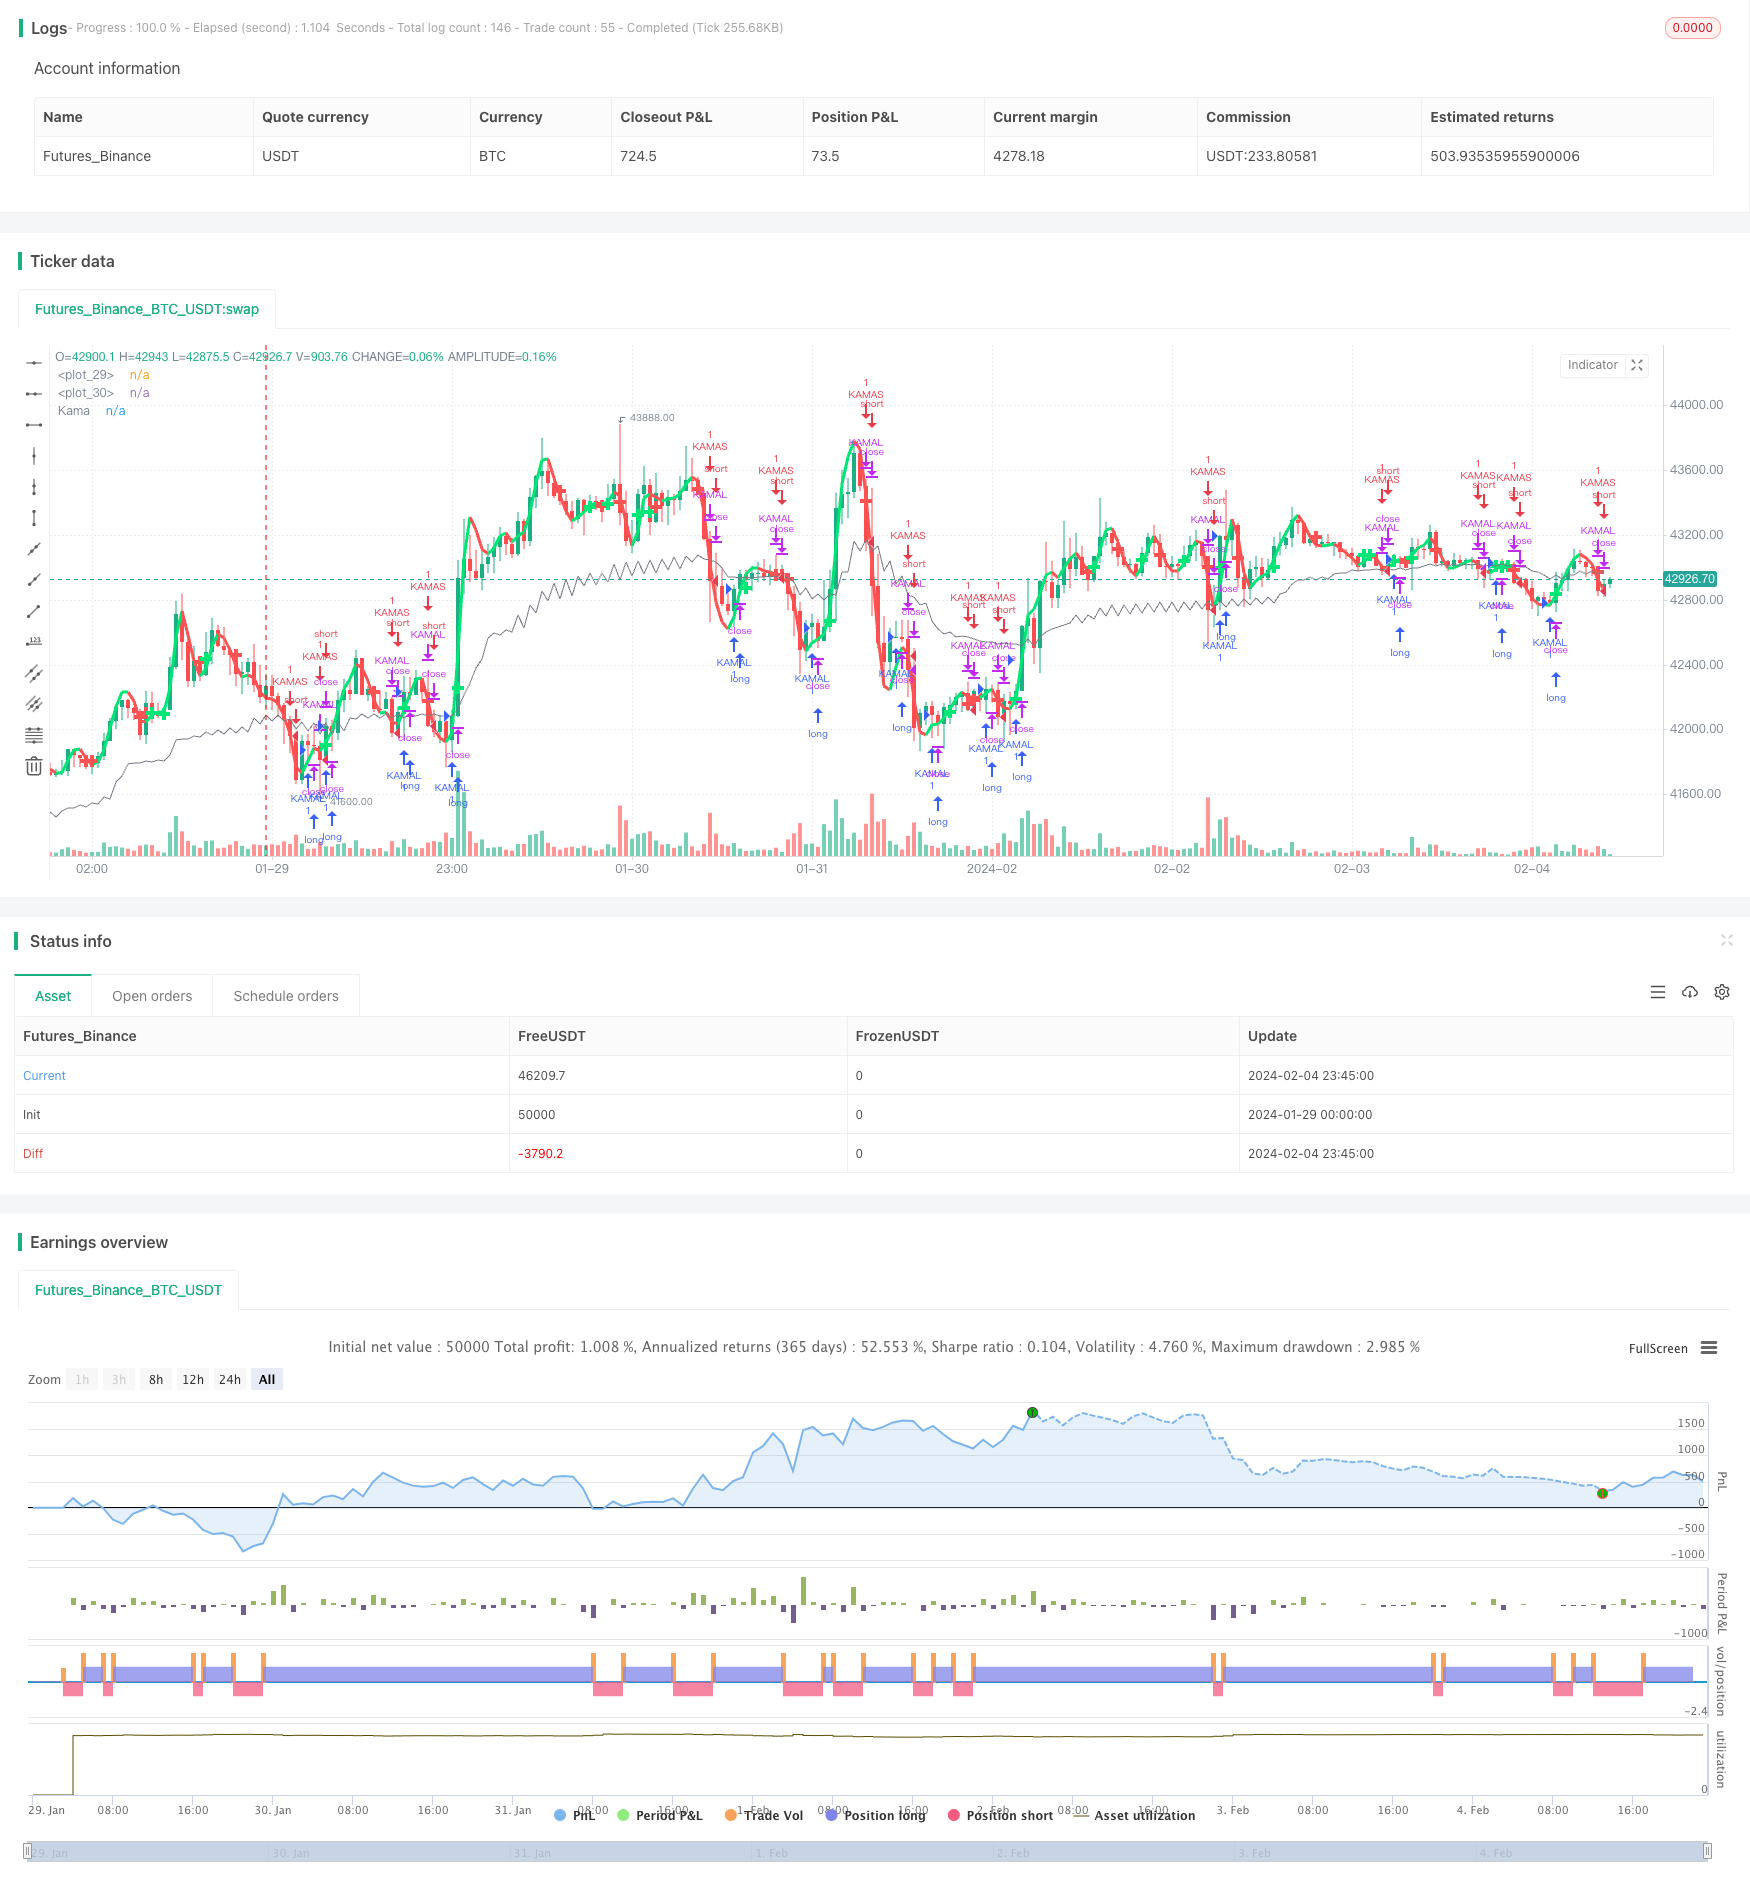
本策略的核心思想是结合卡马均线指标和均线指标来识别市场趋势,实现趋势跟踪。当卡马均线和均线发生黄金交叉时,判断为进入上涨趋势,做多;当卡马均线和均线发生死亡交叉时,判断为进入下跌趋势,做空。
- 计算卡马均线。卡马均线(Kama)是一种对市场噪音较为敏感的趋势跟踪指标,可以用来判断价格趋势。
- 计算均线。这里计算了2档均线,一是较快的双重指数移动平均线,另一个是普通的加权移动平均线。
- 当快线从下方向上突破慢线时,做多;当快线从上方向下跌破慢线时,做空。这样就完成了趋势判断和跟踪。
- 在入场后,当价格突破卡马均线时退出仓位,实现趋势跟踪退出。
- 该策略结合卡马均线和均线指标,可以对市场趋势作出比较准确判断,实现趋势跟踪,回撤控制能力较强。
- 卡马均线对市场噪音比较敏感,可以提前发现趋势转折点。
- 均线组合判断清晰,操作规范,容易理解。
- 策略参数优化空间大,可以根据不同品种和交易品种进行参数调整优化。
- 卡马均线和均线组合判断市场趋势时,也会出现误判的可能。需要结合其他指标来验证判断。
- 无止损设置,在异常行情下,可能带来较大亏损。
- 参数设置不恰当时,也会导致判断失误,需要根据不同品种调整参数。
- 可以考虑加入ATR指标进行止损设置。
- 可以测试不同参数对策略收益率的影响,选择最优参数。
- 可以考虑加入其他指标的验证,如震荡指标,提高判断准确率。
- 可以建立参数自适应和动态优化的框架,使策略参数可以自动优化。
本策略总体思路清晰,利用卡马均线和均线指标的黄金交叉与死亡交叉来判断和跟踪趋势,回撤控制能力较强,通过参数调整和优化,可以获得较好的效果。但也存在一定的改进空间,如果加入更多验证指标和止损模块,可以进一步增强策略的稳定性和收益能力。
||
The core idea of this strategy is to identify market trends by combining Kama moving average and moving average indicators to achieve trend following. When the Kama moving average and moving average have a golden cross, it is judged that an uptrend has begun and long position is taken. When the Kama moving average and moving average have a death cross, it is judged that a downtrend has begun and short position is taken.
-
Calculate Kama moving average. Kama moving average is a trend-following indicator that is more sensitive to market noise and can be used to determine price trends.
-
Calculate moving averages. Two moving averages are computed here, one is a faster double exponential moving average, the other is a normal weighted moving average.
-
When the fast line breaks through the slow line from below, go long. When the fast line breaks down through the slow line from above, go short. So the trend judgment and tracking is completed.
-
After taking positions, exit when price breaks through the Kama line to achieve trend following exit.
-
The strategy combines Kama moving average and moving average indicators to make relatively accurate judgments on market trends and achieve trend following with strong drawdown control capability.
-
Kama moving average is more sensitive to market noise and can detect trend reversal points in advance.
-
The moving average combination judgment is clear and easy to understand.
-
The strategy has large parameter optimization space and the parameters can be adjusted and optimized for different varieties and trading instruments.
-
There is still possibility of misjudgment when Kama moving average and moving average combination judges market trend. Other indicators are needed to verify.
-
No stop loss setting may lead to larger losses in extreme market conditions.
-
Inappropriate parameter settings can also cause judgment errors. Parameters need to be adjusted according to different varieties.
-
Consider adding ATR indicator for stop loss setting.
-
Test the impact of different parameter values on strategy return to find the optimal parameters.
-
Consider adding other indicators for verification, such as the oscillator indicator, to improve judgment accuracy.
-
Build parameter self-adaptive and dynamic optimization framework for automatic parameter optimization.
The overall idea of this strategy is clear, using Kama moving average and moving average golden cross and death cross to determine and follow trends with strong drawdown control capability. Through parameter tuning and optimization, good results can be obtained. But there is still room for improvement. By adding more verification indicators and stop loss modules, the stability and profitability of the strategy can be further enhanced.
[/trans]
Strategy Arguments
| Argument | Default | Description |
|---|---|---|
| v_input_1 | 8 | kamaPeriod |
| v_input_2 | 4 | ROCLength |
| v_input_3 | 7 | period |
Source (PineScript)
/*backtest
start: 2024-01-29 00:00:00
end: 2024-02-05 00:00:00
period: 45m
basePeriod: 5m
exchanges: [{"eid":"Futures_Binance","currency":"BTC_USDT"}]
*/

//@version=2
//synapticex.com
kamaPeriod = input(8, minval=1)
ROCLength=input(4, minval=1)

kama(length)=>
    volatility = sum(abs(close-close[1]), length)
    change = abs(close-close[length-1])
    er = iff(volatility != 0, change/volatility, 0)
    sc = pow((er*(0.666666-0.064516))+0.064516, 2)
    k = nz(k[1])+(sc*(hl2-nz(k[1])))


n=input(title="period",defval=7)

n2ma=2*wma(close,round(n/2))
nma=wma(close,n)
diff=n2ma-nma
sqn=round(sqrt(n))

n2ma1=2*wma(close[1],round(n/2))
nma1=wma(close[1],n)
diff1=n2ma1-nma1
sqn1=round(sqrt(n))

n1=wma(diff,sqn)
n2=wma(diff1,sqn)
c=n1>n2?lime:red
ma=plot(n1,color=c, linewidth = 3)
plot(cross(nma, nma1) ? nma : na, style = cross, color = c, linewidth = 5)

kamaEntry = request.security(syminfo.tickerid,timeframe.period,kama(kamaPeriod))

plot(kamaEntry, color=gray, title="Kama",transp=0, trackprice=false, style=line)


strategy("Kama VS HeikinAshi", overlay=true, pyramiding=0, calc_on_every_tick=true, calc_on_order_fills=true)

buyEntry =  n1 > n2
sellEntry = close < kamaEntry and n1 < n2

buyExit = close < kamaEntry and n1 < n2
sellExit = n1 > n2
if (buyEntry)
    strategy.entry("KAMAL", strategy.long, comment="KAMAL")
else
    strategy.close("KAMAL", when=buyExit)

if (sellEntry)
    strategy.entry("KAMAS", strategy.short, comment="KAMAS")
else
    strategy.close("KAMAS", when = sellExit)
Detail
https://www.fmz.com/strategy/441140
Last Modified
2024-02-06 09:53:22