Name
基于双均线和FRAMA指标的多空交叉交易策略FRAMA-and-Moving-Average-Crossover-Trading-Strategy-Based-on-Dual-Moving-Average
Author
ChaoZhang
Strategy Description
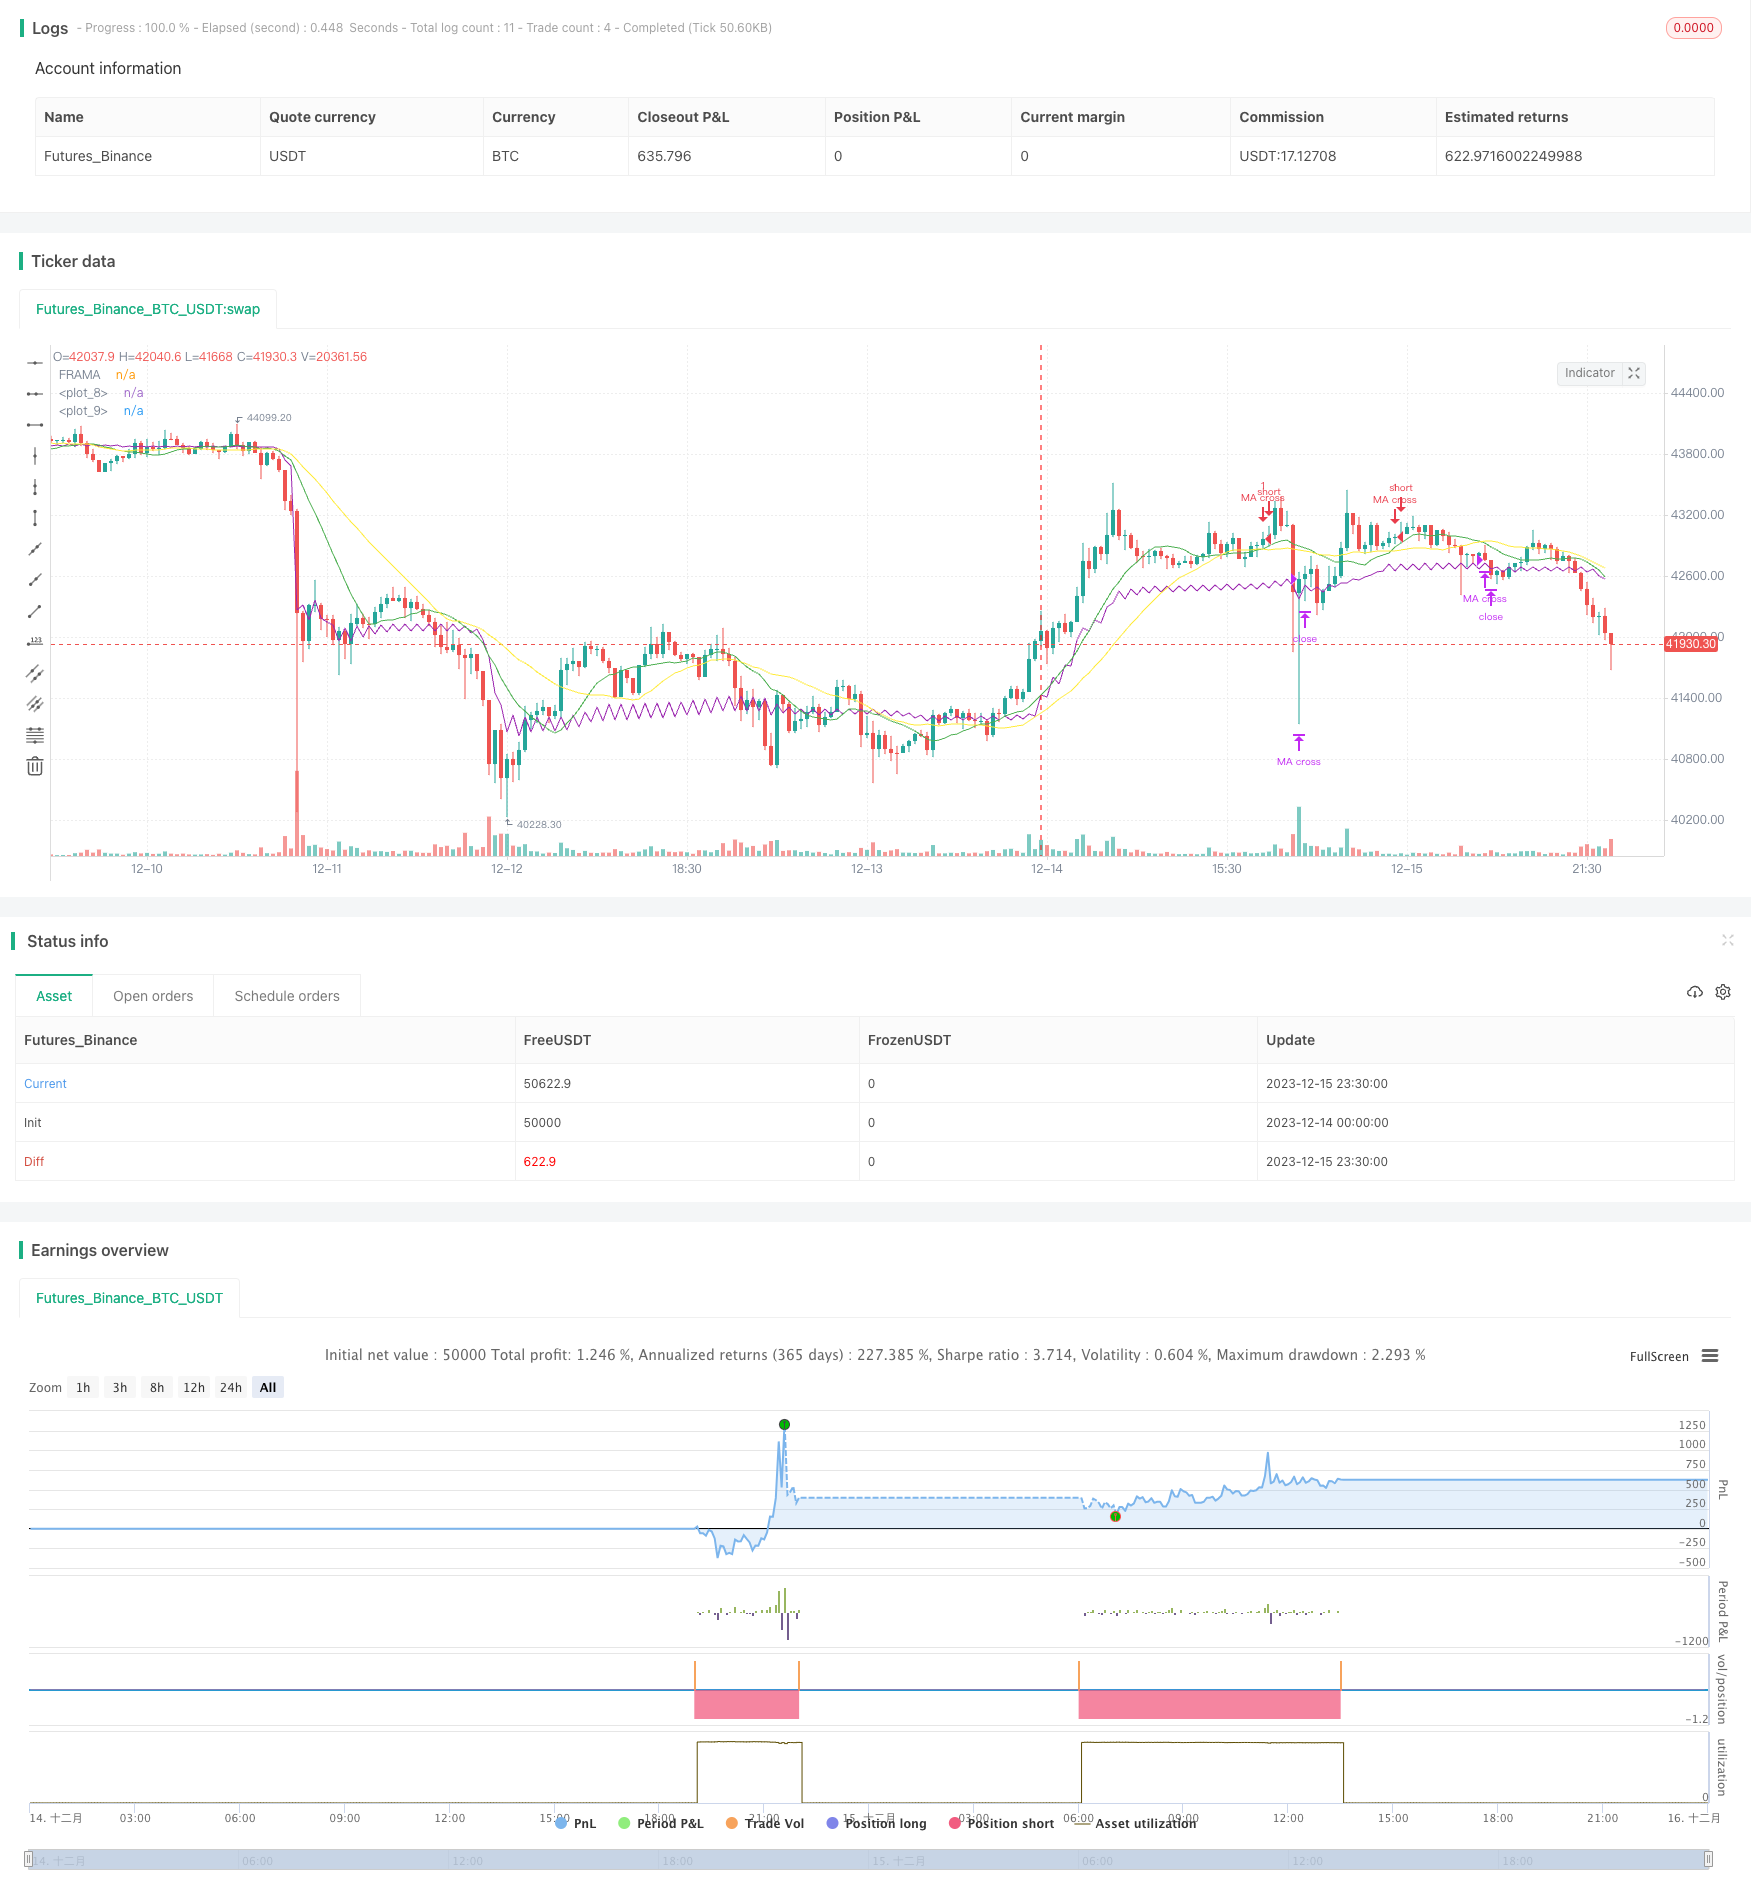
本策略首先计算13周期和26周期的简单移动平均线,然后计算FRAMA指标。当快线从下向上突破慢线时做多,当快线从上向下突破慢线时或者FRAMA指标从上向下突破收盘价时平仓。
该策略主要利用双均线交叉形成交易信号。当短期平均线从下向上突破长期平均线时,表示行情由跌转涨,做多;当短期平均从上向下突破长期平均线时,表示行情即将反转,平仓。
同时,该策略引入FRAMA指标作为辅助判断。FRAMA指标基于分形市场假说改进的自适应移动平均线。它通过计算不同周期内价格波动幅度的对数变化率,实时估计市场的分形维数,从而动态调整平均线的平滑性。当FRAMA指标下穿收盘价时,表明趋势反转信号,配合均线交叉信号,增加判断准确性。
该策略结合双均线交叉和FRAMA指标,可以有效过滤假突破信号,提高交易信号质量。双均线交叉判断主要交易方向,FRAMA辅助判断可以避免在震荡行情中错失反转时点。
相比单一指标和模型,该策略可明显改善信号质量,降低误判概率。同时,结合快慢均线,可以顺势而为,避免被套。
该策略主要风险在于双均线可能产生较多假突破信号,FRAMA指标的参数设置也会影响判断效果。此外,在特定行情下,快线和慢线、FRAMA和收盘价之间可能长时间互不交叉,导致无交易机会。
为控制上述风险,可以适当调整均线周期参数,或结合其他指标进行过滤。此外,FRAMA指标的长度、分形因子等参数也需要针对不同市场合理设置,避免过度平滑或过敏。
该策略可从以下几个方面进行优化:
-
测试更多的均线组合和周期参数,寻找最佳参数对。
-
增加停损策略,控制单笔损失。
-
结合交易量指标,避免低量假突破。
-
增加机器学习模型,实时评估市场状态,动态调整参数。
-
结合情绪指标、消息面等多因子判断市场情绪,提高决策质量。
本策略初步实践双均线交叉策略与FRAMA指标的组合运用。在保持简单直观的基础上,有效提升了信号质量,值得进一步测试优化。随着参数调整、新指标引入等优化,本策略可望成为稳定可靠的量化交易策略。
||
This strategy first calculates the 13-period and 26-period simple moving averages, and then calculates the FRAMA indicator. It goes long when the fast line breaks through the slow line from bottom up, and exits the position when the fast line breaks through the slow line from top down or when the FRAMA indicator breaks through the closing price from top down.
The strategy mainly uses moving average crossover to generate trading signals. When the short-term moving average breaks through the long-term moving average from bottom up, it indicates the trend is turning from decline to rise, and goes long. When the short-term moving average crosses below the long-term one, it indicates an impending reversal, and closes the position.
Meanwhile, the FRAMA indicator is introduced as an auxiliary judgment. The FRAMA indicator is an adaptive moving average line improved based on the fractal market hypothesis. By calculating the logarithmic change rate of price fluctuation amplitude over different periods, it estimated the fractal dimension of the market in real time to dynamically adjust the smoothness of the moving average. When the FRAMA indicator crosses below the closing price, it indicates a trend reversal signal. Combined with the moving average crossover signal, it improves the accuracy of judgment.
The strategy combines dual moving average crossover and FRAMA indicator, which can effectively filter false breakout signals and improve the quality of trading signals. The dual moving average crossover mainly judges the major trading direction, while the auxiliary FRAMA judgment can avoid missing reversal timing in oscillating markets.
Compared with single indicator and model, this strategy can significantly improve signal quality and reduce misjudgment probability. Meanwhile, combining fast and slow moving averages, it can follow the trend to avoid being trapped.
The main risks of this strategy lie in that the dual moving averages may produce more false breakout signals, and the parameter settings of the FRAMA indicator will also affect the effectiveness. In addition, there may be long periods without crossover between fast and slow lines, FRAMA and closing prices in certain market conditions, resulting in no trading opportunities.
To control the above risks, parameters like moving average periods can be adjusted accordingly, or filtered with other indicators. Besides, parameters of the FRAMA indicator including length, fractal factor also need to be set appropriately according to different markets, to avoid over-smoothing or over-sensitivity.
The strategy can be optimized in the following aspects:
-
Test more combinations and periods of moving averages to find the optimal parameter pair.
-
Add stop loss strategy to control single loss.
-
Combine trading volume indicators to avoid false breakout under low volume.
-
Add machine learning models to evaluate market status in real time and dynamically adjust parameters.
-
Combine sentiment indicators, news and other multi-factors to improve decision quality.
This preliminary strategy combines the application of dual moving average crossover and FRAMA indicator. On the basis of keeping simplicity and intuition, it has effectively improved the signal quality and is worth further testing and optimization. With optimizations like parameter tuning, new indicator introduction, this strategy can be expected to become a stable and reliable trading strategy.
[/trans]
Strategy Arguments
| Argument | Default | Description |
|---|---|---|
| v_input_1_hl2 | 0 | price: hl2 |
| v_input_2 | 16 | len |
| v_input_3 | true | FC |
| v_input_4 | 198 | SC |
Source (PineScript)
/*backtest
start: 2023-12-14 00:00:00
end: 2023-12-16 00:00:00
period: 30m
basePeriod: 15m
exchanges: [{"eid":"Futures_Binance","currency":"BTC_USDT"}]
*/

//@version=2
strategy("Fractal Adaptive Moving Average",shorttitle="FRAMA",overlay=true)


ma_fast = sma(close,13)

ma_slow = sma(close,26)
plot(ma_fast,color = green)
plot(ma_slow, color = yellow)
price = input(hl2)
len = input(defval=16,minval=1)
FC = input(defval=1,minval=1)
SC = input(defval=198,minval=1)
len1 = len/2
w = log(2/(SC+1))
H1 = highest(high,len1)
L1 = lowest(low,len1)
N1 = (H1-L1)/len1
H2 = highest(high,len)[len1]
L2 = lowest(low,len)[len1]
N2 = (H2-L2)/len1
H3 = highest(high,len)
L3 = lowest(low,len)
N3 = (H3-L3)/len
dimen1 = (log(N1+N2)-log(N3))/log(2)
dimen = iff(N1>0 and N2>0 and N3>0,dimen1,nz(dimen1[1]))
alpha1 = exp(w*(dimen-1))
oldalpha = alpha1>1?1:(alpha1<0.01?0.01:alpha1)
oldN = (2-oldalpha)/oldalpha
N = (((SC-FC)*(oldN-1))/(SC-1))+FC
alpha_ = 2/(N+1)
alpha = alpha_<2/(SC+1)?2/(SC+1):(alpha_>1?1:alpha_)
out = (1-alpha)*nz(out[1]) + alpha*price
plot(out,title="FRAMA",color=purple,transp=0)
entry() => crossover(ma_fast, ma_slow) and (out < close)
exit() => crossover(ma_slow, ma_fast) or crossunder(out, close)

strategy.entry(id= "MA cross", long = true, when = entry())
strategy.close(id= "MA cross", when = exit())
Detail
https://www.fmz.com/strategy/436261
Last Modified
2023-12-22 16:08:23