Name
基于双均线跟随策略Dual-Moving-Average-Following-Strategy
Author
ChaoZhang
Strategy Description
双均线跟随策略是一种基于移动平均线的趋势跟随策略。它通过计算不同周期的移动平均线,判断行情趋势方向,以发出交易信号。当短期移动平均线上穿长期移动平均线时,做多;当短期移动平均线下穿长期移动平均线时,做空。该策略顺应趋势运行,以获利。
双均线跟随策略通过计算14周期和28周期的简单移动平均线(SMA)判断趋势方向。具体来说,它在每个周期末计算close价格的14周期SMA和28周期SMA。当14周期SMA上穿28周期SMA时,发出做多信号并打开长仓;当14周期SMA下穿28周期SMA时,发出做空信号并打开短仓。
进入仓位后,它会通过设置止盈和止损来控制风险。止盈和止损的点数通过输入的参数转换为价格。此外,它还在图表上绘制了止盈线、止损线和入场均价的参考线,便于直观判断仓位利润和风险。
双均线跟随策略具有以下优势:
- 操作简单,容易实现。
- 顺应趋势运行,回撤概率较小。
- 可以通过调整周期参数控制交易频率。
- 可以灵活设置止盈止损点数控制风险。
双均线跟随策略也存在一些风险:
- 当突发事件打断市场趋势时,可能出现较大亏损。
- 如果止损点设置太小,可能会过早止损。
- 如果止损点设置太大,可能会扩大亏损范围。
- 交易频率可能过高或过低,影响资金效率。
为控制上述风险,可以从以下方面进行优化:
- 结合波动率指标判断止损点。
- 优化移动平均线的周期参数。
- 增加趋势滤波器,避免趋势末期的假信号。
双均线跟随策略可以从以下几个方面进行优化:
-
增加波动率指标,动态调整止损点。例如结合ATR指标,当市场波动加大时扩大止损点,避免过早止损。
-
优化移动平均线周期参数。可以测试更多组合,选择产生交易信号次数更合适的周期。
-
添加趋势滤波器。例如增设MACD、DMI等指标,避免在趋势末期出现的假信号,减少不必要的交易。
-
增加机器学习模型。使用LSTM、GRU等深度学习模型预测价格趋势,替代传统均线法则,可能获得更好的效果。
-
多品种交易。将策略套用到更多品种,利用非相关性降低整体回撤。
双均线跟随策略整体来说是一个简单实用的趋势策略。它顺应趋势而动,回撤风险较小,容易实现。我们可以通过调整周期参数、设置止损止盈、增加趋势判断指标等方式优化该策略,使其能够适应更多市场环境,获得更稳定的投资回报。
||
The dual moving average following strategy is a trend following strategy based on moving averages. It determines the trend direction by calculating moving averages of different periods and generates trading signals accordingly. It goes long when the short-term moving average crosses over the long-term one, and goes short when the short-term moving average crosses below the long-term one. The strategy follows the trend to profit.
The dual moving average following strategy judges the trend direction by calculating the 14-period and 28-period simple moving averages (SMA) of the closing price. Specifically, it calculates the 14-period SMA and 28-period SMA of close price at the end of each period. When the 14-period SMA crosses over the 28-period SMA, it sends out a long signal and opens a long position. When the 14-period SMA crosses below the 28-period SMA, it sends out a short signal and opens a short position.
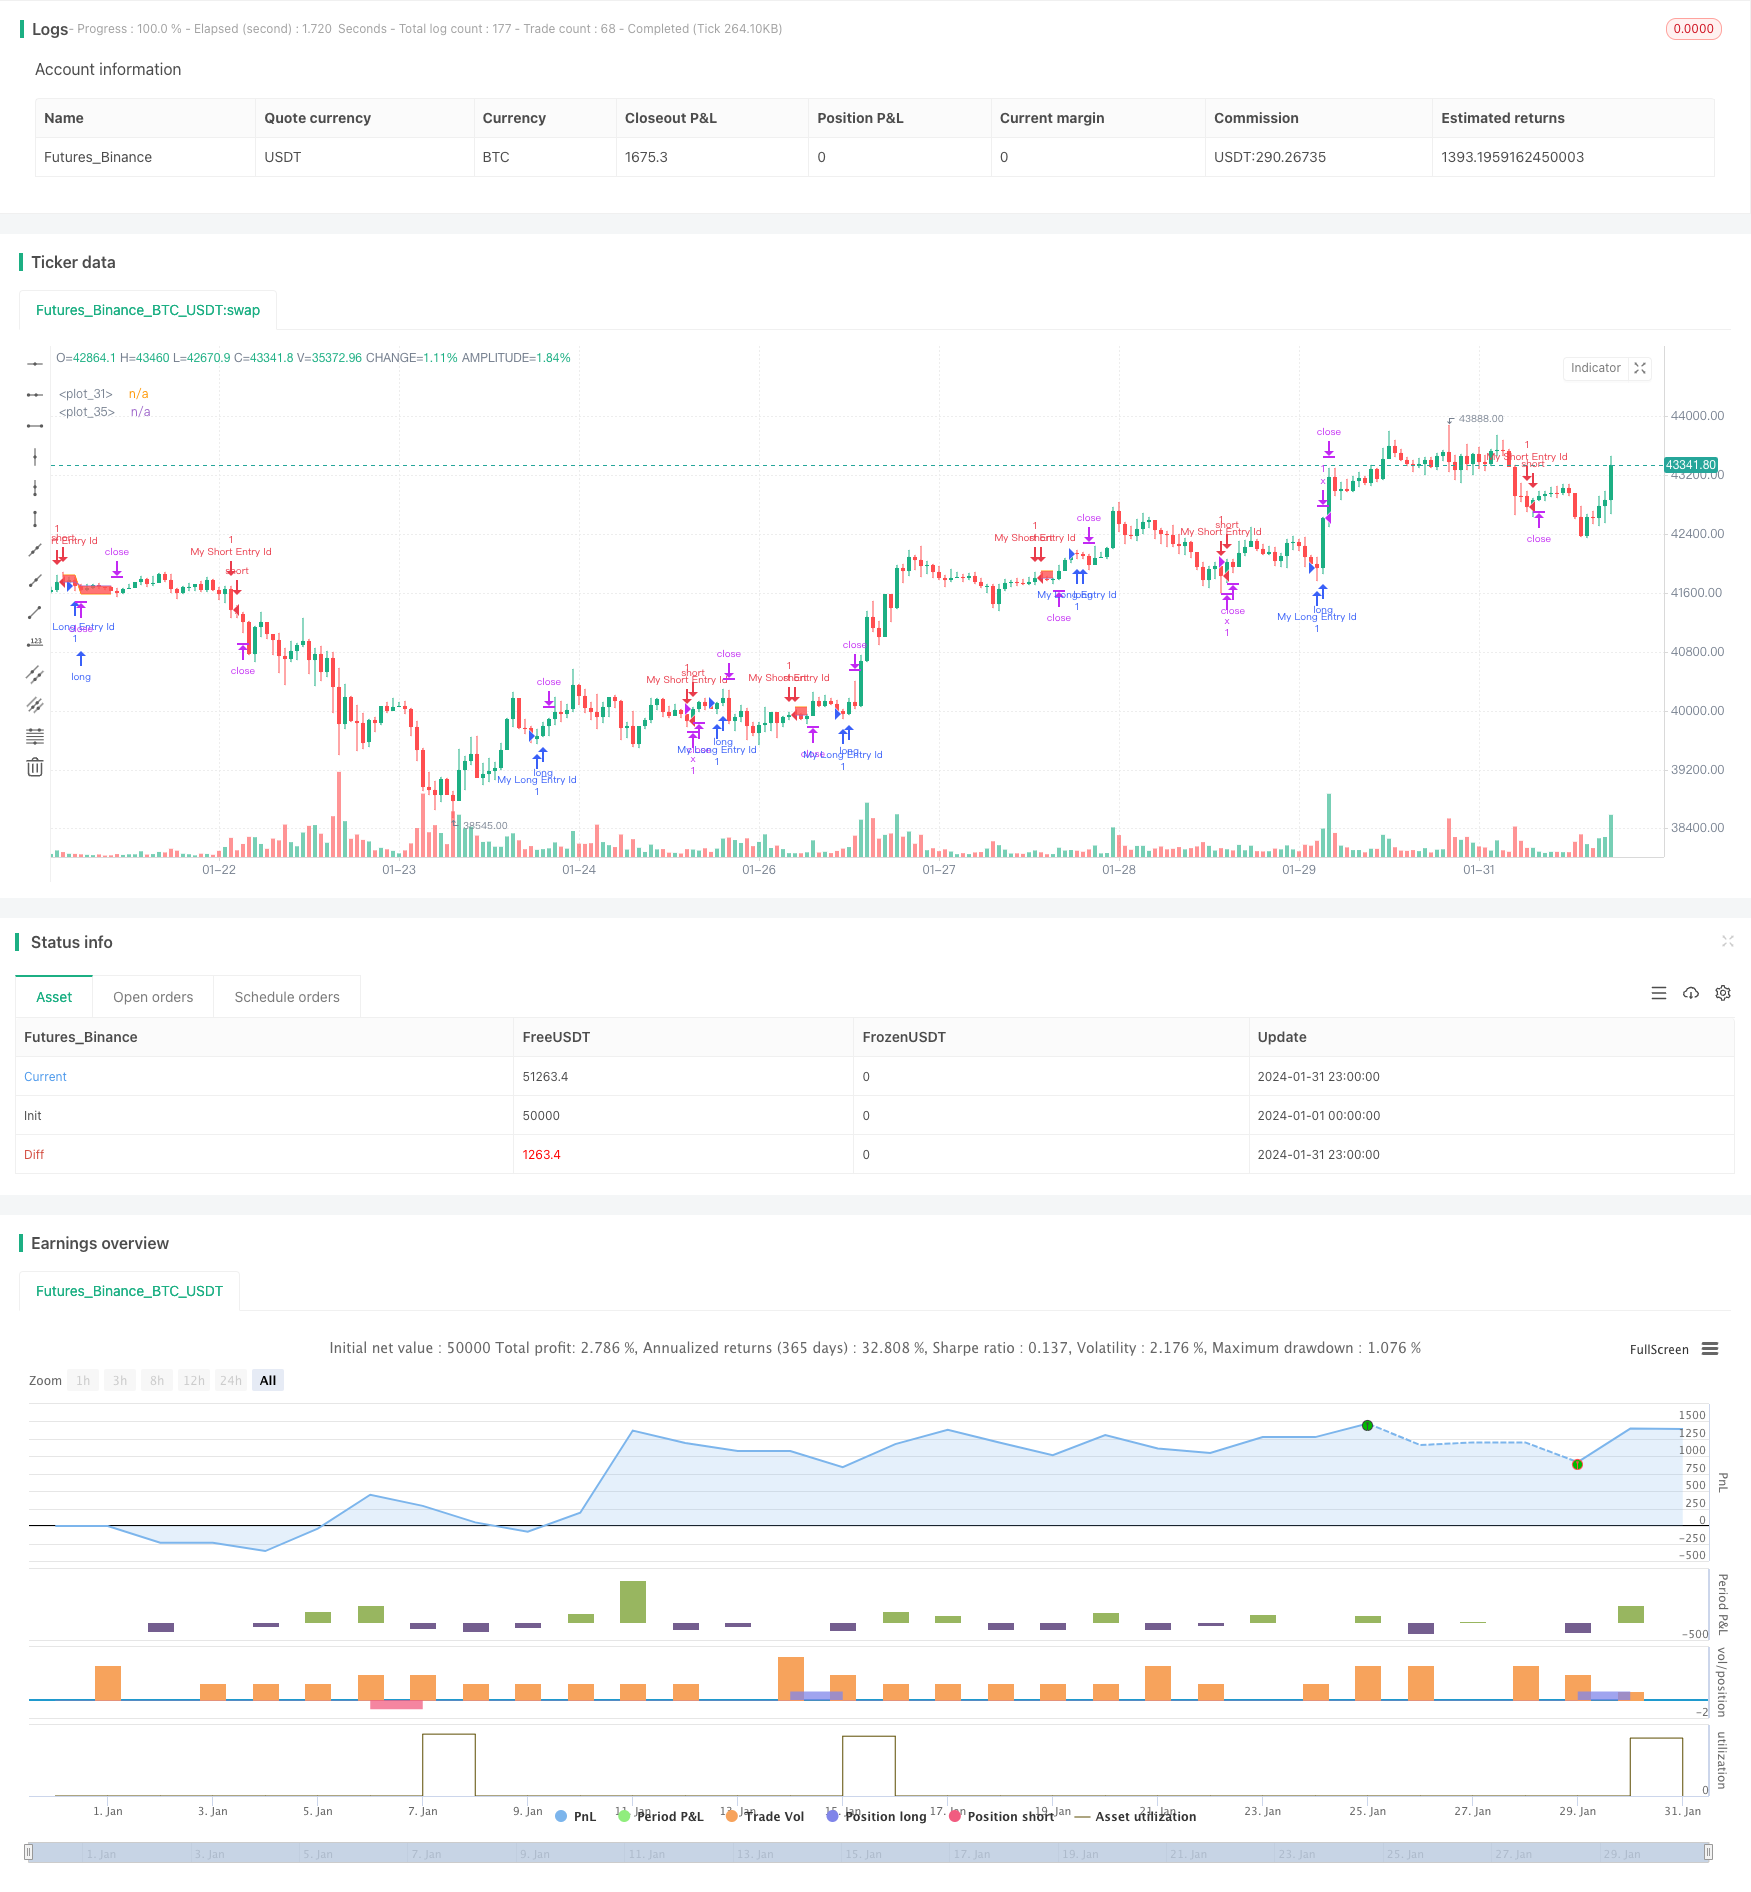
After entering positions, it manages risks by setting take profit and stop loss levels. The take profit and stop loss points are converted to prices based on the input parameters. It also plots the take profit line, stop loss line and entry average price line on the chart for visual judgment of profit and risk.
The dual moving average following strategy has the following advantages:
- Simple to implement and operate.
- Follows the trend with lower drawdown risks.
- Trading frequency can be controlled by adjusting the cycle parameters.
- Flexible take profit and stop loss settings to control risks.
The dual moving average following strategy also has some risks:
- Significant loss may occur if sudden events interrupt the market trend.
- Premature stop loss may happen if the stop loss point is set too small.
- Loss range could be enlarged if the stop loss point is set too big.
- Trading frequency may be too high or too low, impacting capital efficiency.
The risks can be managed from the following aspects:
- Set stop loss point dynamically based on volatility.
- Optimize the moving average cycle parameters.
- Add trend filter to avoid false signals near trend turning points.
The dual moving average following strategy can be optimized in the following ways:
-
Add volatility indicators for dynamic stop loss point. For example, combine with ATR to expand stop loss when volatility rises to avoid premature exit.
-
Optimize moving average cycle parameters by testing more combinations and selecting proper periods with suitable frequency of trading signals.
-
Add trend filter indicator, such as MACD, DMI to avoid false signals near trend turning points, reducing unnecessary trades.
-
Increase machine learning models to predict price trend and replace traditional rules. LSTM, GRU deep learning models may generate better results.
-
Diversify trading varieties utilizing low correlation to reduce overall drawdown.
In conclusion, the dual moving average following strategy is a simple and practical trend following system. It moves along the trend thus having lower drawdown risks, and is easy to implement. We can optimize it by adjusting cycle parameters, setting stop loss and take profit, adding trend judging indicators, to adapt to more market environments and earn more steady returns.
[/trans]
Strategy Arguments
| Argument | Default | Description |
|---|---|---|
| v_input_1 | 200 | Take Profit $$ |
| v_input_2 | 100 | Stop Loss $$ |
Source (PineScript)
/*backtest
start: 2024-01-01 00:00:00
end: 2024-01-31 23:59:59
period: 1h
basePeriod: 15m
exchanges: [{"eid":"Futures_Binance","currency":"BTC_USDT"}]
*/

// This Pine Script™ code is subject to the terms of the Mozilla Public License 2.0 at https://mozilla.org/MPL/2.0/
// © coinilandBot
// This source code is subject to the terms of the Mozilla Public License 2.0 at https://mozilla.org/MPL/2.0/
// © adolgov

// @description
//

//@version=4
strategy("coiniland  copy trading platform", overlay=true)

// random entry condition

longCondition = crossover(sma(close, 14), sma(close, 28))
if (longCondition)
    strategy.entry("My Long Entry Id", strategy.long)

shortCondition = crossunder(sma(close, 14), sma(close, 28))
if (shortCondition)
    strategy.entry("My Short Entry Id", strategy.short)

moneyToSLPoints(money) =>
    strategy.position_size !=0 ? (money / syminfo.pointvalue / abs(strategy.position_size)) / syminfo.mintick : na

p = moneyToSLPoints(input(200, title = "Take Profit $$"))
l = moneyToSLPoints(input(100, title = "Stop Loss $$"))
strategy.exit("x", profit = p, loss = l)

// debug plots for visualize SL & TP levels
pointsToPrice(pp) =>
    na(pp) ? na : strategy.position_avg_price + pp * sign(strategy.position_size) * syminfo.mintick

pp = plot(pointsToPrice(p), style = plot.style_linebr )
lp = plot(pointsToPrice(-l), style = plot.style_linebr )
avg = plot( strategy.position_avg_price, style = plot.style_linebr )
fill(pp, avg, color = color.green)
fill(avg, lp, color = color.red)
Detail
https://www.fmz.com/strategy/442933
Last Modified
2024-02-27 14:49:58