Name
基于唐奇安通道指标开发的量化交易策略Donchian-Channel-Width-Trading-Strategy
Author
ChaoZhang
Strategy Description
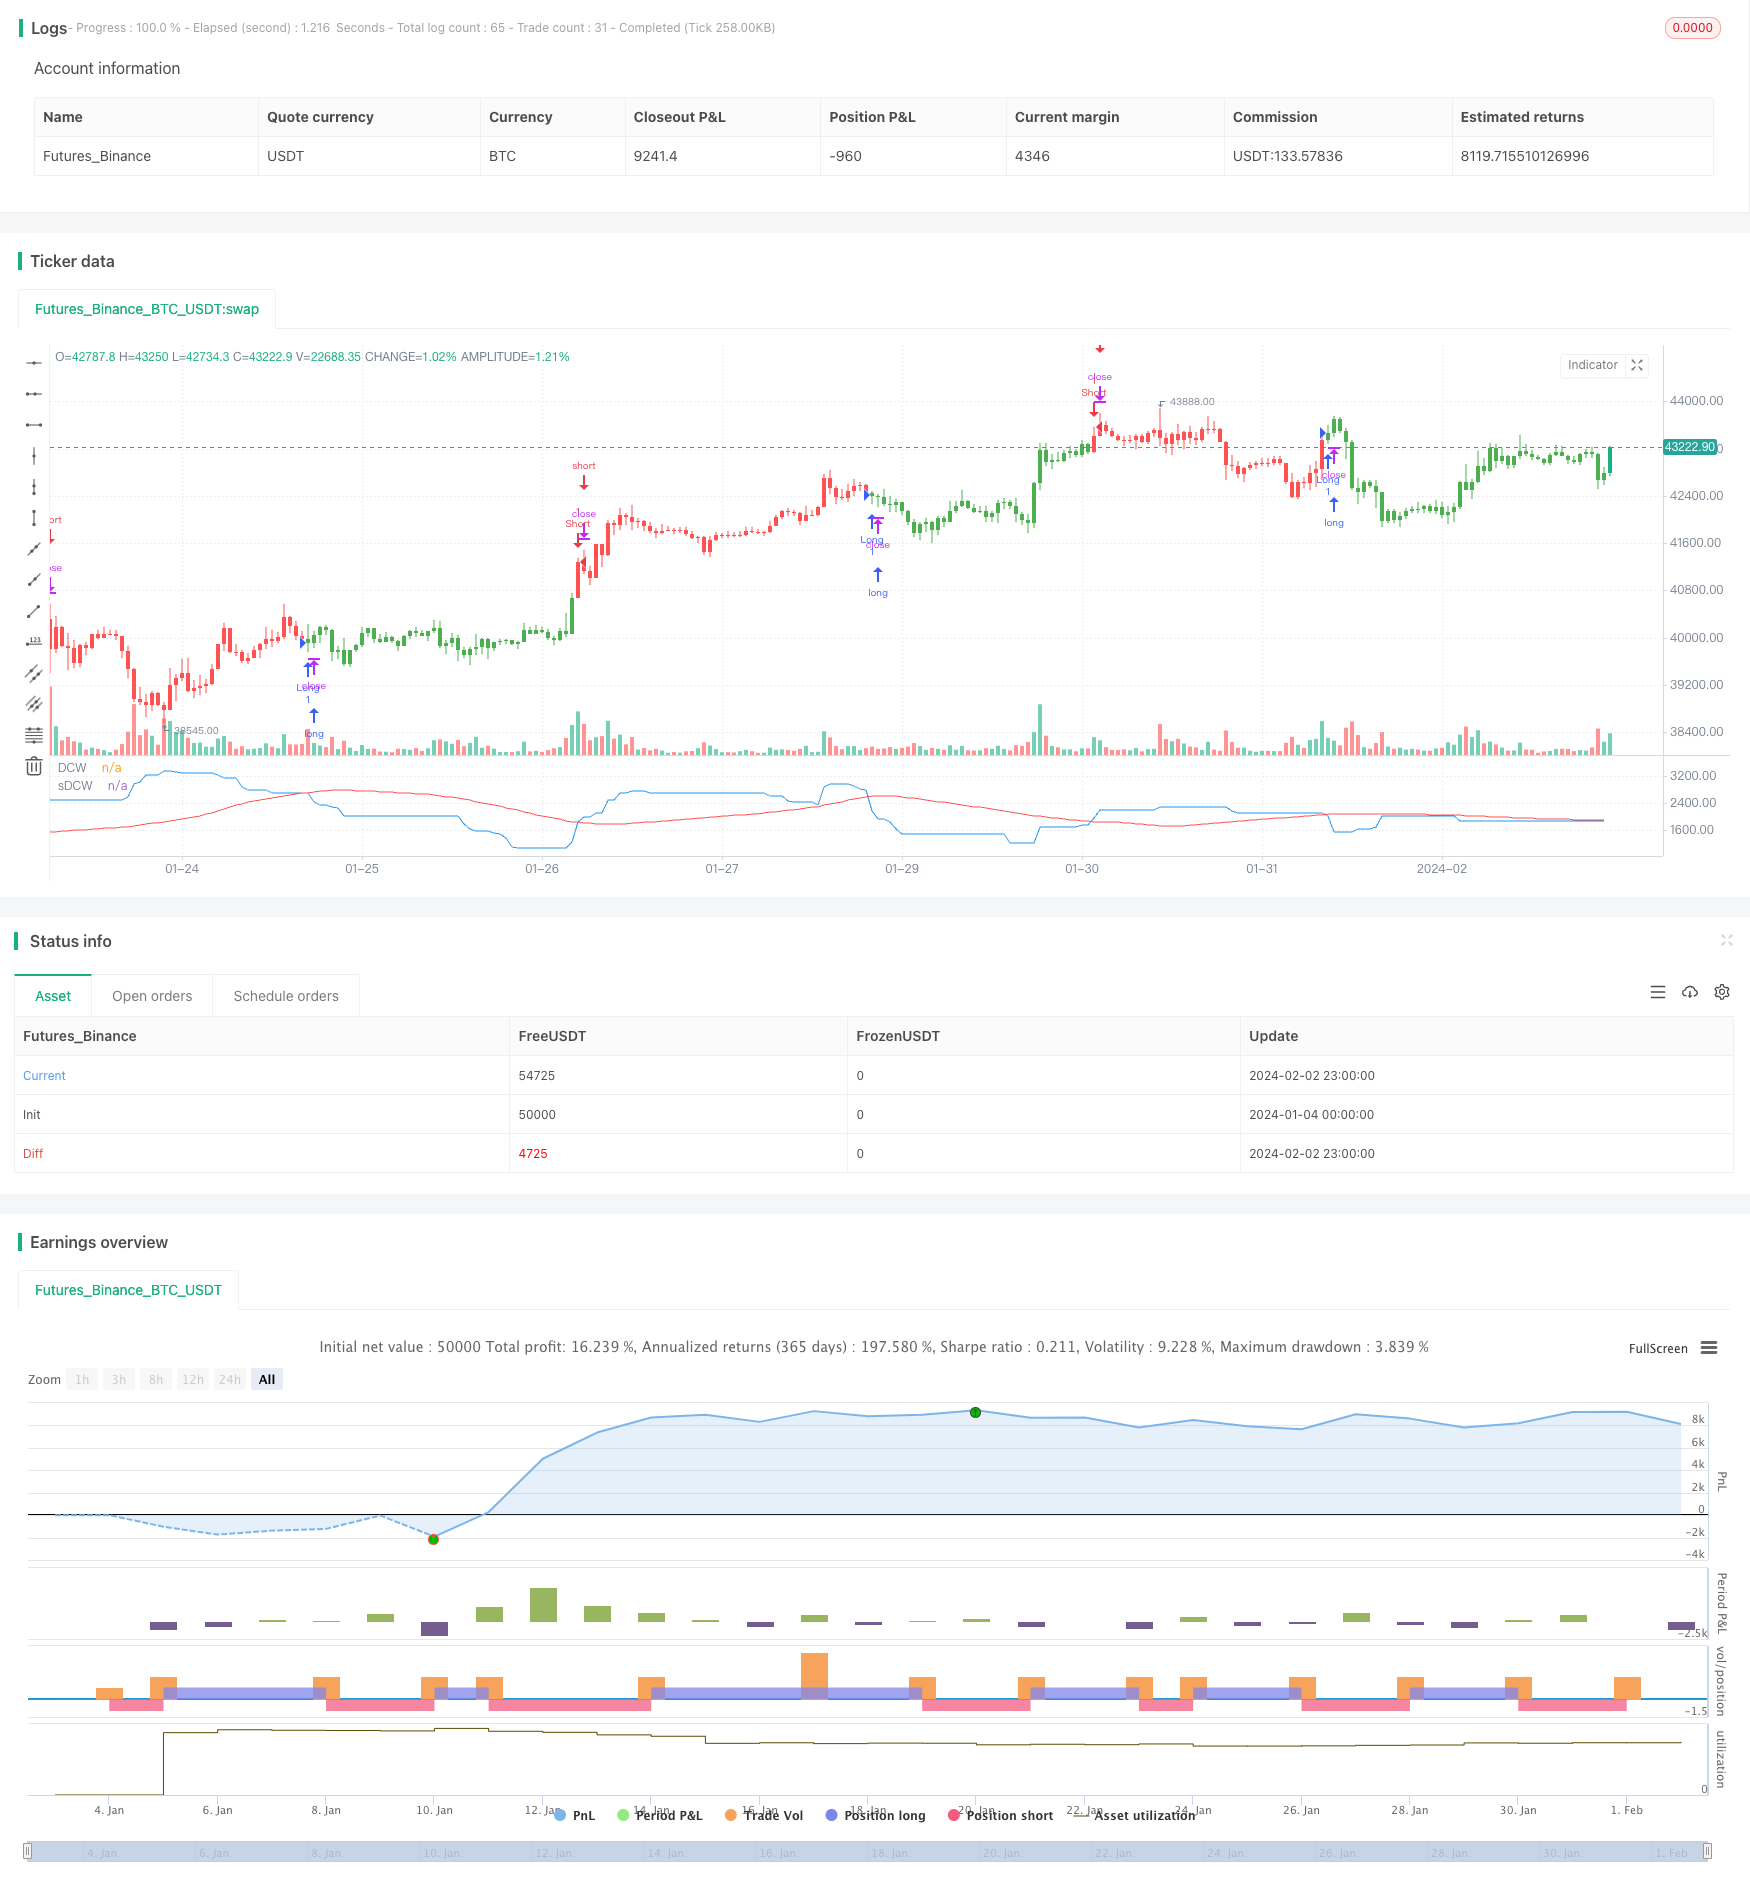
唐奇安通道宽度交易策略是基于唐奇安通道指标开发的量化交易策略。该策略通过计算一定周期内的最高价和最低价之间的差值,也就是唐奇安通道的宽度,来判断市场的波动程度和风险水平。当唐奇安通道宽度大于其平滑移动平均线时,表示市场波动加大,进入高风险状态;当小于时,表示市场波动减小,进入低风险状态。通过这样的判断,可明确市场趋势和操作方向。
该策略的核心指标是唐奇安通道宽度。唐奇安通道宽度的计算公式如下:
唐奇安通道宽度 = 最高价 - 最低价
其中,最高价和最低价是在一定周期n内计算得出。该周期通过length参数设置。
为了平滑唐奇安通道宽度数据,策略中又引入了平滑移动平均线指标SMA。该指标对唐奇安通道宽度进行了二次计算,以减少误差。
在判断市场风险水平时,如果唐奇安通道宽度大于其平滑移动平均线,则表示市场正进入高波动、高风险状态;如果小于,则表示市场波动减弱,进入低风险状态。
根据风险水平的判断,策略会相应的做出交易决策:高风险时做空,低风险时做多。
该策略最大的优势在于通过波动性判断市场风险,做出相应的交易决策。这样可以有效防止在高风险市场继续做多,或在低风险市场时仍然做空,减少不必要的损失。
另外,该策略结合了唐奇安通道宽度和其平滑移动平均线,判断信号更加可靠,避免因数据波动带来的错误交易。
总的来说,该策略能够在一定程度上判断市场风险,做出相对稳定的交易决策。这是其最大的优势。
该策略的主要风险在于唐奇安通道宽度未必总是能准确反映市场风险。当宽度和平均线产生背离时,就可能带来错误的信号。这时如果仍机械交易,会产生较大损失。
此外,交易参数的设置也会对策略收益产生较大影响。如果参数设置不当,同样会增加损失的可能。
最后,剧烈波动的市场条件下,唐奇安通道宽度指标的效果也会打折扣,策略信号产生滞后。这时需要人工干预,暂停策略,避免无谓损失。
该策略可从以下几个方面进行优化:
-
唐奇安通道宽度指标优化。可以测试不同周期的参数,找到最佳参数组合。
-
增加其他副指标确认。比如波动率、成交量等指标结合使用,可提高信号准确率。
-
增加止损策略。合理止损可以大幅减少单笔损失大小,对总体收益提升显著。
-
参数自适应优化。使交易参数能够根据实时市场变化进行调整,更好地适应市场。
-
算法交易优化。引入机器学习等算法交易技术,使策略更具有智能性和前瞻性。
唐奇安通道宽度交易策略通过判断市场波动性和风险水平,做出相应的交易决策。该策略最大优势是有效控制风险,避免在高风险市场追单。策略可从多个维度进行优化,最终达到稳定获利。
||
The Donchian Channel Width trading strategy is a quantitative trading strategy developed based on the Donchian Channel indicator. This strategy calculates the difference between the highest price and the lowest price over a certain period, which is the width of the Donchian Channel, to judge the degree of market fluctuation and risk level. When the Donchian Channel width is greater than its smooth moving average, it indicates that market volatility has increased and is in a high-risk state. When it is smaller, it indicates that market volatility has decreased and is in a low-risk state. By making such judgments, the market trend and direction of operation can be clearly defined.
The core indicator of this strategy is the Donchian Channel width. The calculation formula of the Donchian Channel width is as follows:
Donchian Channel Width = Highest Price - Lowest Price
Where the highest price and the lowest price are calculated over a certain period n. This period is set through the length parameter.
In order to smooth the Donchian Channel width data, the strategy also introduces the smooth moving average (SMA) indicator. This indicator performs secondary calculation on the Donchian Channel width to reduce errors.
When judging the market risk level, if the Donchian Channel width is greater than its smooth moving average, it means that the market is entering a high volatility and high risk state. If it is smaller, it means that market volatility has weakened and is in a low risk state.
According to the judgment of the risk level, the strategy will make corresponding trading decisions: go short in high risk, and go long in low risk.
The biggest advantage of this strategy is that it makes corresponding trading decisions by judging market risk through volatility. This can effectively prevent continuing to go long in a high-risk market, or still going short in a low-risk market, reducing unnecessary losses.
In addition, the strategy combines the Donchian Channel width and its smooth moving average to make the signal judgment more reliable and avoid erroneous transactions caused by data fluctuations.
In general, this strategy can judge market risk to a certain extent and make relatively stable trading decisions. This is its greatest advantage.
The main risk of this strategy is that the Donchian Channel width may not always accurately reflect market risk. When there is a divergence between the width and the average line, it may lead to wrong signals. Still trading mechanically at this time will lead to greater losses.
In addition, the setting of trading parameters will also have a significant impact on strategy returns. If the parameters are set improperly, it will also increase the possibility of loss.
Finally, under the condition of violent market fluctuations, the effect of the Donchian Channel width indicator will also be discounted, and the strategy signal will lag. Manual intervention is required at this time to suspend the strategy and avoid unnecessary losses.
This strategy can be optimized in the following aspects:
-
Optimize the Donchian Channel width indicator. Different cycle parameters can be tested to find the best parameter combination.
-
Increase other secondary indicators for confirmation. For example, the use of indicators such as volatility and volume can improve the accuracy of signals.
-
Increase stop loss strategy. Reasonable stop loss can greatly reduce the size of single loss and significantly improve overall returns.
-
Parameter self-adaptive optimization. Enable trading parameters to adjust dynamically according to real-time market changes to better adapt to the market.
-
Algorithm trading optimization. Introduce algorithmic trading techniques such as machine learning to make strategies more intelligent and forward-looking.
The Donchian Channel width trading strategy makes corresponding trading decisions by judging the volatility and risk level of the market. The biggest advantage of this strategy is that it effectively controls risks and avoids chasing orders in high-risk markets. The strategy can be optimized in multiple dimensions to eventually achieve stable profits.
[/trans]
Strategy Arguments
| Argument | Default | Description |
|---|---|---|
| v_input_1 | 50 | length |
| v_input_2 | 50 | smoothe |
| v_input_3 | false | Trade reverse |
Source (PineScript)
/*backtest
start: 2024-01-04 00:00:00
end: 2024-02-03 00:00:00
period: 1h
basePeriod: 15m
exchanges: [{"eid":"Futures_Binance","currency":"BTC_USDT"}]
*/

//@version=2
////////////////////////////////////////////////////////////
//  Copyright by HPotter v1.0 12/02/2018
// The Donchian Channel was developed by Richard Donchian and it could be compared
// to the Bollinger Bands. When it comes to volatility analysis, the Donchian Channel
// Width was created in the same way as the Bollinger Bandwidth technical indicator was.
//
// As was mentioned above the Donchian Channel Width is used in technical analysis to measure
// volatility. Volatility is one of the most important parameters in technical analysis.
// A price trend is not just about a price change. It is also about volume traded during this
// price change and volatility of a this price change. When a technical analyst focuses his/her
// attention solely on price analysis by ignoring volume and volatility, he/she only sees a part
// of a complete picture only. This could lead to a situation when a trader may miss something and
// lose money. Lets take a look at a simple example how volatility may help a trader:
//
//    Most of the price based technical indicators are lagging indicators.
//    When price moves on low volatility, it takes time for a price trend to change its direction and
// it could be ok to have some lag in an indicator.
//    When price moves on high volatility, a price trend changes its direction faster and stronger.
// An indicator's lag acceptable under low volatility could be financially suicidal now - Buy/Sell signals could be generated when it is already too late.
//
// Another use of volatility - very popular one - it is to adapt a stop loss strategy to it:
//    Smaller stop-loss recommended in low volatility periods. If it is not done, a stop-loss could
// be generated when it is too late.
//    Bigger stop-loss recommended in high volatility periods. If it is not done, a stop-loss could
// be triggered too often and you may miss good trades.
//
//You can change long to short in the Input Settings
//WARNING:
//- For purpose educate only
//- This script to change bars colors.
////////////////////////////////////////////////////////////
strategy(title="Donchian Channel Width Strategy")
length = input(50, minval=1)
smoothe = input(50, minval=1)
reverse = input(false, title="Trade reverse")
xUpper = highest(high, length)
xLower = lowest(low, length)
xDonchianWidth = xUpper - xLower
xSmoothed = sma(xDonchianWidth, smoothe)
pos = iff(xDonchianWidth > xSmoothed, -1,
       iff(xDonchianWidth < xSmoothed, 1, nz(pos[1], 0)))
possig = iff(reverse and pos == 1, -1,
          iff(reverse and pos == -1, 1, pos))
if (possig == 1)
    strategy.entry("Long", strategy.long)
if (possig == -1)
    strategy.entry("Short", strategy.short)
barcolor(possig == -1 ? red: possig == 1 ? green : blue )
plot(xDonchianWidth, color=blue, title="DCW")
plot(xSmoothed, color=red, title="sDCW")
Detail
https://www.fmz.com/strategy/440955
Last Modified
2024-02-04 10:35:11