Name
基于均线交叉的趋势跟随策略Trend-Following-Strategy-Based-on-Moving-Average-Crossover
Author
ChaoZhang
Strategy Description
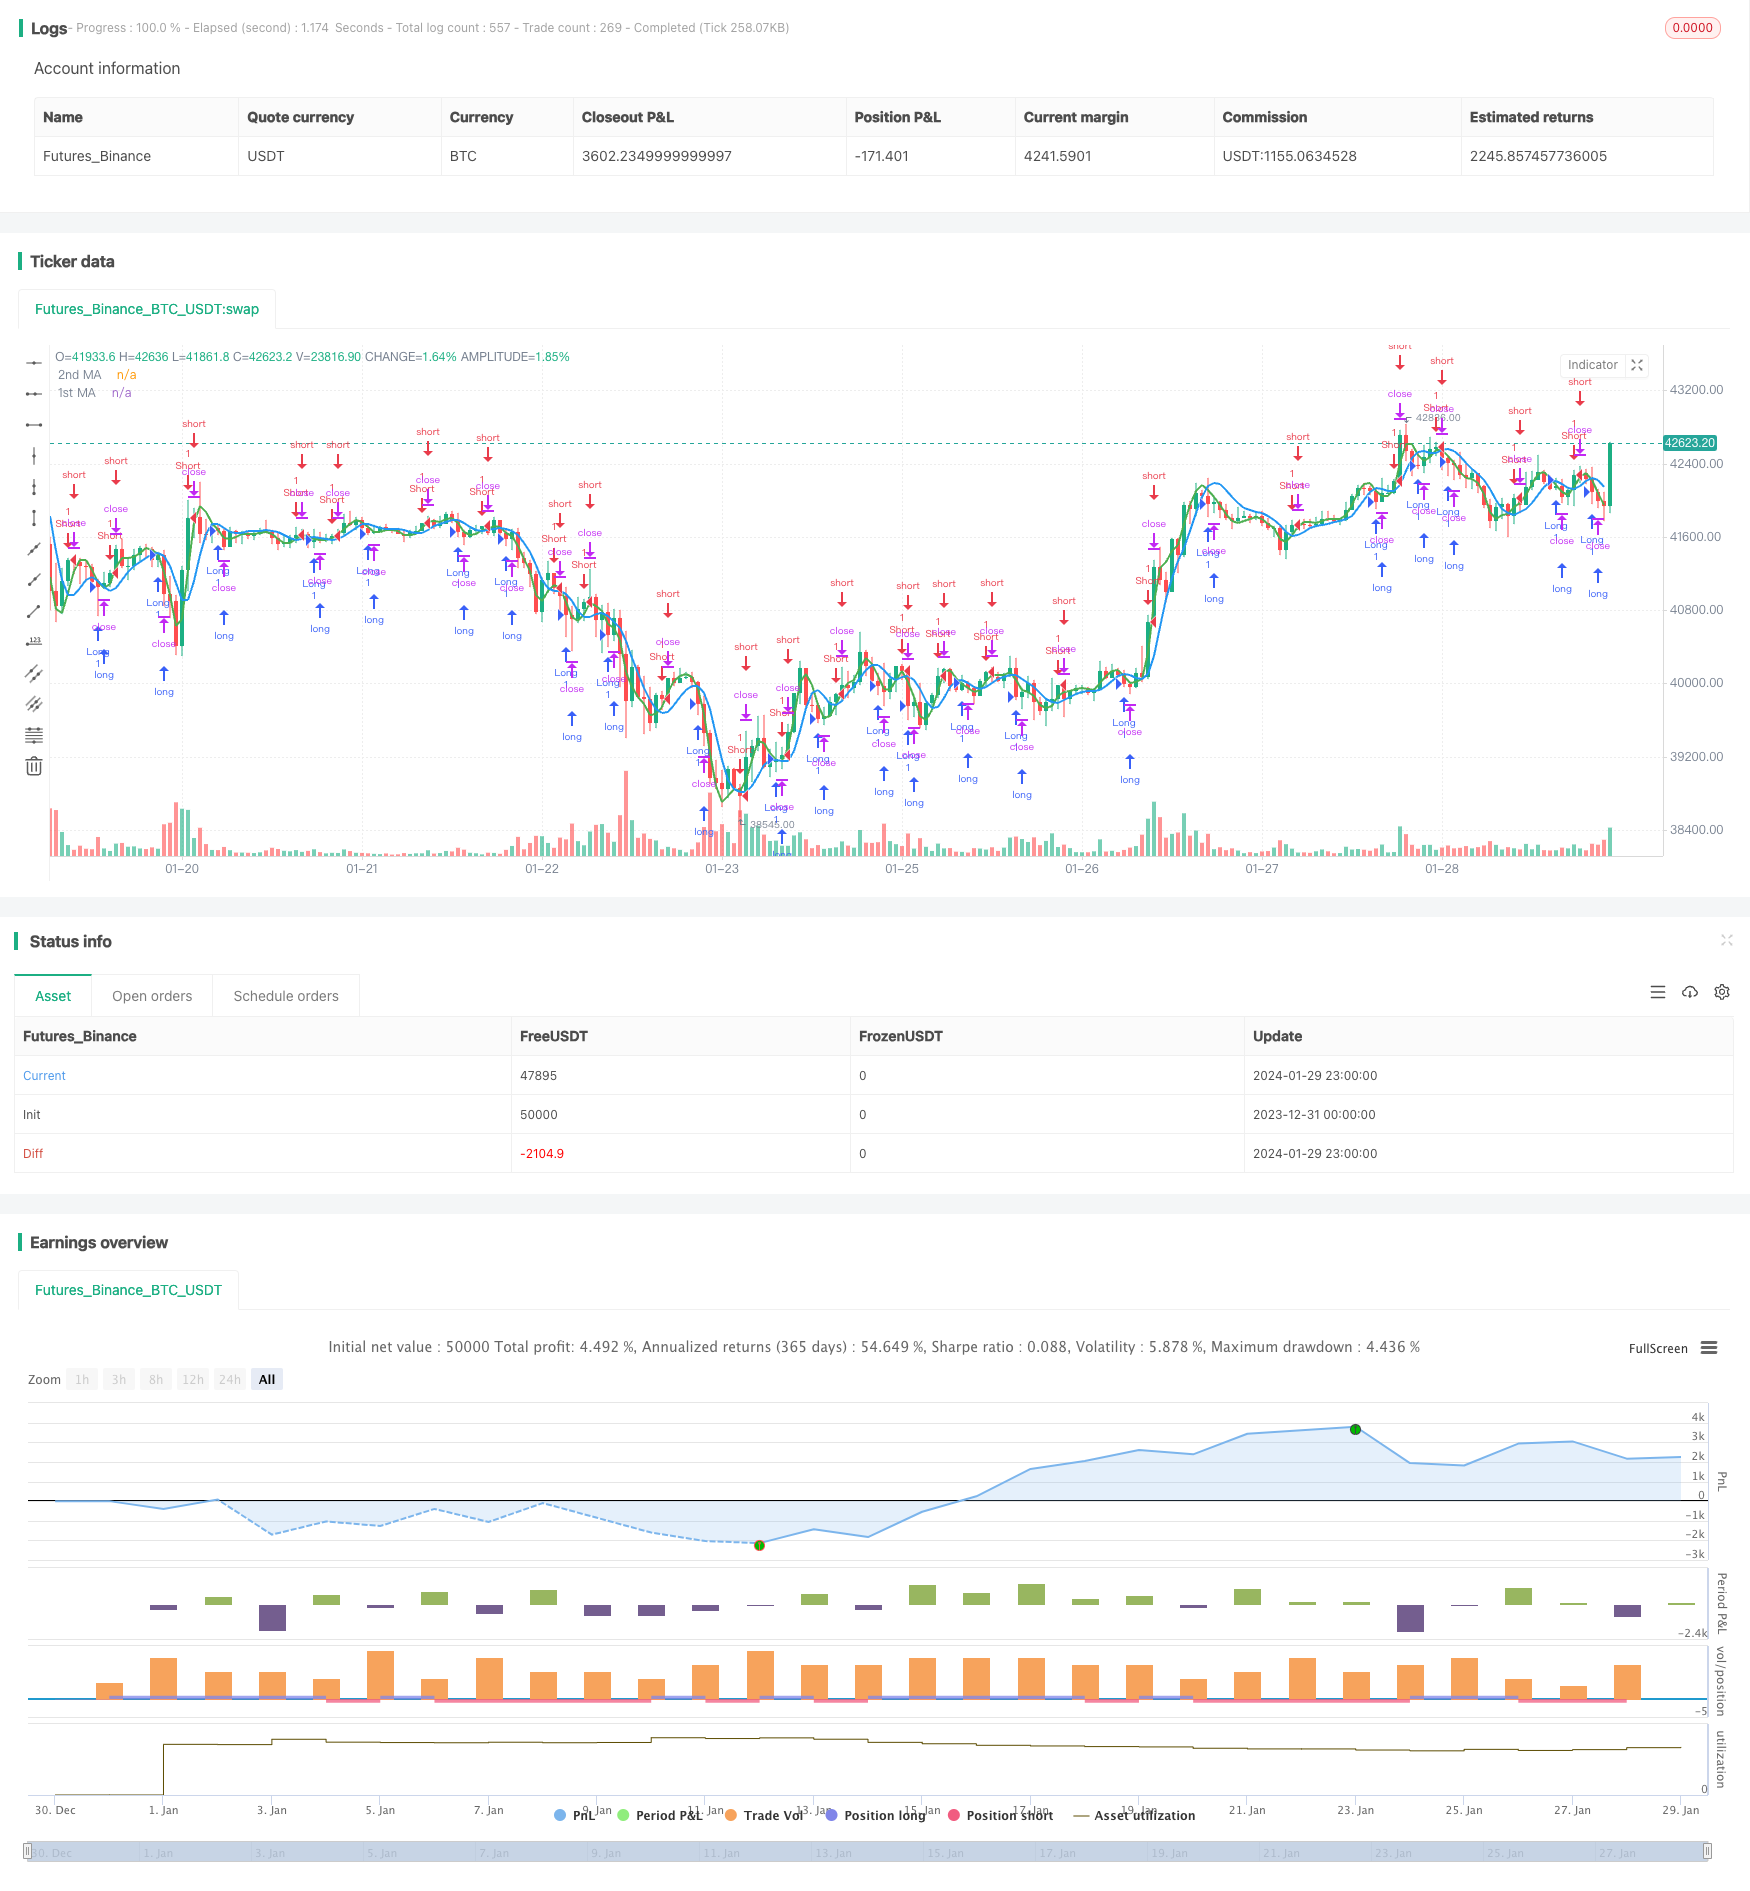
本策略通过计算不同类型的均线(简单移动平均线SMA、指数移动平均线EMA、Hull移动平均线HMA和量加权移动平均线VWMA)并寻找其交叉点,来判断行情趋势并进行趋势跟随。当较短期均线从下方上穿较长期均线时生成买入信号;当较短期均线从上方下穿较长期均线时生成卖出信号。
本策略主要通过比较两条不同均线之间的关系来判断行情走势。具体来说,通过输入参数设置两条均线的类型和长度。其中第一条均线长度较长,代表了长期趋势;第二条均线长度较短,代表了当前短期趋势。
当短期均线从下方穿过长期均线时,代表短期趋势变强,行情进入上涨趋势,因此在这个交叉点发出买入信号。反之,当短期均线从上方穿过长期均线时,代表短期趋势变弱,行情进入下跌趋势,因此在这个交叉点发出卖出信号。
通过这样的均线交叉判断来跟随市场趋势进行交易。
- 利用均线交叉判断主要趋势,是一种经典且实用的技术指标
- 支持多种不同类型的均线组合,灵活性高
- 策略逻辑简单清晰,容易理解实现,适合量化交易的自动化
- 可配置参数灵活,适用于不同市场环境
- 均线具有滞后性,交叉信号发出时,价格运动可能已经发生或者接近反转点,存在一定的滞后误报风险
- 趋势判断可能发生误判,从而导致不必要的亏损
- 需要合理配置均线参数,不同的参数可能导致结果差异很大
风险解决方法:
- 适当缩短均线周期,提升对市场变化的敏感性
- 结合其他指标进行验证,避免误判
- 参数优化方法:遍历、机器学习、遗传算法等
- 适当控制仓位规模和止损点
- 增加其他指标过滤器,结合多个指标判断,提高决策准确性
- 根据市场环境自动调整均线参数
- 结合机器学习算法自动寻优参数
- 优化止损策略
本策略基于均线交叉判断主要趋势的经典思路,通过不同均线的组合灵活应用。策略逻辑简单,容易实现,适合自动化交易。总体来说,本策略具有一定的实用性,但也存在一些改进优化的空间。通过参数优化、增加其他过滤器判断等方法,可以不断提升策略表现。
||
This strategy generates trading signals by calculating different types of moving averages (Simple Moving Average SMA, Exponential Moving Average EMA, Hull Moving Average HMA and Weighted Moving Average VWMA) and detecting crossover points between them, to determine the market trend and follow it. It generates buy signals when the shorter-term MA crosses above the longer-term MA from below, and sell signals when the opposite crossing happens.
The core idea of this strategy is to judge the market trend by comparing two moving averages. Specifically, it allows configuring two MAs with different types and lengths through input parameters. The first MA has a longer period to represent the major trend, while the second MA has a shorter period for the current short-term trend.
When the short-term MA crosses over the long-term MA from below, it signals that the short-term trend is strengthening and the market is entering an upward trend. Thus a buy signal is generated at this crossover point. Conversely, when the short-term MA crosses below the long-term MA, it suggests the short-term trend is weakening and the market is reversing downwards. Accordingly a sell signal is generated then.
By detecting such MA crossovers, this strategy follows the market trend to trade.
- Utilizes classic and practical MA crossover method to determine major trends
- Supports combinations of various MA types, providing flexibility
- Simple and clear logic, easy to understand and automate
- Configurable parameters adapt to different market conditions
- MAs have lagging effect, signals may come at or near turning points when price action has already happened
- Trend judgements may be inaccurate, incurring unnecessary losses
- Results vary significantly with different MA parameter settings
Solutions:
- Use shorter MA periods for better sensitivity
- Add other filters for cross-verification to avoid mistakes
- Parameter optimization methods e.g. brute force, machine learning, genetic algorithms
- Control position sizing and stop loss properly
- Add other indicators as filters to enhance accuracy
- Auto-adapt MA parameters based on changing market conditions
- Utilize machine learning for automated parameter optimization
- Refine stop loss strategy
This strategy builds on the classic idea of using MA crossovers for major trend detection. With flexible MA combinations, it is simple to implement and suitable for algorithmic trading automation. Overall it is reasonably practical but leaves room for enhancements like parameter tuning, additional filters etc. to further improve performance.
[/trans]
Strategy Arguments
| Argument | Default | Description |
|---|---|---|
| v_input_1_close | 0 | Source: close |
| v_input_2 | 25 | 1st MA Length |
| v_input_3 | 0 | 1st MA Type: HMA |
| v_input_4 | 7 | 2nd MA Length |
| v_input_5 | 0 | 2nd MA Type: HMA |
Source (PineScript)
/*backtest
start: 2023-12-31 00:00:00
end: 2024-01-30 00:00:00
period: 1h
basePeriod: 15m
exchanges: [{"eid":"Futures_Binance","currency":"BTC_USDT"}]
*/

//@version=3
//study(title="MA Crossover Strategy", overlay = true)
strategy("MA Crossover Strategy", overlay=true)
src = input(close, title="Source")

price = request.security(syminfo.tickerid, timeframe.period, src)
ma1 = input(25, title="1st MA Length")
type1 = input("HMA", "1st MA Type", options=["SMA", "EMA", "HMA", "VWMA"])

ma2 = input(7, title="2nd MA Length")
type2 = input("HMA", "2nd MA Type", options=["SMA", "EMA", "HMA", "VWMA"])

f_hma(_src, _length)=>
    _return = wma((2*wma(_src, _length/2))-wma(_src, _length), round(sqrt(_length)))

price1 = if (type1 == "SMA")
    sma(price, ma1)
else
    if (type1 == "EMA")
        ema(price, ma1)
    else
        if (type1 == "VWMA")
            vwma(price, ma1)
        else
            f_hma(price, ma1)

price2 = if (type2 == "SMA")
    sma(price, ma2)
else
    if (type2 == "EMA")
        ema(price, ma2)
    else
        if (type2 == "VWMA")
            vwma(price, ma2)
        else
            f_hma(price, ma2)


//plot(series=price, style=line,  title="Price", color=black, linewidth=1, transp=0)
plot(series=price1, style=line,  title="1st MA", color=blue, linewidth=2, transp=0)
plot(series=price2, style=line, title="2nd MA", color=green, linewidth=2, transp=0)


longCondition = crossover(price1, price2)
if (longCondition)
    strategy.entry("Long", strategy.long)

shortCondition = crossunder(price1, price2)
if (shortCondition)
    strategy.entry("Short", strategy.short)
Detail
https://www.fmz.com/strategy/440545
Last Modified
2024-01-31 15:17:31