Name
基于均线交叉的高频量化交易策略Intraday-Moving-Average-Crossover-Trading-Strategy
Author
ChaoZhang
Strategy Description
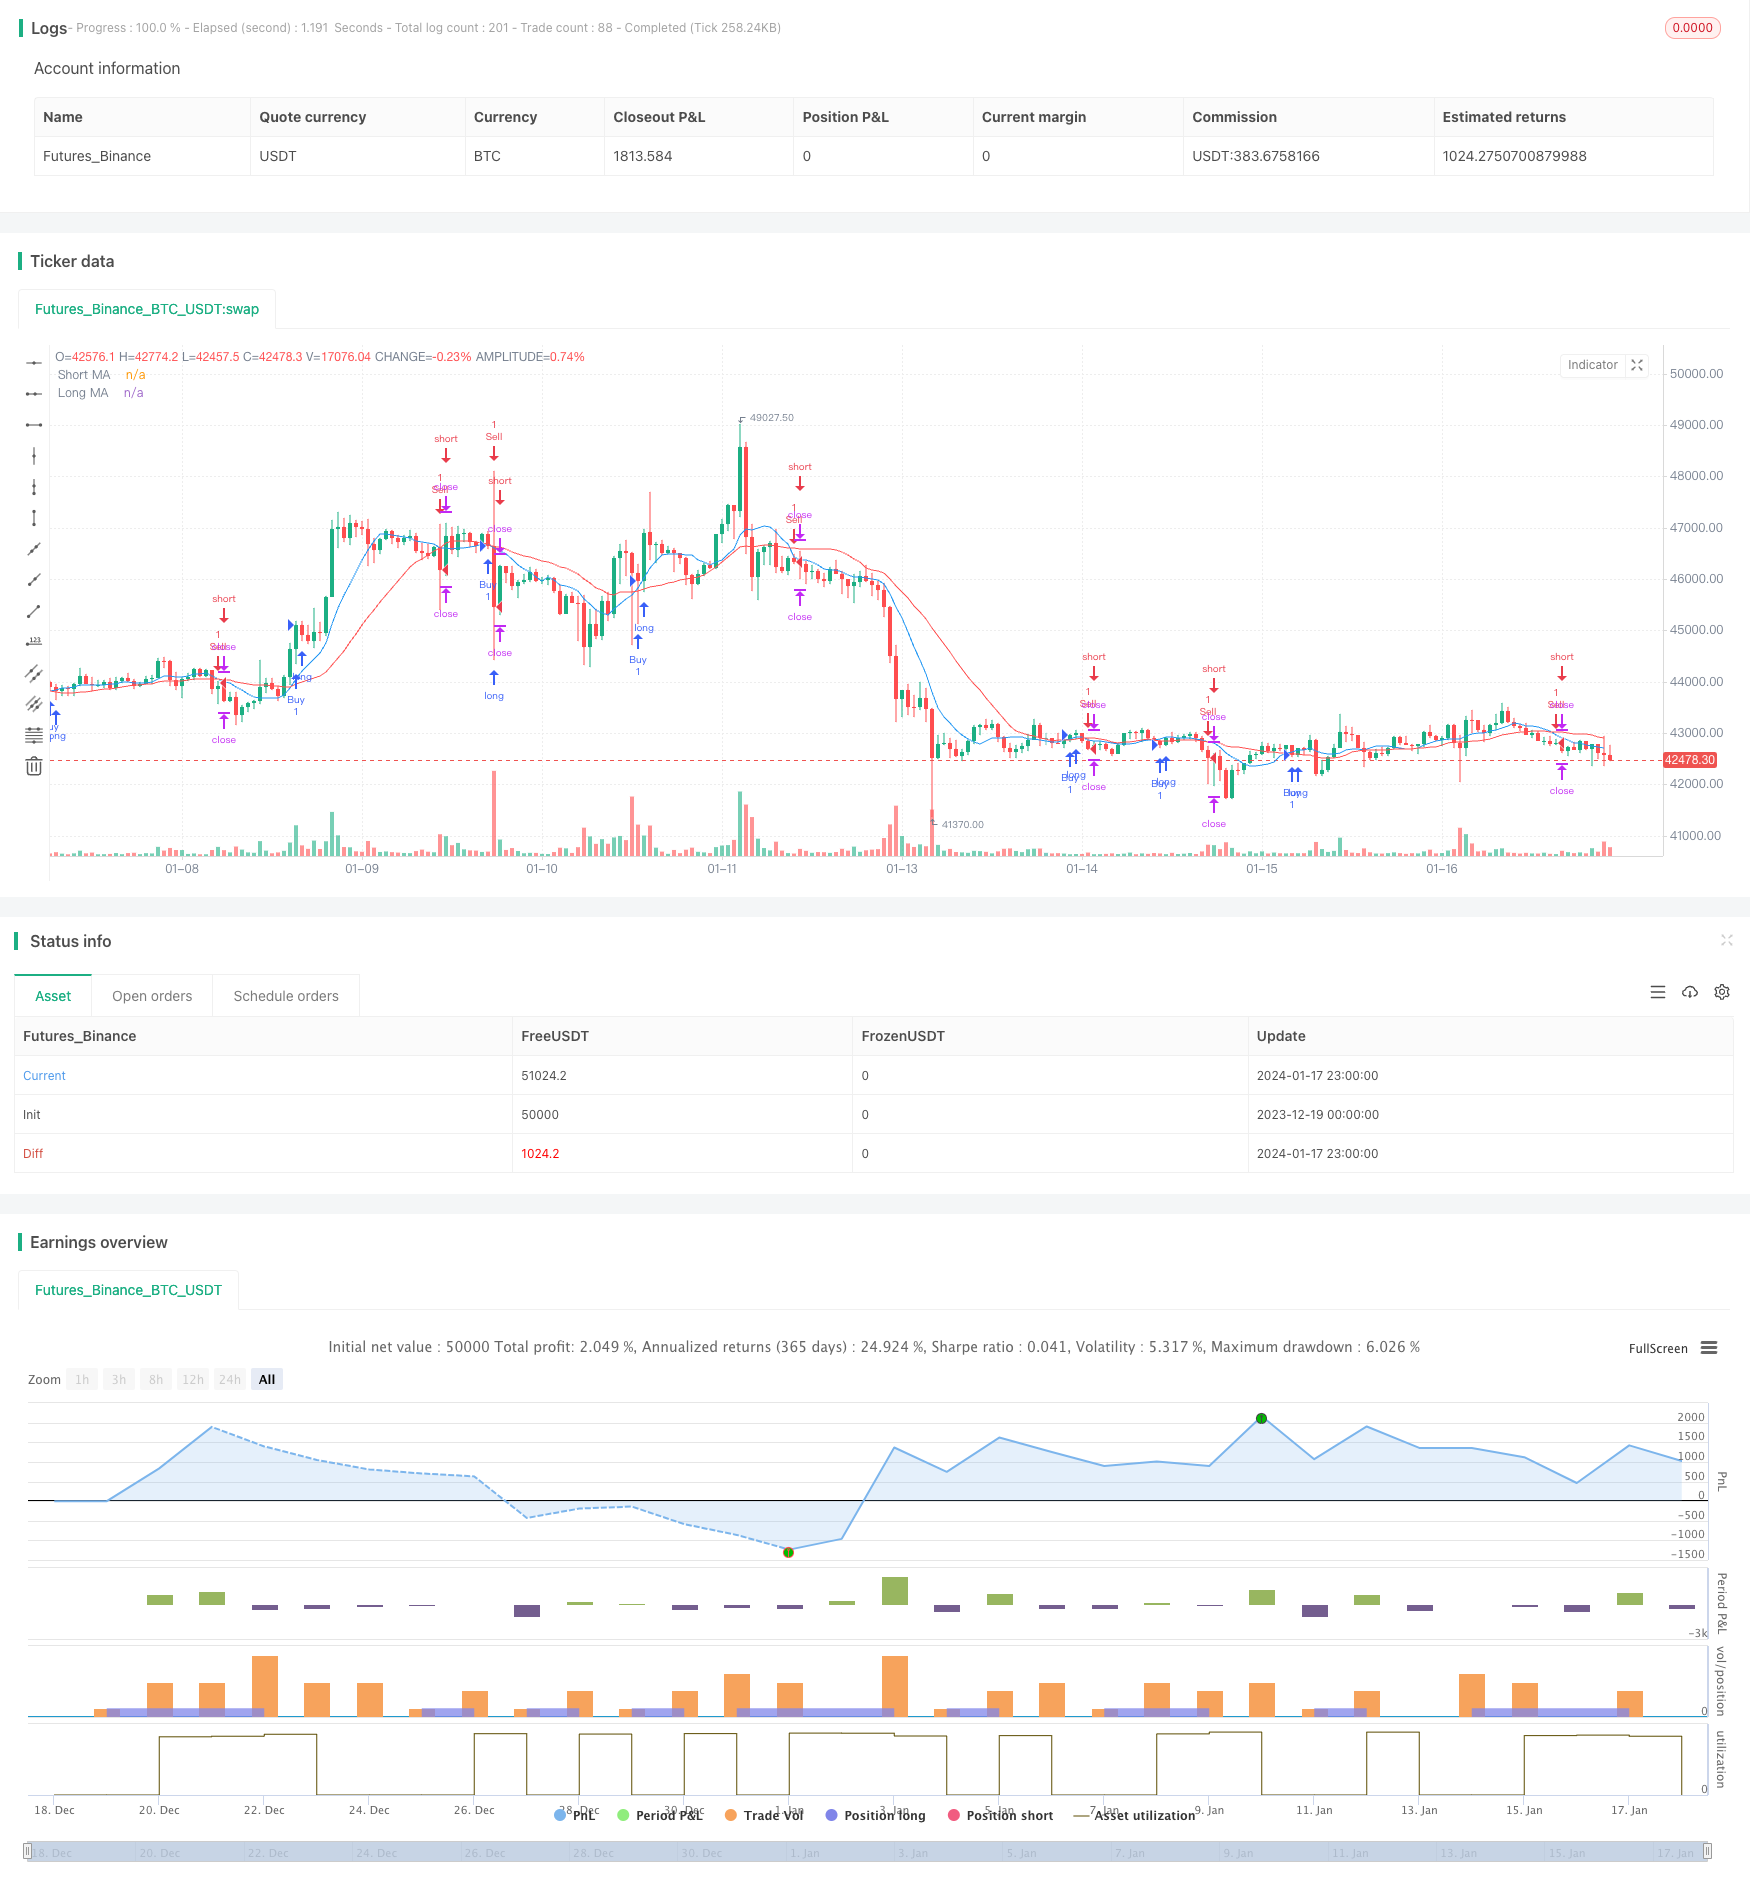
本策略基于移动平均线(Moving Average, MA)的金叉死叉来识别市场趋势的转折点,以捕捉短期股票价格的涨跌。策略会计算两条不同周期的MA,即一条较短周期的MA和一条较长周期的MA。当短周期MA上穿长周期MA时,产生买入信号;当短周期MA下穿长周期MA时,产生卖出信号。
该策略的核心判定逻辑在于短周期MA和长周期MA的交叉关系。短周期MA能更迅速地反应最近一段时间内的价格变动,而长周期MA具有更好的去噪能力,能反映长期价格趋势。当短MA上穿长MA时,说明近期价格开始走高,可能是短期股价反转的信号,因此产生买入信号,以捕捉后续的涨势。相反,当短MA下穿长MA时,说明近期价格开始走低,可能是短期股价反转的信号,因此产生卖出信号。
具体来说,该策略会对close价格应用ta.sma函数计算出两条MA线:maShort(9周期)和maLong(21周期)。然后利用ta.crossover和ta.crossunder函数判定短MA和长MA的交叉关系,以生成买入和卖出信号。最后设置止损止盈逻辑以锁定利润并控制风险。
- 利用MA交叉原理,可有效识别短期趋势的转折点
- 同时考量近期和长期价格变化,提高信号质量
- 直观反映股价的移动方向和动量
- 简单易懂,容易实现,适合高频短线交易
- 可灵活调整MA参数,适应不同交易品种
相比单一MA系统,该策略综合考量了短周期MA和长周期MA的价值,能减少假信号,提高盈利概率。同时,MA交叉信号清晰易读,操作规则直接有效,非常适合熟悉技术分析的交易者使用。
- MA交叉信号可能出现滞后,错过反转的最佳时点
- 严格遵循MA交叉可能带来过多的交易次数
- MA周期设置不当将影响信号质量
- 个股特质也会影响MA交叉系统的效果
如果仅机械跟随MA交叉信号,无法判断市场趋势和个股特质,可能面临获利能力低下或高频交易增加交易成本的问题。此外,MA交叉信号本身也可能滞后于真正的趋势转折点,从而错过最佳的反转时机。
- 优化MA的短长周期参数组合
- 结合其他分析工具,识别股票长短期趋势
- 考量个股特质,调整策略参数
- 结合量能指标,识别真正的反转信号
- 利用止损方法,合理控制单笔损失
例如,可以借助其它技术指标比如MACD、KDJ等来验证MA交叉信号,避免出现误判。也可以针对不同的交易品种,调整MA参数,从而提高策略稳定性。同时适当调整止损水平,防止单笔损失过大。综合运用各类优化手段,可以大幅提升基于MA交叉的短线交易策略的实际表现。
本策略基于MA交叉原理设计了一个简单直接的短线交易策略。它同时结合了短周期MA和长周期MA的优势,既考虑了近期价格动向也兼顾了长期趋势判断,从而产生了高质量的交易信号。该策略适合习惯使用技术分析工具的活跃交易者,可以通过调整MA参数等方法进行优化,从中获得丰厚的超额收益。
||
This strategy utilizes the golden cross and death cross of Moving Averages (MA) to identify turning points in market trends and capitalize on short-term price fluctuations of stocks. It calculates two MAs with different time periods, namely a shorter-period MA and a longer-period MA. When the shorter-period MA crosses above the longer-period MA, a buy signal is generated. When the shorter-period MA crosses below the longer-period MA, a sell signal is generated.
The core logic of this strategy lies in the crossover relationships between the shorter-period MA and longer-period MA. The shorter-period MA reflects recent price changes more swiftly, while the longer-period MA has better noise reduction capabilities to depict long-term price trends. When the shorter MA crosses above the longer MA, it indicates prices have started trending higher recently and may signal a short-term reversal, hence triggering a buy signal to capture subsequent upside. Conversely, when the shorter MA crosses below the longer MA, it signals recent downward price momentum and potential for a short-term reversal, thus generating a sell signal.
Specifically, this strategy applies the ta.sma function on the close prices to compute two MA lines: maShort (9 periods) and maLong (21 periods). It then uses the ta.crossover and ta.crossunder functions to determine if the shorter MA has crossed above or below the longer MA, in order to produce buy and sell signals accordingly. Stop loss and take profit logic is implemented at the end to lock in profits and manage risks.
- Effectively identifies short-term trend reversal points using MA crossover concept
- Considers both recent and long-term price changes to improve signal quality
- Intuitively depicts price direction and momentum
- Simple to understand and implement, suitable for high-frequency short-term trading
- Flexible MA parameters catered to different trading instruments
Compared to single MA systems, this strategy synthesizes the value of both shorter-period and longer-period MAs, resulting in fewer false signals and higher probability of profitability. Meanwhile, MA crossover signals are clear and straightforward for operators to interpret and act upon efficiently.
- MA crossover signals may lag, thus missing optimal reversal timing
- Strictly following MA crosses may result in excessive trading frequency
- Poor MA period settings negatively impact signal quality
- Individual stock characteristics also affect MA crossover system efficacy
Mechanically chasing MA crossover signals without judging market conditions and stock traits may lead to low profitability or high transaction costs from overtrading. Additionally, MA signals themselves may lag behind actual trend turning points.
- Optimize combination of short and long MA periods
- Incorporate other analytical tools to identify short-term and long-term trends
- Consider individual stock traits and adjust strategy parameters accordingly
- Integrate price volume indicators to spot authentic reversal signals
- Employ stop loss methods to rationally limit losses
For instance, other technical indicators like MACD, KDJ may be used to validate MA crossover signals and prevent misfires. MA parameters can also be tuned based on different trading instruments to enhance stability. Meanwhile, stop loss levels should be set appropriately to avoid oversized losses on individual trades. Comprehensively applying all such optimization techniques can substantially improve actual strategy performance building upon the simple MA crossover concept.
This strategy designs a straightforward short-term trading approach based on the MA crossover principle. By harmonizing the strengths of shorter-period MAs and longer-period MAs, it considers both recent price developments and long-term trends to produce high-quality trading signals. It suits active traders well-versed in using technical analysis tools. Further optimizations around aspects like MA periods can lead to strong excess returns.
[/trans]
Strategy Arguments
| Argument | Default | Description |
|---|---|---|
| v_input_int_1 | 9 | Short MA Length |
| v_input_int_2 | 21 | Long MA Length |
| v_input_float_1 | true | Stop Loss % |
| v_input_float_2 | true | Take Profit % |
Source (PineScript)
/*backtest
start: 2023-12-19 00:00:00
end: 2024-01-18 00:00:00
period: 1h
basePeriod: 15m
exchanges: [{"eid":"Futures_Binance","currency":"BTC_USDT"}]
*/

//@version=5
strategy("Intraday MA Crossover Strategy", overlay=true)

// Define MA lengths
maLengthShort = input.int(9, title="Short MA Length", minval=1)
maLengthLong = input.int(21, title="Long MA Length", minval=1)

// Calculate MAs
maShort = ta.sma(close, maLengthShort)
maLong = ta.sma(close, maLengthLong)

// Plot MAs on the chart
plot(maShort, color=color.blue, title="Short MA")
plot(maLong, color=color.red, title="Long MA")

// Generate Buy Signal (Golden Cross: Short MA crosses above Long MA)
buySignal = ta.crossover(maShort, maLong)
strategy.entry("Buy", strategy.long, when=buySignal)

// Generate Sell Signal (Death Cross: Short MA crosses below Long MA)
sellSignal = ta.crossunder(maShort, maLong)
strategy.entry("Sell", strategy.short, when=sellSignal)

// Set stop loss and take profit levels
stopLossPercent = input.float(1, title="Stop Loss %", minval=0.1, maxval=5)
takeProfitPercent = input.float(1, title="Take Profit %", minval=0.1, maxval=5)

strategy.exit("Take Profit/Stop Loss", from_entry="Buy", loss=close * stopLossPercent / 100, profit=close * takeProfitPercent / 100)
strategy.exit("Take Profit/Stop Loss", from_entry="Sell", loss=close * stopLossPercent / 100, profit=close * takeProfitPercent / 100)
Detail
https://www.fmz.com/strategy/439364
Last Modified
2024-01-19 15:32:58