Name
基于均线和RSI的机会跟踪策略EMA-Hull-and-RSI-Opportunity-Tracking-Strategy
Author
ChaoZhang
Strategy Description
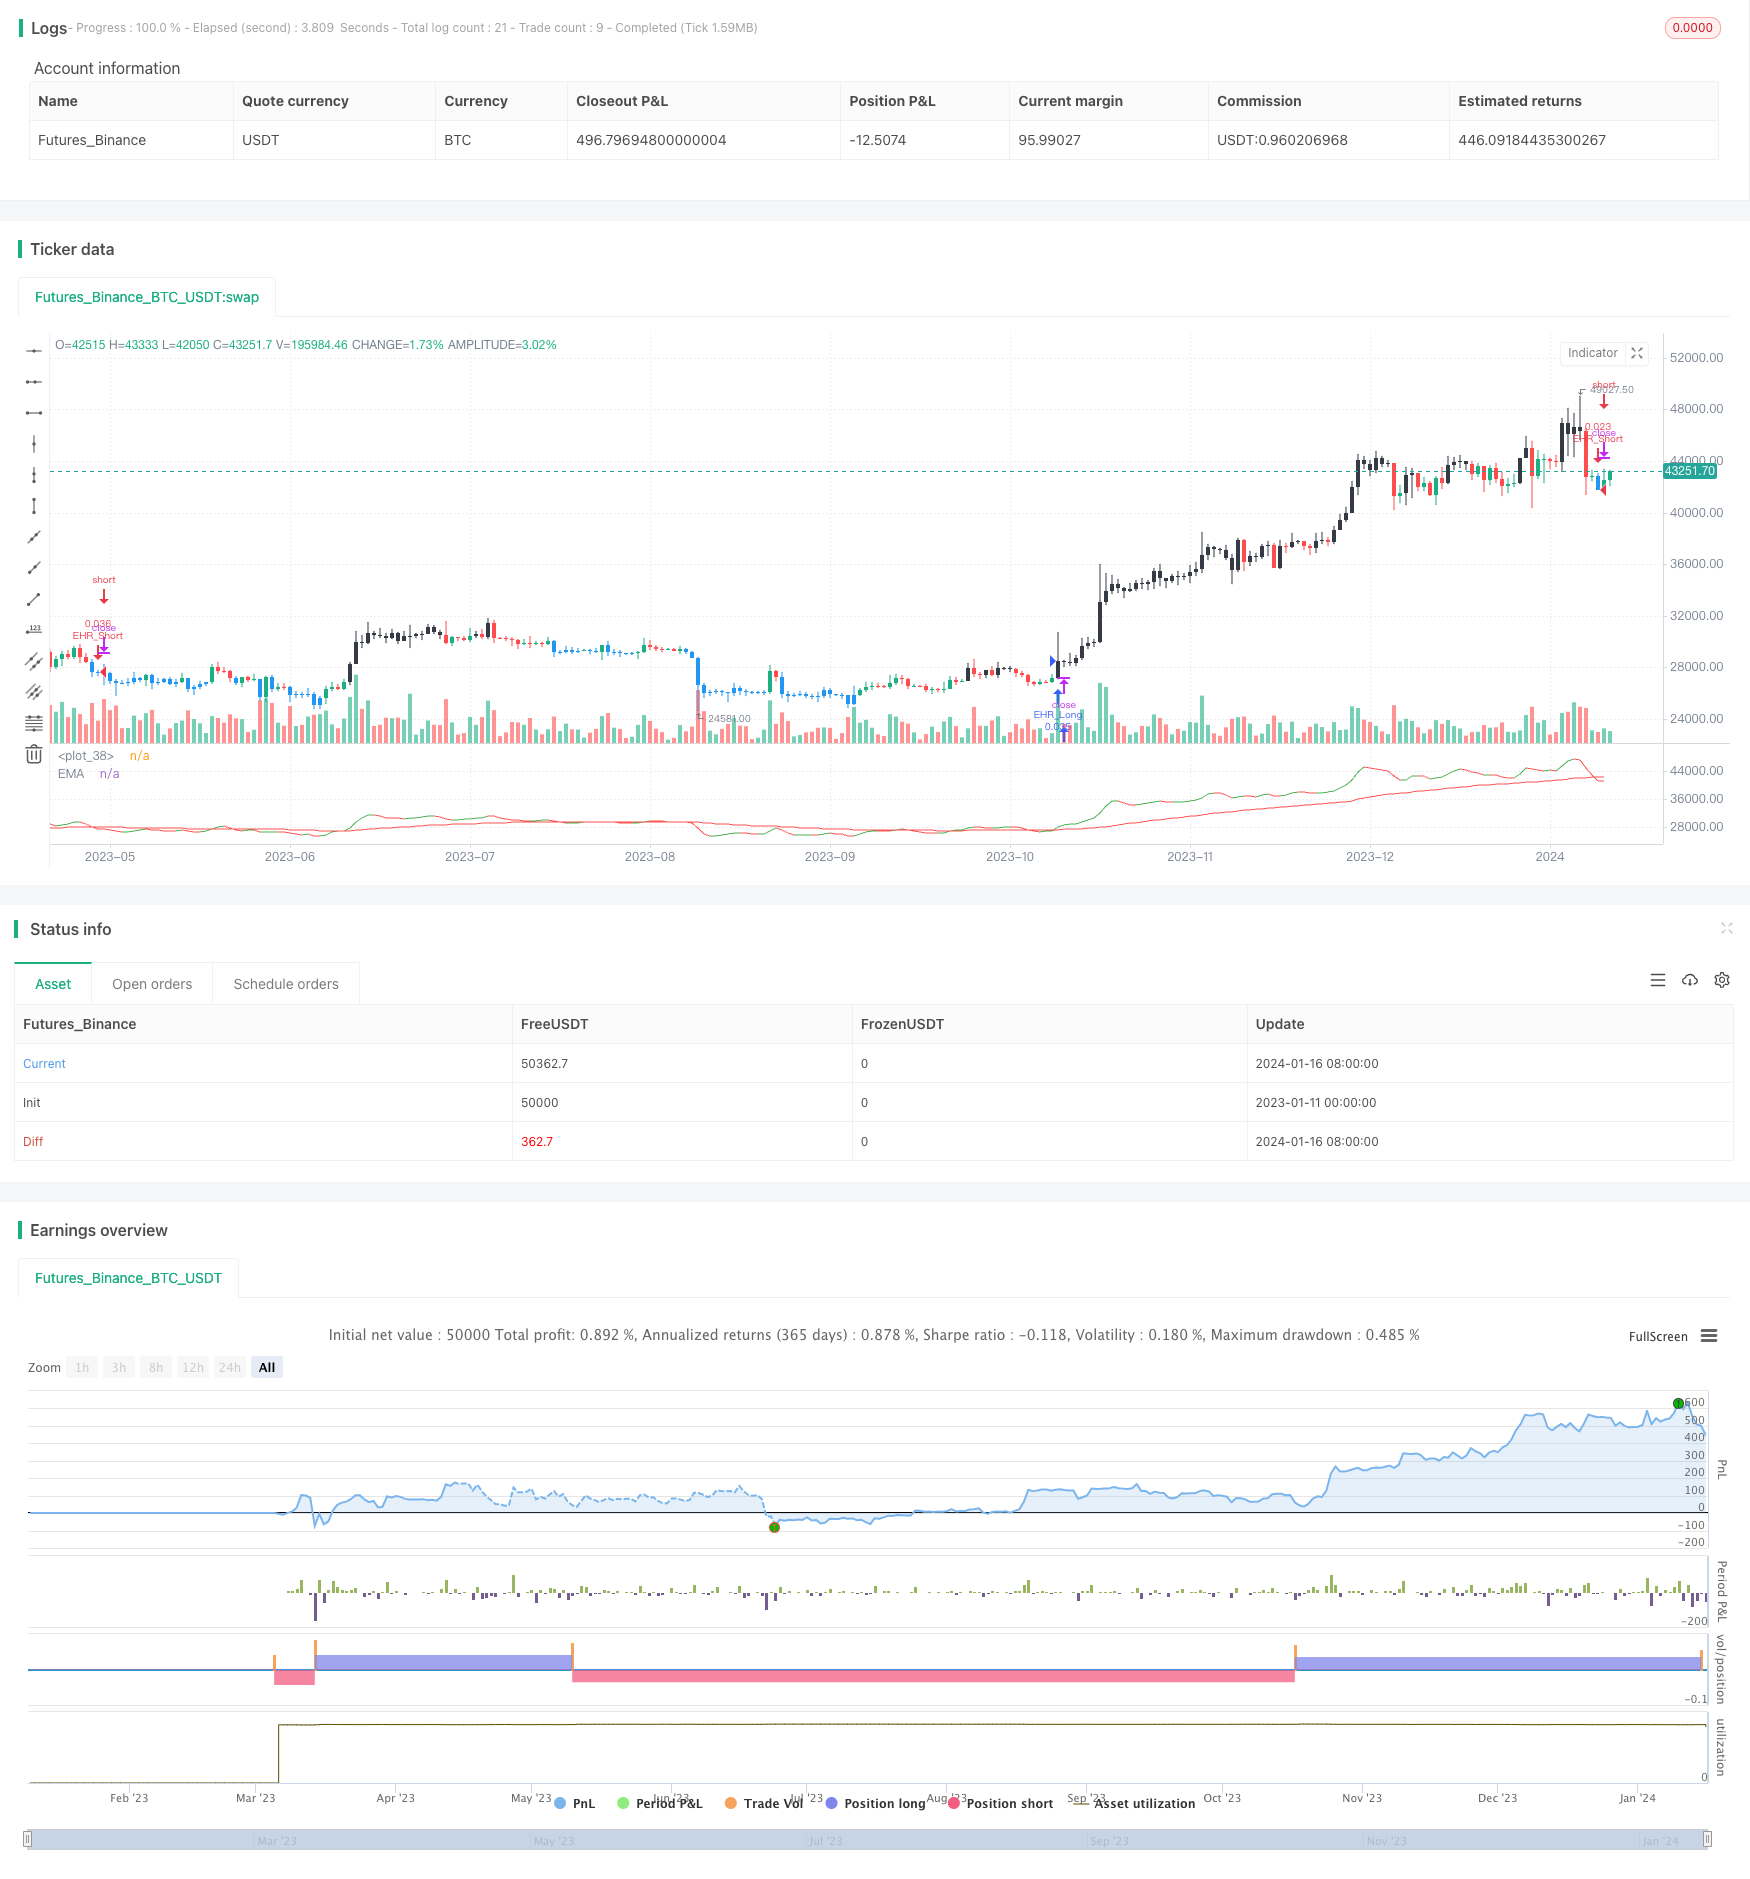
该策略基于移动均线、Hull移动均线和相对强弱指数(RSI)构建交易信号,属于典型的机会跟踪策略。它可以自动识别市场机会,进行长空切换,适用于中短期交易。
- 计算50周期的指数移动平均线(EMA)作为判断趋势的均线指标。
- 计算7日的Hull移动平均作为更敏感和先入的均线指标,与EMA形成金叉死叉。
- 设置RSI的超买线和超卖线分别为60和45,RSI高于60为超买讯号,RSI低于45为超卖区域。
- 当超买态同时发生向上穿越EMA时,则为做空信号。
- 当超卖区域同时发生向下穿越EMA时,则为做多信号。
- 组合使用EMA、Hull和RSI三种指标,综合判断市场的趋势、动量和超买超卖区域,提高信号的准确性。
- EMA为中长期趋势判断,Hull为短期先导性指标,RSI判断超买超卖区域,不同周期指标配合使用,把握不同级别的交易机会。
- 交易信号同时满足趋势、动量和超买超卖区域三个条件后才触发,可有效过滤假信号。
- 仅利用三个指标组合判断可能会漏掉一些交易机会。
- EMA和Hull的周期设定需要反复测试优化,不适当的参数选择可能影响应号质量。
- RSI的参数也需要调整,不同的股票和外汇对超买超卖判断标准会有所不同。
- 可以引入更多辅助指标,如布林线、KC线等,形成多重共振进行决策。
- 可以针对不同品种设置不同的参数组合进行优化。
- 可以结合高级别时间周期做决策,避免被短期的假突破误导。
- 可以引入止损策略管理风险。
该策略利用EMA、Hull和RSI三种指标的组合来捕捉中短期交易机会。策略信号的产生需要满足趋势、动量和超买超卖三个维度,从而过滤很多假信号。同时,可以通过参数优化和引入更多辅助指标等方式来进一步提高策略的稳定性和交易绩效。
||
This strategy constructs trading signals based on moving averages, Hull moving averages and the Relative Strength Index (RSI). It belongs to a typical opportunity tracking strategy that can automatically identify market opportunities and switch between long and short positions. It is suitable for medium and short term trading.
- Calculate the 50-period Exponential Moving Average (EMA) as the indicator for judging the trend.
- Calculate the 7-day Hull Moving Average as a more sensitive and leading average indicator, crossing EMA to form golden crosses and dead crosses.
- Set the overbought line and oversold line for RSI at 60 and 45 respectively. RSI above 60 is an overbought signal and RSI below 45 is an oversold area.
- When overbought happens at the same time as an upwards penetration of EMA, it is a short signal.
- When oversold happens at the same time as a downwards penetration of EMA, it is a long signal.
- Uses a combination of EMA, Hull and RSI to comprehensively judge market trends, momentum and overbought/oversold areas, improving signal accuracy.
- EMA judges mid-to-long term trends, Hull leads shorter term moves, RSI identifies overbought/oversold levels. Different period indicators working together capture trading opportunities across timeframes.
- Entry signals must meet criteria for trend, momentum and overbought/oversold zones simultaneously to trigger, effectively filtering false signals.
- Only using 3 indicators may miss some trading opportunities.
- EMA and Hull periods need continual testing and optimization, improper parameter selections can impact signal quality.
- RSI parameters also need to be adjusted for different equities and currencies which may have different overbought/oversold standards.
- More auxiliary indicators can be introduced, e.g. Bollinger Bands, KC Lines etc to create multi-resonance decision making.
- Parameters can be optimized for different products.
- Higher timeframe analysis can be incorporated to avoid being misled by short term fakeouts.
- Stop loss strategies can be implemented to manage risk.
This strategy uses the combination of EMA, Hull and RSI across timeframes to capture medium and short term trading opportunities. Entry signals must meet criteria in trend, momentum and overbought/oversold dimensions simultaneously in order to filter out false signals. The strategy can be further enhanced through parameter optimization and introducing more auxiliary indicators to improve stability and trading performance.
[/trans]
Strategy Arguments
| Argument | Default | Description |
|---|---|---|
| v_input_1 | 50 | EMA Length |
| v_input_2_close | 0 | EMA Source: close |
| v_input_3 | 60 | overbought value |
| v_input_4 | 45 | oversold value |
| v_input_5 | 7 | Hull Length |
Source (PineScript)
/*backtest
start: 2023-01-11 00:00:00
end: 2024-01-17 00:00:00
period: 1d
basePeriod: 1h
exchanges: [{"eid":"Futures_Binance","currency":"BTC_USDT"}]
*/

// This source code is subject to the terms of the Mozilla Public License 2.0 at https://mozilla.org/MPL/2.0/
// © Bitduke

//@version=4
strategy(shorttitle="EHR", title="Simple EMA_Hull_RSI", overlay=false,
     calc_on_every_tick=false, pyramiding=0, default_qty_type=strategy.cash,
     default_qty_value=1000, currency=currency.USD, initial_capital=1000,
     commission_type=strategy.commission.percent, commission_value=0.075)

// EMA
len = input(minval=1, title="EMA Length", defval=50)
src = input(close, title="EMA Source")
final_ema = ema(src, len)
plot(final_ema, color=color.red, title="EMA")

overbought = input(60, title="overbought value")
oversold = input(45, title="oversold value")

overbought_signal = rsi(close, 14) > overbought
oversold_signal = rsi(close, 14) < oversold
barcolor(overbought_signal ? color.black : na)
barcolor(oversold_signal ? color.blue : na)
// Hull MA
n = input(title="Hull Length", defval=7)
n2ma=2*wma(close,round(n/2))
nma=wma(close,n)
diff=n2ma-nma
sqn=round(sqrt(n))

n2ma1=2*wma(close[1],round(n/2))
nma1=wma(close[1],n)
diff1=n2ma1-nma1
sqn1=round(sqrt(n))

n1=wma(diff,sqn)
n2=wma(diff1,sqn)
c=n1>n2?color.green:color.red
ma=plot(n1,color=c)

// Strategy Logic
longCondition =  overbought_signal and crossover(n1,final_ema)
shortCondition = oversold_signal and crossover(final_ema,n1)

strategy.entry("EHR_Long", strategy.long, when=longCondition)
strategy.entry("EHR_Short", strategy.short, when=shortCondition)
Detail
https://www.fmz.com/strategy/439243
Last Modified
2024-01-18 15:46:35