Name
基于均线差值的趋势跟踪策略Trend-Following-Strategy-Based-on-Moving-Average-Difference
Author
ChaoZhang
Strategy Description
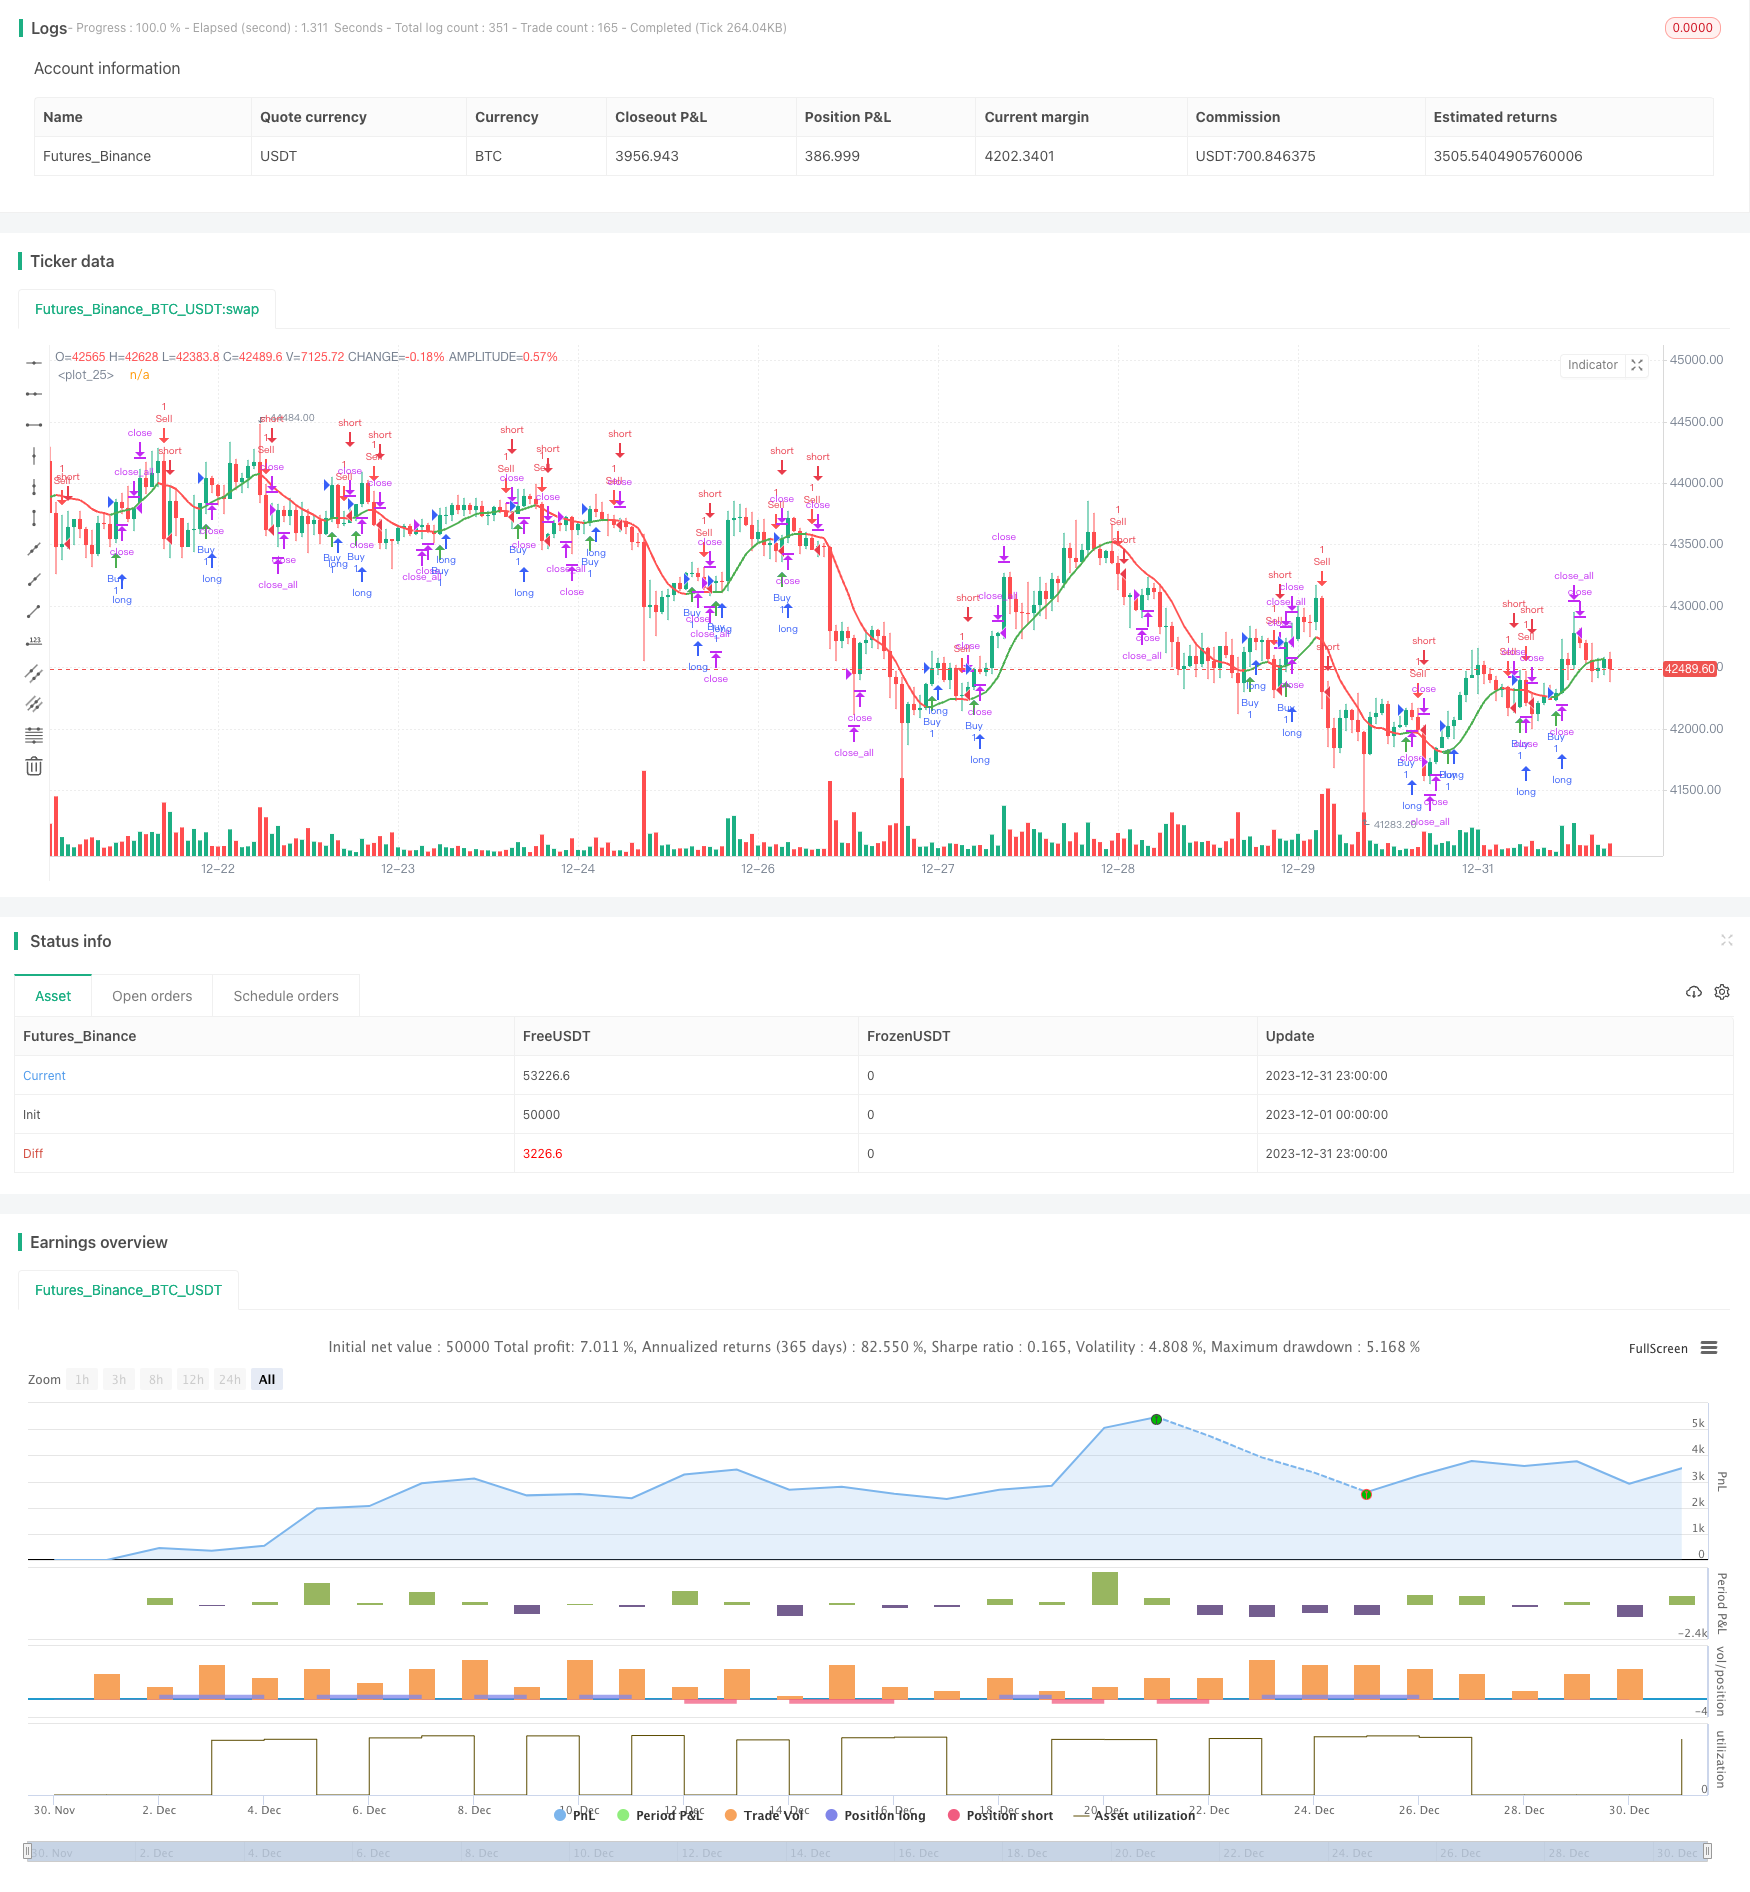
本策略基于均线差值的指标,当快线上穿慢线时生成买入信号,当快线下穿慢线时生成卖出信号,属于趋势跟踪类策略。策略简单明了,容易理解,适合中短线操作。
该策略通过计算两个不同参数的EMA均线的差值,再对这个差值计算其本身的EMA来产生交易信号。具体来说,选取周期period,计算period/2周期的2倍EMA作为快线,计算period周期EMA作为慢线,两个EMA之差构成差值diff。然后对diff再计算sqrt(period)周期的EMA,得到指标线n1。当n1上穿0轴时产生买入信号,当n1下穿0轴时产生卖出信号。这样,n1反映了差值diff的趋势方向,可以用于捕捉价格趋势。
该策略简单直接,通过双均线差值指标来判断价格趋势,属于典型的趋势跟踪策略。当价格处于趋势市场时,效果明显;当价格震荡时,则会产生多次错误信号。需要结合趋势判断和风险管理来使用。
该策略具有以下优势:
-
策略思路简单直观,容易理解实现,适合初学者学习;
-
均线差值指标对价格变化敏感,可以有效捕捉趋势变化;
-
策略参数少,容易优化,实盘调整灵活;
-
可配置长短周期指标组合,适应不同市场环境;
-
可根据个人风险偏好配置止损策略,降低损失。
该策略也存在以下风险:
-
震荡行情下误报率较高,需要辅助判断大级别趋势;
-
无法有效判断趋势反转点,存在一定的延迟;
-
需关注均线差值指标参数的优化,防止过于敏感或滞后;
-
交易次数较多,交易成本可能较高,需控制仓位规模。
对应解决方法如下:
-
结合长周期均线判断大趋势,避免震荡市错入;
-
配合其他反转指标确定买卖点,降低延迟风险;
-
测试参数组合,找到最佳参数;
-
优化止损策略,降低单笔损失。
该策略可以从以下方面进行优化:
-
测试不同均线参数组合,找到最优参数;
-
增加趋势判断指标,区分趋势和震荡;
-
结合反转指标确定买卖点,提高精确度;
-
优化止损策略,降低损失。
测试不同周期参数可以提高策略 stabilit 对不同行情的适应性。增加趋势判断可以减少误报。反转指标可以提升买卖的时间点选择。这些优化都可以提高策略的稳定性和盈利能力。
基于均线差值的趋势跟踪策略整体思路清晰易懂,通过双均线差值判断价格趋势方向,属于典型的趋势追踪策略。策略本身非常简单,容易实现,适合中短线操盘,特别适合初学者学习研究。但策略也存在一定风险,需要配合优化手段降低风险。如果参数优化和风险控制得当,该策略可以获得较好的效果。
||
This strategy generates trading signals based on the difference between two moving averages. When the fast line crosses above the slow line, a buy signal is generated. When the fast line crosses below the slow line, a sell signal is generated. It belongs to the category of trend following strategies. The strategy is simple and easy to understand, suitable for medium-term trading.
The strategy calculates the difference between two EMAs with different parameters, and then computes another EMA based on this difference to generate trading signals. Specifically, it chooses a period, calculates 2 times EMA of period/2 as the fast line, and EMA of period as the slow line. The difference between these two EMAs constitutes the difference value diff. Then it calculates the EMA of diff based on the period of sqrt(period), resulting in the indicator line n1. When n1 crosses above 0, a buy signal is generated. When n1 crosses below 0, a sell signal is generated. Thus n1 reflects the trend direction of diff, which can be used to capture price trends.
The strategy is simple and direct, using the double moving average difference indicator to judge price trends. It belongs to a typical trend following strategy. It works well in trending markets, but may generate false signals during range-bound markets. Proper trend judgment and risk management should be used together with the strategy.
The strategy has the following advantages:
-
The strategy logic is simple and intuitive, easy to understand and implement, suitable for beginners;
-
The moving average difference indicator is sensitive to price changes and can effectively capture trend changes;
-
The strategy has few parameters and is easy to optimize and adjust in real trading;
-
Long and short period indicators can be combined to adapt to different market environments;
-
Stop loss strategies can be configured according to personal risk preferences to reduce losses.
The strategy also has the following risks:
-
Higher false signal rate in range-bound markets, larger timeframe trends should be considered;
-
Unable to effectively determine trend reversal points, there is a certain lag;
-
The parameters of the difference indicator need to be monitored to prevent being too sensitive or lagging;
-
High trading frequency may lead to higher transaction costs, position sizing needs control.
The corresponding solutions are:
-
Combining long period moving averages to determine major trends, avoid wrongly entering during ranges;
-
Adding reversal indicators to determine entry and exit points, reduce lag risk;
-
Testing parameter combinations to find optimum parameters;
-
Optimizing stop loss strategies to reduce per trade loss.
The strategy can be optimized in the following aspects:
-
Test different moving average parameter combinations to find optimum parameters;
-
Add trend judgment indicators to distinguish between trending and range-bound markets;
-
Combine reversal indicators to improve entry accuracy;
-
Optimize stop loss strategies to reduce losses.
Testing different period parameters can improve the adaptability of the strategy to different market conditions. Adding trend filters can reduce false signals. Reversal indicators can improve timing of entries. These optimizations can enhance the stability and profitability of the strategy.
The trend following strategy based on moving average difference has a clear and easy to understand logic. By judging price trends using double moving average differences, it belongs to a typical trend chasing strategy. The strategy itself is very simple and easy to implement, suitable for medium-term trading, especially for beginners to study. But there are also certain risks with the strategy that need to be reduced through optimizations. With proper parameter tuning and risk control, the strategy can achieve good results.
[/trans]
Strategy Arguments
| Argument | Default | Description |
|---|---|---|
| v_input_1 | 21 | Period |
Source (PineScript)
/*backtest
start: 2023-12-01 00:00:00
end: 2023-12-31 23:59:59
period: 1h
basePeriod: 15m
exchanges: [{"eid":"Futures_Binance","currency":"BTC_USDT"}]
*/

//@version=5
strategy(title='Devick', overlay=true)

// Input parameters
period = input(title='Period', defval=21)

// Calculate moving averages
n2ma = 2 * ta.ema(close, math.round(period / 2))
nma = ta.ema(close, period)
diff = n2ma - nma
sqn = math.round(math.sqrt(period))

n2maPrev = 2 * ta.ema(close[1], math.round(period / 2))
nmaPrev = ta.ema(close[1], period)
diffPrev = n2maPrev - nmaPrev
sqnPrev = math.round(math.sqrt(period))

n1 = ta.ema(diff, sqn)
n2 = ta.ema(diffPrev, sqnPrev)

// Determine color based on condition
maColor = n1 > n2 ? color.green : color.red

// Plot moving average
ma = plot(n1, color=maColor, linewidth=2)

// Signals
buySignal = n1 > n2 and n1[1] <= n2[1]
sellSignal = n1 <= n2 and n1[1] > n2[1]

// Plot shapes for signals
plotshape(series=buySignal, title='Buy Signal', style=shape.arrowup, location=location.belowbar, color=color.green, size=size.small)
plotshape(series=sellSignal, title='Sell Signal', style=shape.arrowdown, location=location.abovebar, color=color.red, size=size.small)

// Alerts
alertcondition(condition=buySignal, title='Buy Signal', message='Buy Signal Detected')
alertcondition(condition=sellSignal, title='Sell Signal', message='Sell Signal Detected')

// Trading hours
openHour = 16
closeHour = 17

// Open position at 4 pm
openCondition = hour == openHour and minute == 0
strategy.entry("Buy", strategy.long, when=buySignal)
strategy.entry("Sell", strategy.short, when=sellSignal)
// Close all positions at 5 pm
closeCondition = hour == closeHour and minute == 0
strategy.close_all(when=closeCondition)
Detail
https://www.fmz.com/strategy/438499
Last Modified
2024-01-12 14:42:06