Name
基于均线的布林带短线反转量化策略Bollinger-Band-Short-term-Reversion-Quantitative-Strategy-Based-on-Moving-Average
Author
ChaoZhang
Strategy Description
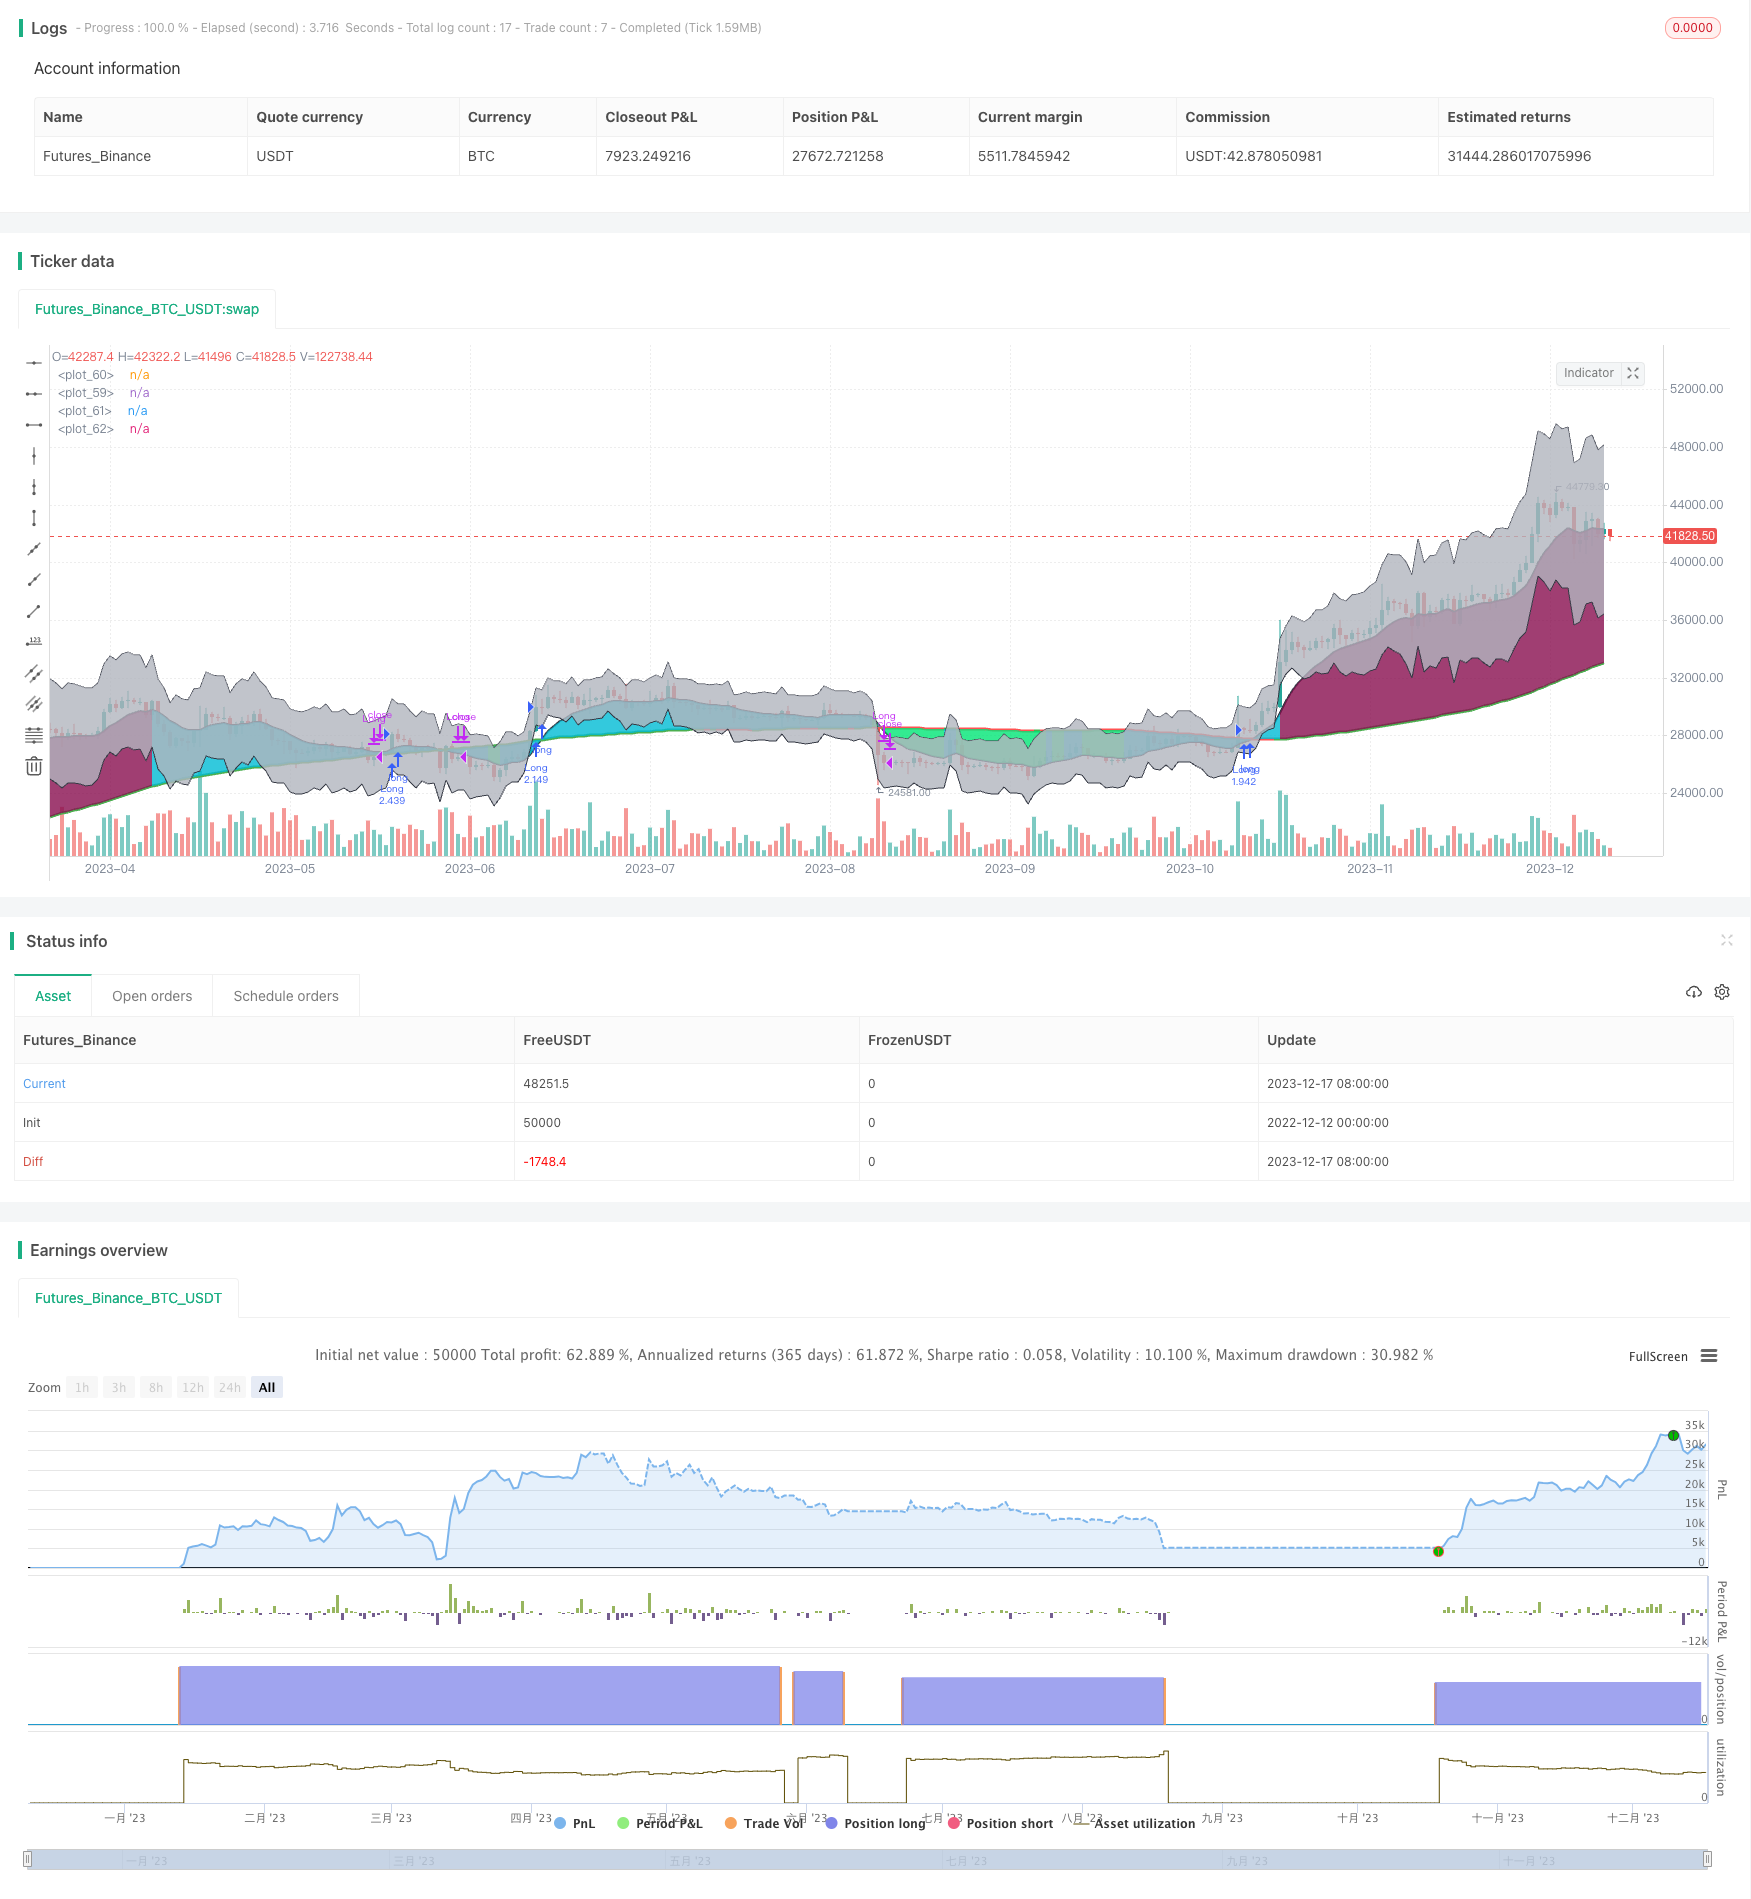
该策略是一种基于布林带指标的短线反转交易策略。它结合了均线、标准差和布林带通道,寻找价格异常离散的机会进行反转交易。
-
计算均线和标准差。使用sma()函数计算sma均线,使用stdev()函数计算标准差。
-
根据均线和标准差计算布林带上下轨。上轨线为价格+标准差1,下轨线为价格-标准差1。
-
当价格突破上轨或下轨时,表明价格发生异常,这时我们判断去做反转交易。
-
具体来说,如果价格低于下轨,我们做多头交易;如果价格高于上轨,我们做空头交易。
-
利用布林带通道判断价格异常,这为反转交易提供了依据。
-
结合均线因子,可以有效过滤部分噪音交易。
-
标准差因子的引入,让布林带通道更加动态,更好判断价格异常。
-
该策略回撤较小,具有一定的稳定性。
-
布林带指标并不能完全判断价格的异常情况,价格可能出现假突破的情况。
-
交易频率可能过高,建议适当调整参数,控制交易频率。
-
突破布林带上下轨信号可能时间较长,需要适当调整参数获得更好的反转效果。
-
适当引入止损来控制风险。
- 优化均线周期和标准差参数,获得更加合理的布林带通道。
- 增加EMA和MACD等辅助因子,过滤部分信号。
- 引入止损和头寸控制机制。
- 优化仓位规模和仓位控制措施。
该策略通过布林带指标判断价格异常,配合均线和标准差参数进行反转交易。具有一定的稳定性。我们需要进一步通过参数优化、辅助因子引入、止损管理和仓位控制等手段来降低策略的最大回撤和提高稳定性。
||
This strategy is a short-term reversal trading strategy based on the Bollinger Band indicator. It combines moving averages, standard deviations and Bollinger bands to look for opportunities for reversal trading when prices are abnormally dispersed.
-
Calculate moving average and standard deviation. Use sma() function to calculate sma moving average and stdev() function to calculate standard deviation.
-
Calculate upper and lower rail of Bollinger band according to moving average and standard deviation. The upper rail is price+standard deviation1 and the lower rail is price-standard deviation1.
-
When the price breaks through the upper or lower rail, it indicates that the price is abnormal. At this time, we determine to do reverse trading.
-
Specifically, if the price is lower than the lower rail, we go long; if the price is higher than the upper rail, we go short.
-
Use Bollinger band channel to judge abnormal prices, which provides basis for reverse trading.
-
Combined with the moving average factor, some noisy trades can be effectively filtered out.
-
The introduction of standard deviation factor makes the Bollinger band channel more dynamic to better judge abnormal prices.
-
This strategy has relatively small drawdowns and certain stability.
-
The Bollinger Band indicator cannot completely determine the abnormal situation of prices. There may be false breakouts.
-
The trading frequency may be too high. It is recommended to adjust the parameters appropriately to control the trading frequency.
-
The breakout signals of the upper and lower Bollinger bands may last for a long time. Appropriate adjustment of parameters is needed to obtain better reversal effects.
-
Introduce stop loss appropriately to control risks.
-
Optimize the moving average cycle and standard deviation parameters to obtain a more reasonable Bollinger band channel.
-
Increase auxiliary factors such as EMA and MACD to filter some signals.
-
Introduce stop loss and position control mechanisms.
-
Optimize position size and position control measures.
This strategy judges abnormal prices through the Bollinger Band indicator and makes reversal trades with moving averages and standard deviation parameters. It has certain stability. We need to further reduce the maximum drawdown of the strategy and improve stability through means such as parameter optimization, introduction of auxiliary factors, stop loss management and position control.
[/trans]
Strategy Arguments
| Argument | Default | Description |
|---|---|---|
| v_input_1 | 2017 | Backtest Start Year |
| v_input_2 | true | Backtest Start Month |
| v_input_3 | true | Backtest Start Day |
| v_input_4 | 2025 | Backtest End Year |
| v_input_5 | true | Backtest End Month |
| v_input_6 | true | Backtest End Day |
| v_input_7 | 100 | Lookback Period For SMA |
| v_input_8 | 10 | Lookback Period For EMA |
| v_input_9 | 6 | Percentage Deviation From SMA to go Long |
| v_input_10 | 20 | Percentage Deviation From SMA to go Short |
| v_input_11 | 4 | The number of bars the EMA must rise/fall |
| v_input_12 | true | Allow Longs? |
| v_input_13 | true | Allow Shorts? |
| v_input_14 | true | Use Stoploss? |
| v_input_15 | 30 | Stop Loss Percentage |
Source (PineScript)
/*backtest
start: 2022-12-12 00:00:00
end: 2023-12-18 00:00:00
period: 1d
basePeriod: 1h
exchanges: [{"eid":"Futures_Binance","currency":"BTC_USDT"}]
*/

//@version=3
strategy("BCE Version of EMA, SMA Mean Reversion", overlay=true, default_qty_type=strategy.percent_of_equity, default_qty_value=100)

// Inputs
st_yr_inp = input(defval=2017, title='Backtest Start Year')
st_mn_inp = input(defval=01, title='Backtest Start Month')
st_dy_inp = input(defval=01, title='Backtest Start Day')
en_yr_inp = input(defval=2025, title='Backtest End Year')
en_mn_inp = input(defval=01, title='Backtest End Month')
en_dy_inp = input(defval=01, title='Backtest End Day')
sma_lookback = input(defval=100, title="Lookback Period For SMA")
ema_lookback = input(defval=10, title="Lookback Period For EMA")
long_diff_perc = input(defval=6, title="Percentage Deviation From SMA to go Long")/100
short_diff_perc = input(defval=20, title="Percentage Deviation From SMA to go Short")/100
ema_filter_bars = input(defval=4, title="The number of bars the EMA must rise/fall")
lng_allwd = input(defval=true, title="Allow Longs?")
srt_allwd = input(defval=true, title="Allow Shorts?")
use_stop = input(defval=true, title="Use Stoploss?")
stop_perc = input(defval=30, title="Stop Loss Percentage")/100

// Dates
start = timestamp(st_yr_inp, st_mn_inp, st_dy_inp,00,00)
end = timestamp(en_yr_inp, en_mn_inp, en_dy_inp,00,00)
can_trade = time >= start and time <= end
// Indicators Setup
sma = sma(close, sma_lookback)
ema = ema(close, ema_lookback)

// Strategy Calcuations
close_stdev = stdev(close, sma_lookback)
sd1_upper = close + (close_stdev * 1)
sd1_lower = close - (close_stdev * 1)
close_diff = (close - sma) / sma

// Entries and Exits
longCondition = close > sma and open > sma
if (time >= start and time <= end)
    if (longCondition)
        strategy.entry("Long", strategy.long)
    if use_stop
        stop_price = close * (1 - stop_perc)
        strategy.order("Long Stoploss", false, stop=stop_price)

shortCondition = close < sma and open < sma
if (shortCondition)
//    strategy.entry("Short", strategy.short)
//    if use_stop
//        stop_price = close * (1 + stop_perc)
//        strategy.order("Short Stoploss", true, stop=stop_price)
//if (time >= start)
    strategy.close("Long", when=close < sma and open < sma)
//strategy.cancel("Long Stoploss", when=sma < sma[1])
//    strategy.close("Short", when=close > sma and open > sma)
//strategy.cancel("Short Stoploss", when=close_diff<=0)

// Plotting
sma_col = sma > sma[1] ? green : red
ema_fill = close_diff <= -long_diff_perc ? lime : close_diff >= short_diff_perc ? maroon : aqua
p_sma = plot(sma, color=sma_col, linewidth=3)
p_ema = plot(ema, color=black, linewidth=2)
p_sd1 = plot(sd1_upper, color=black, linewidth=1, transp=85)
p_sd2 = plot(sd1_lower, color=black, linewidth=1, transp=85)
fill(p_sd1, p_sd2, title='STDEV Fill', color=silver, transp=80)
fill(p_sma, p_ema, title='EMA > Mean Percentage', color=ema_fill, transp=80)
Detail
https://www.fmz.com/strategy/435902
Last Modified
2023-12-19 16:17:47