Name
基于多重EMA和RSI的趋势追踪策略Multi-EMA-and-RSI-Trend-Following-Strategy
Author
ChaoZhang
Strategy Description
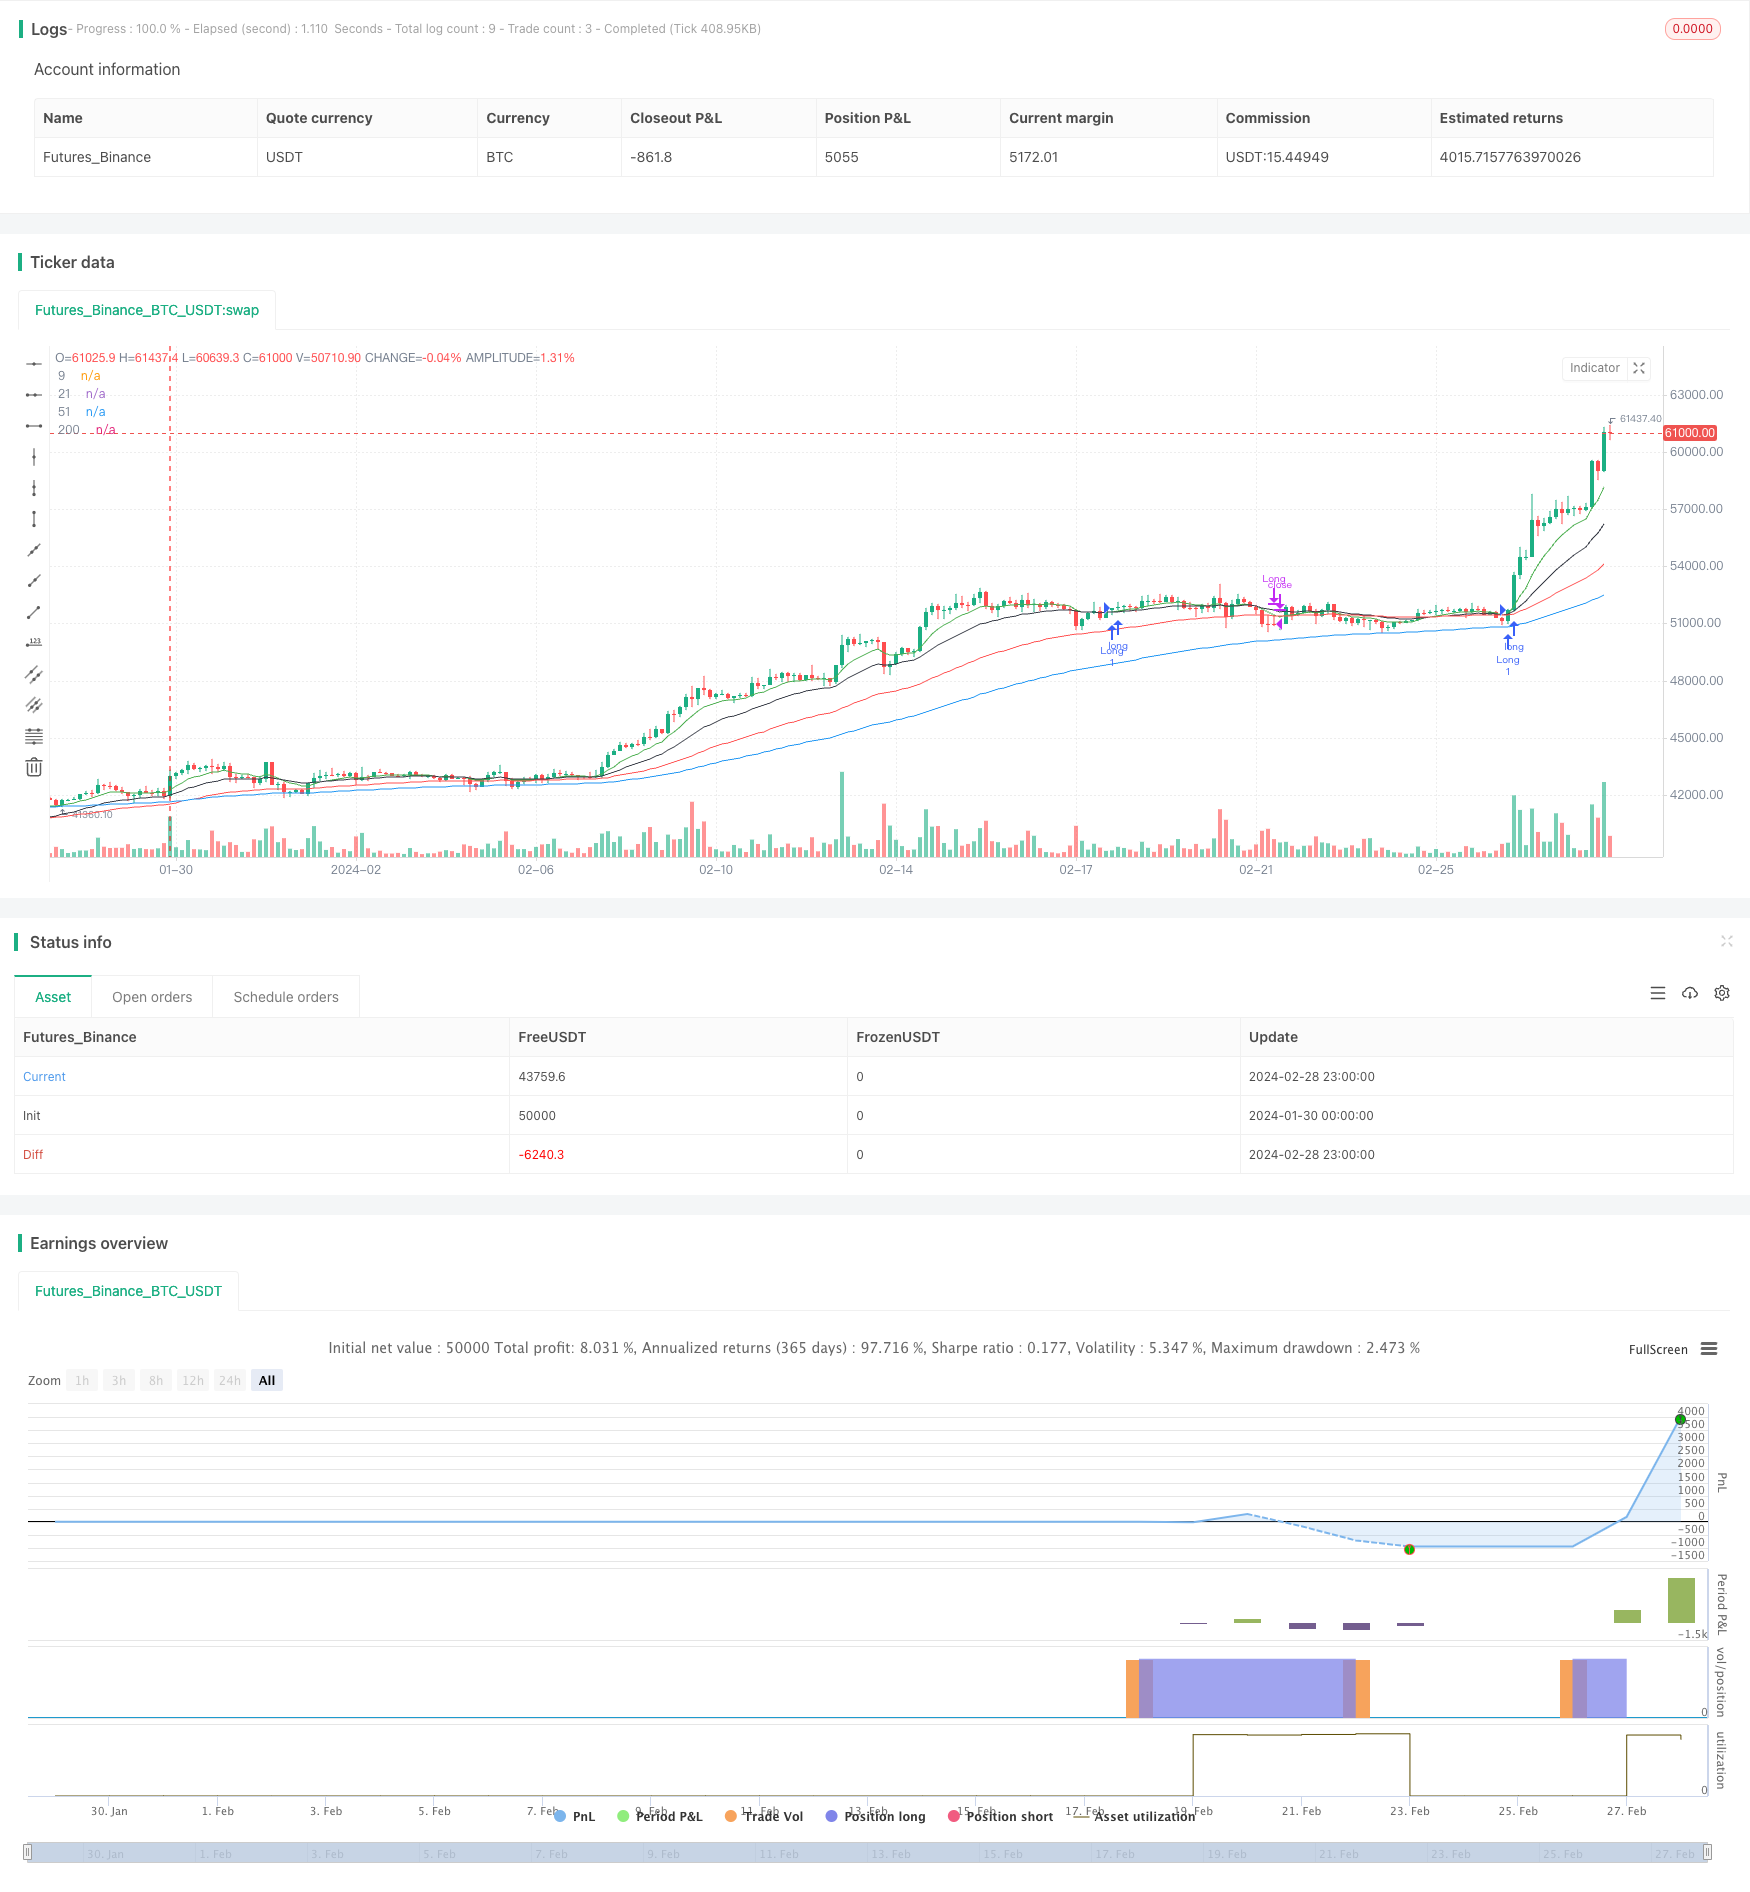
本文主要分析了Ravikant_sharma开发的基于多重指数移动平均线(EMA)和相对强弱指数(RSI)的量化交易策略。该策略通过EMA不同周期的交叉以及RSI的数值判定,识别价格趋势,确定入场和出场时机。
策略使用5条不同周期的EMA,包括9日线、21日线、51日线、100日线和200日线。代码中仅绘制了前4条EMA。RSI参数设置为14。
满足以下任一条件时,策略做多开仓:
- 9日EMA上穿21日EMA
- 9日EMA上穿51日EMA
- 51日EMA下穿100日EMA
同时需要RSI大于65,表示强势上涨趋势。
满足以下任一条件时,策略平仓退出:
- 9日EMA下穿51日EMA,表明趋势反转
- 收盘价格超过入场价格的125%,达到盈利目标
- RSI数值低于40,表明出现反转信号
- 收盘价格低于入场价格的98%,止损
这是一个典型的趋势追踪策略,具有以下优势:
- 使用EMA交叉判断趋势方向,可有效跟踪价格趋势
- 结合不同周期的EMA,可以识别更加可靠的趋势信号
- RSI过滤器可避免在震荡行情中产生错误信号
- 设定止盈止损位置,可以锁定盈利,控制风险
该策略也存在一些风险:
- 在震荡行情中可能出现多次不確定信号,导致过于频繁交易。可以适当调整EMA周期参数,或增加RSI过滤条件。
- 行情剧烈反转时,EMA交叉信号可能滞后,无法及时止损。可以结合其他指标判断做多与做空信号强度。
- 盈利目标和止损幅度設置不当,可能出现早止损或未及时止盈。应根据不同品种特性和市场环境优化参数。
该策略还可以从以下几个方向进行优化:
- 增加交易品种的参数优化,针对不同品种设定最佳参数组合
- 增加其他指标判断,如KDJ、MACD等,形成多因子模型
- 增加机器学习风控手段,利用模型判断信号质量,降低误判概率
- 结合情绪面分析,避免被极端情绪驱动产生错误交易
- 测试不同的止盈止损策略,寻找最优参数
本策略整体上是一个可靠、易于实施的趋势追踪策略。它使用EMA多周期交叉判定趋势方向,再结合RSI过滤假信号,在回测效果较好的基础上进行参数优化和模型优化,可望获得稳定收益。但交易者在使用时,仍需警惕行情反转和参数不当带来的风险。
||
This article mainly analyzes the quantitative trading strategy developed by Ravikant_sharma based on multiple exponential moving averages (EMA) and relative strength index (RSI). The strategy identifies price trends and determines entry and exit points by crossing EMAs with different cycles and values of RSI.
The strategy uses 5 EMAs with different periods, including 9-day, 21-day, 51-day, 100-day and 200-day lines. Only the first 4 EMAs are plotted in the code. The RSI parameter is set to 14.
One of the following conditions must be met before buying:
- The 9-day EMA crosses above the 21-day EMA
- The 9-day EMA crosses above the 51-day EMA
- The 51-day EMA crosses below the 100-day EMA
At the same time, RSI must be greater than 65, indicating a strong uptrend.
One of the following conditions must be met before closing the position:
- 9-day EMA crosses below 51-day EMA, indicating trend reversal
- The closing price exceeds 125% of the entry price, reaching the profit target
- RSI drops below 40, signaling reversal
- The closing price falls below 98% of the entry price, stop loss triggered
It is a typical trend following strategy with the following strengths:
- Using EMA crossovers to determine trend direction for effective trend tracking
- Combining EMAs of different periods identifies more reliable trend signals
- RSI filter avoids false signals in range-bound markets
- Take profit and stop loss settings lock in profits and control risks
There are still some risks:
- Uncertain signals may occur frequently in range-bound markets, causing over-trading. EMA periods and RSI filter conditions can be adjusted.
- EMA crossover signals may lag during sharp reversals, unable to exit in time. Other indicators can be added to determine long/short signal strength.
- Improper profit target and stop loss settings lead to premature stop loss or failure to lock in profits in time. Parameters should be optimized according to different products and market environments.
The strategy can be further optimized in the following ways:
- Parameter optimization for different products
- Adding other technical indicators to build multifactor models
- Incorporating machine learning algorithms to judge signal quality
- Combining sentiment analysis to avoid emotional pitfalls
- Testing different take profit/stop loss strategies to find optimum
In conclusion, this is an overall reliable and easy-to-implement trend following strategy. With EMA crossover for trend direction and RSI filter for false signals, good backtest results provide a solid foundation for further parameter and model optimization to obtain steady profits. However, traders should still be cautious of sharp reversals and improper parameters that pose risks.
[/trans]
Source (PineScript)
/*backtest
start: 2024-01-30 00:00:00
end: 2024-02-29 00:00:00
period: 3h
basePeriod: 15m
exchanges: [{"eid":"Futures_Binance","currency":"BTC_USDT"}]
*/

// This source code is subject to the terms of the Mozilla Public License 2.0 at https://mozilla.org/MPL/2.0/
// © Ravikant_sharma

//@version=5

strategy('new', overlay=true)

start = timestamp(1990, 1, 1, 0, 0)
end = timestamp(2043, 12, 12, 23, 59)
ema0 = ta.ema(close, 9)
ema1 = ta.ema(close, 21)
ema2 = ta.ema(close, 51)
ema3 = ta.ema(close, 100)
ema4 = ta.ema(close, 200)

rsi2=ta.rsi(ta.sma(close,14),14)
plot(ema0, '9', color.new(color.green, 0))
plot(ema1, '21', color.new(color.black, 0))
plot(ema2, '51', color.new(color.red, 0))
plot(ema3, '200', color.new(color.blue, 0))

//plot(ema4, '100', color.new(color.gray, 0))


//LongEntry = (  ta.crossover(ema0,ema3)  or  ta.crossover(ema0,ema2) or  ta.crossunder(ema2,ema3) ) // ta.crossover(ema0,ema1) //
LongEntry=false
if ta.crossover(ema0,ema1)
    if rsi2>65
        LongEntry:=true
if ta.crossover(ema1,ema2)
    if rsi2>65
        LongEntry:=true

LongExit =  ta.crossunder(ema0,ema2) or close >(strategy.position_avg_price*1.25) or rsi2 <40 or close < (strategy.position_avg_price*0.98)


if time >= start and time <= end
    if(LongEntry and rsi2>60)
        strategy.entry('Long', strategy.long, 1)
    if(LongExit)
        strategy.close('Long')
Detail
https://www.fmz.com/strategy/443251
Last Modified
2024-03-01 13:26:24