Name
基于布林带和MACD的量化交易策略Quantitative-Trading-Strategy-Based-on-Bollinger-Bands-and-MACD
Author
ChaoZhang
Strategy Description
该策略是一种基于布林带和MACD指标的量化交易策略。它融合了布林带的突破交易和MACD的趋势跟踪,旨在提高交易信号的质量。
该策略主要基于布林带指标和MACD指标进行交易信号的判断。
布林带指标由中轨、上轨和下轨组成。当价格突破下轨时生成买入信号;当价格突破上轨时生成卖出信号。该策略使用布林带的突破原理来确定较强的突破信号。
MACD指标反映了短期和长期移动平均线之间的关系,通过差值线和信号线的金叉、死叉来判断买入和卖出时机。该策略融合使用MACD指标来过滤布林带交易信号,在差值线向上突破信号线时产生更有效的买入信号。
整体而言,该策略结合布林带的趋势跟踪和MACD的移动平均线优势,旨在在强势趋势中捕捉更大的行情波动。
-
结合布林带和MACD指标,交易信号更加可靠。
-
在趋势行情中,布林带趋势跟踪和MACD移动平均线交叉可产生较强的入场信号。
-
通过双重指标判断,可有效过滤假信号,降低交易风险。
-
策略参数优化空间大,可根据不同品种和周期进行调整。
-
在震荡行情中,布林带和MACD产生的交易信号可能频繁,带来套利风险。
-
MACD指标在低位区域出现三次金叉买入信号,可能面临反转下跌风险。
-
策略使用了较多指标,参数优化和策略测试难度较大。
针对上述风险,可通过适当调整持仓时间、设置止损线、优化参数等方法来控制。
-
测试更长周期布林带参数,降低交易频率。
-
优化MACD快慢均线参数,提高指标敏感度。
-
增加其他指标过滤,如KDJ、RSI等,提升信号质量。
-
设置动态止损,自动止损退出,控制单笔交易风险。
该策略整合布林带突破交易和MACD指标过滤,在理论上可产生高质量的交易信号。通过参数优化和风险控制手段,可望获得较好的回测结果。但任何策略都无法完全避免亏损,需谨慎评估实际交易效果。
||
This strategy is a quantitative trading strategy based on Bollinger Bands and MACD indicators. It combines Bollinger Bands breakout trading and MACD trend tracking to improve the quality of trading signals.
The strategy mainly uses Bollinger Bands and MACD indicators to determine trading signals.
Bollinger Bands consist of a middle band, upper band and lower band. A buy signal is generated when the price breaks through the lower band. A sell signal is generated when the price breaks through the upper band. The strategy uses the breakout principle of Bollinger Bands to determine stronger breakout signals.
The MACD indicator reflects the relationship between short-term and long-term moving averages. It uses crossovers of the difference line and signal line to determine entry and exit points. This strategy integrates the use of MACD indicators to filter Bollinger Bands trading signals and generate more effective buy signals when the difference line crosses above the signal line.
Overall, the strategy combines the trend tracking of Bollinger Bands and the moving average advantages of MACD, aiming to capture greater market fluctuations in strong trends.
-
Combining Bollinger Bands and MACD indicators makes trading signals more reliable.
-
Bollinger Bands trend tracking and MACD moving average crossovers can produce stronger entry signals in trending markets.
-
False signals can be effectively filtered through dual indicator judgement, reducing trading risk.
-
There is great room for parameter optimization of the strategy, which can be adjusted according to different products and cycles.
-
In range-bound markets, trading signals generated by Bollinger Bands and MACD may be frequent, bringing risks of over-trading.
-
Three successive MACD golden crosses at low levels may face the risk of a downward reversal.
-
The strategy uses multiple indicators, making parameter optimization and strategy testing quite difficult.
To address these risks, methods like adjusting holding periods, setting stop losses, optimizing parameters can be used to control them.
-
Test longer period Bollinger Bands parameters to reduce trading frequency.
-
Optimize MACD fast and slow line parameters to improve indicator sensitivity.
-
Add other indicators for filtering, like KDJ, RSI etc, to improve signal quality.
-
Set dynamic stops to automatically exit trades and control single trade risks.
In theory, by integrating Bollinger Bands breakout trading and MACD indicator filtering, this strategy can produce high quality trading signals. Through parameter optimization and risk control measures, good backtest results may be achieved. However, no strategy can completely avoid losses. The actual trading performance needs prudent assessment.
[/trans]
Strategy Arguments
| Argument | Default | Description |
|---|---|---|
| v_input_1 | 6 | RSI Period Length |
| v_input_int_1 | 200 | Bollinger Period Length |
| v_input_2 | 12 | fastLength |
| v_input_3 | 26 | slowlength |
| v_input_4 | 9 | MACDLength |
| v_input_5 | true | Enable Bar Color? |
| v_input_6 | true | Enable Background Color? |
Source (PineScript)
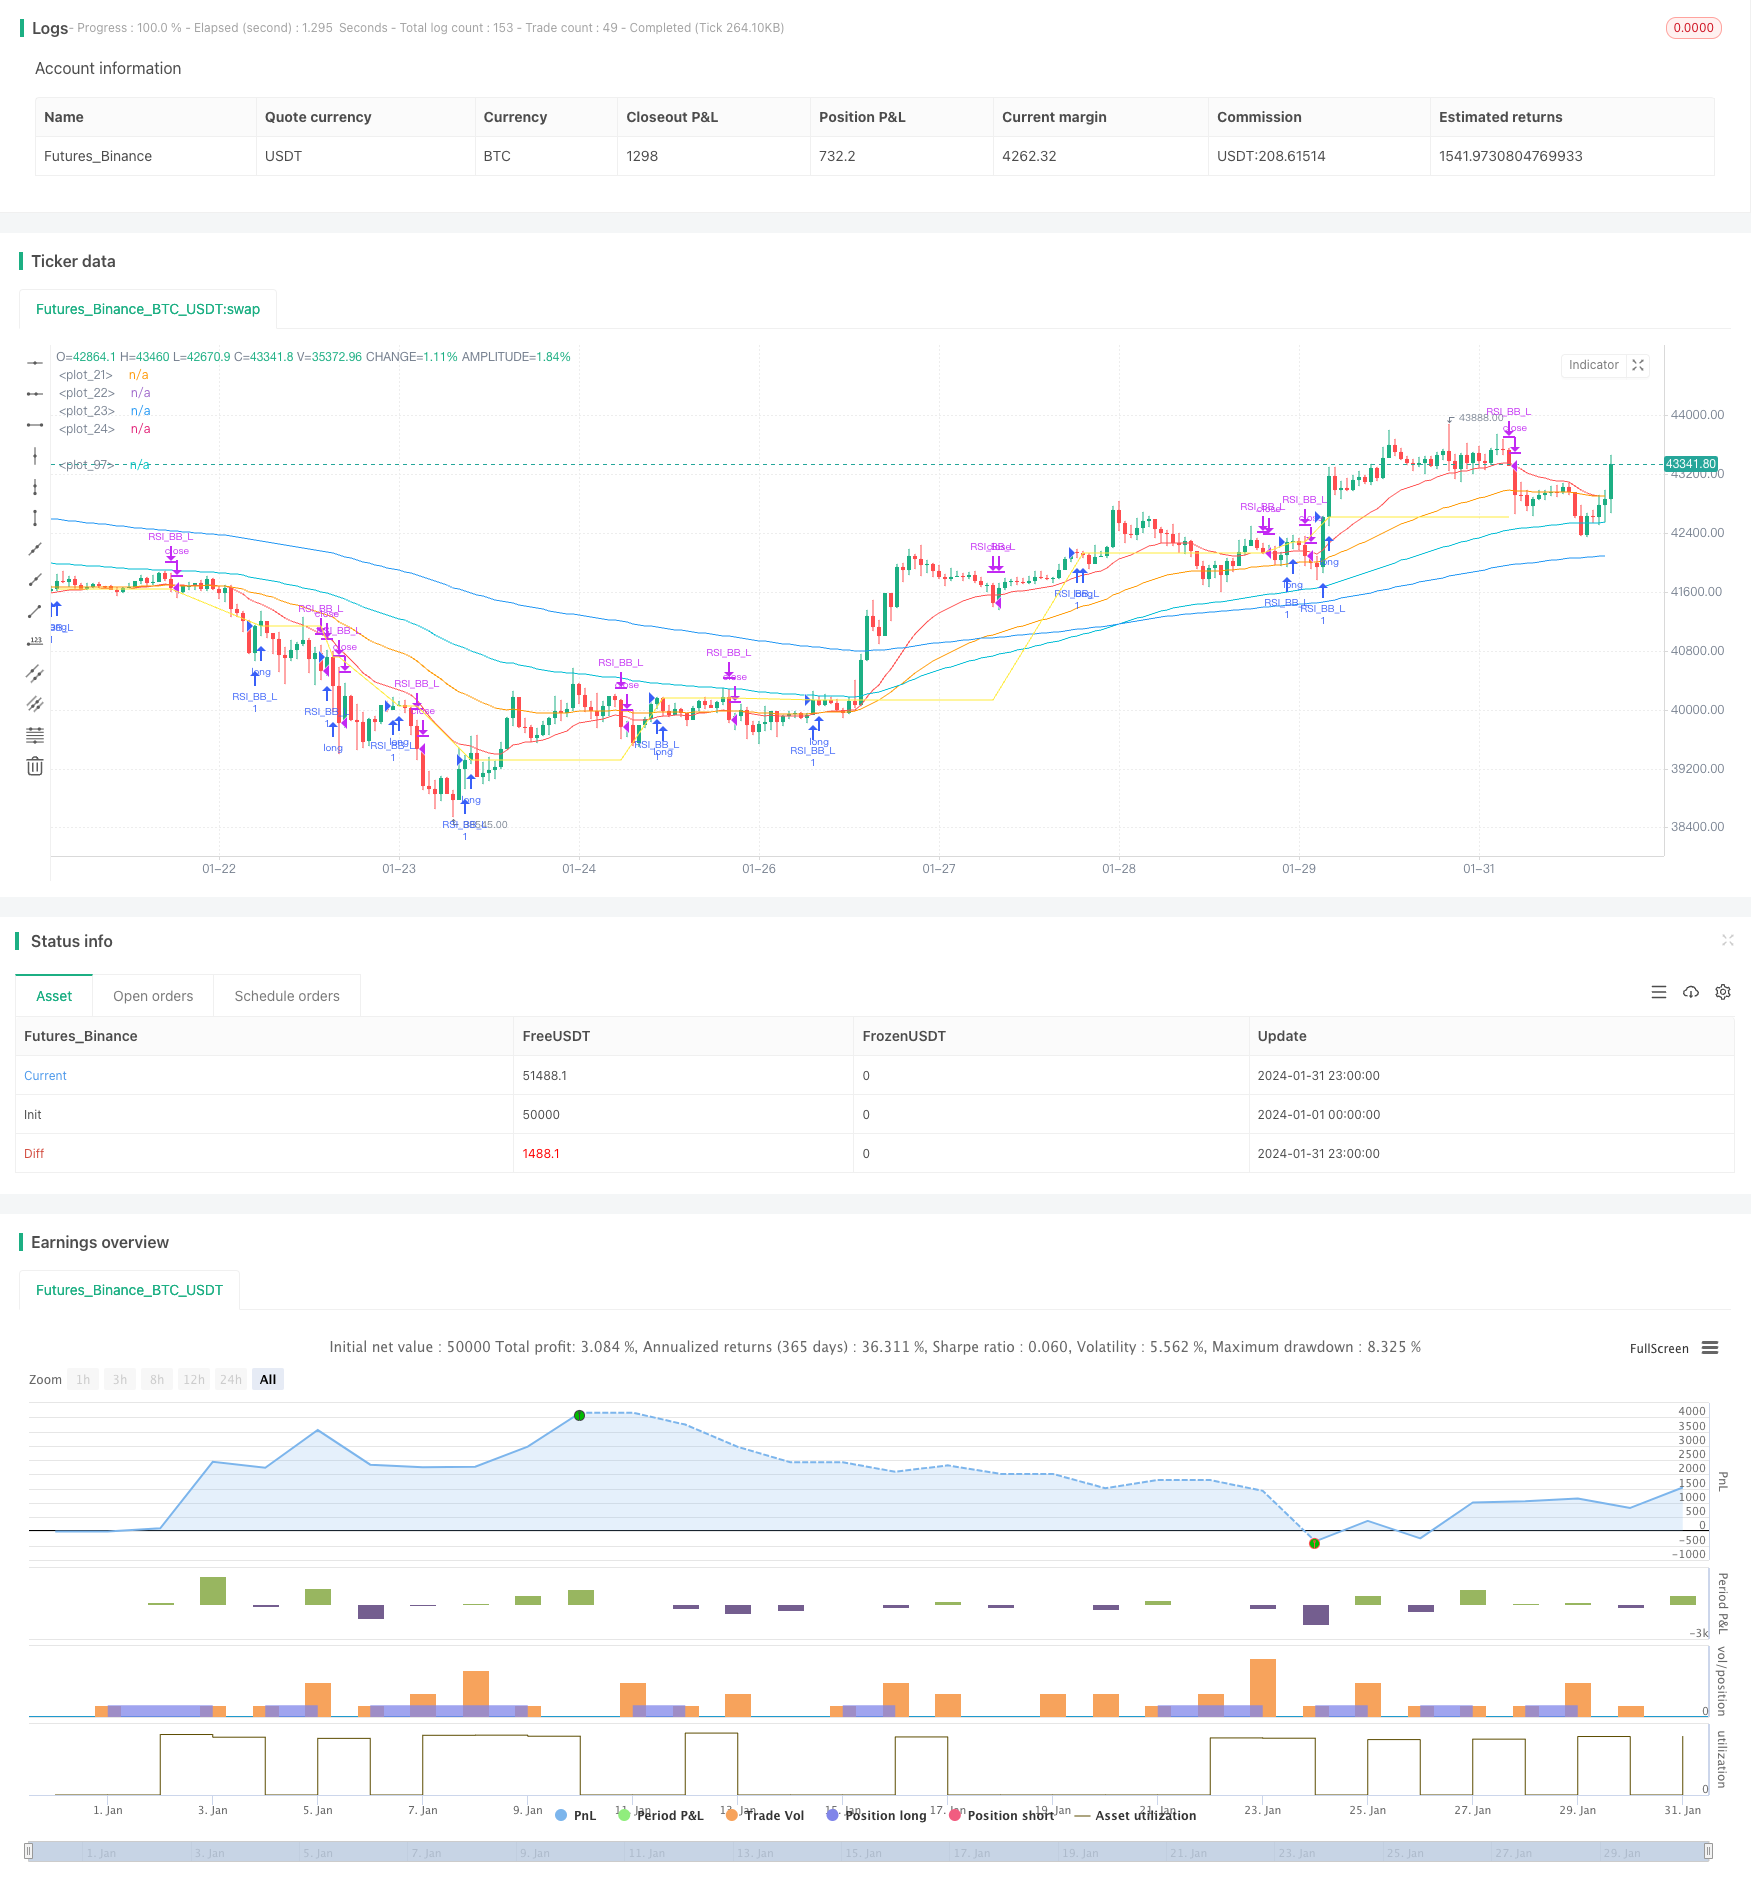
/*backtest
start: 2024-01-01 00:00:00
end: 2024-01-31 23:59:59
period: 1h
basePeriod: 15m
exchanges: [{"eid":"Futures_Binance","currency":"BTC_USDT"}]
*/

//@version=5
strategy("Nabz-BBMACD-2022-V1.1", shorttitle="BBM-Nabz", overlay=true)


// My 1st Pine Scrpt Indicator
// Work on best on 1Hr Chart
// Open for Help/Donations.


var float lastentry=1
int result = 0
float x = 0
drawshape = false

/////////////EMA
shortest = ta.ema(close, 20)
short = ta.ema(close, 50)
longer = ta.ema(close, 100)
longest = ta.ema(close, 200)

plot(shortest, color = color.red)
plot(short, color = color.orange)
plot(longer, color = color.aqua)
plot(longest, color = color.blue)

///////////// RSI
RSIlength = input(6,title="RSI Period Length")
RSIoverSold = 50
RSIoverBought = 50
price = close
vrsi = ta.rsi(price, RSIlength)


///////////// Bollinger Bands
BBlength = input.int(200, minval=1,title="Bollinger Period Length")
BBmult = 2 // input(2.0, minval=0.001, maxval=50,title="Bollinger Bands Standard Deviation")
BBbasis = ta.sma(price, BBlength)
BBdev = BBmult * ta.stdev(price, BBlength)
BBupper = BBbasis + BBdev
BBlower = BBbasis - BBdev
source = close
buyEntry = ta.crossover(source, BBlower)
sellEntry = ta.crossunder(source, BBupper)


////////////// MACD
fastLength = input(12)
slowlength = input(26)
MACDLength = input(9)
MACD = ta.ema(close, fastLength) - ta.ema(close, slowlength)
aMACD = ta.ema(MACD, MACDLength)
delta = MACD - aMACD


///////////// Colors
switch1=input(true, title="Enable Bar Color?")
switch2=input(true, title="Enable Background Color?")
TrendColor = RSIoverBought and (price[1] > BBupper and price < BBupper) and BBbasis < BBbasis[1] ? color.red : RSIoverSold and (price[1] < BBlower and price > BBlower) and BBbasis > BBbasis[1] ? color.green : na


///////////Strategy

bool tcu = not (ta.crossunder(price[0],shortest[0]))


if (((price[1]<BBlower[1]) and (ta.crossover(price,BBlower))))
    lastentry := low[1]
    strategy.entry("RSI_BB_L", strategy.long, comment="Buy 1st IF")

if (((ta.crossover(delta, 0.0) and (ta.crossover(price,BBlower)))))
    lastentry := low[1]
    strategy.entry("RSI_BB_L", strategy.long, comment="Buy 2nd IF")

if (((ta.crossover(delta, 0.0)) and (low[0]>shortest[0])) and (price[1]<low))
    lastentry := low[1]
    strategy.entry("RSI_BB_L", strategy.long, comment="Buy 3rd IF")   //else

if (((ta.crossover(delta, 0.01)) and (high[1]<BBupper)) and (tcu))
    lastentry := low[1]
    strategy.entry("RSI_BB_L", strategy.long, comment="Buy 4th IF")


if ((ta.crossunder(low[0],shortest[0]) and close<shortest))
    strategy.close(id="RSI_BB_L", comment="Close by 1st IF")


if (price<lastentry)
    drawshape := true

if (price<strategy.opentrades.entry_price(0)/1.01175734321249)
    strategy.close(id="RSI_BB_L", comment="Close by 2nd IF")


plot(strategy.opentrades.entry_price(0), color=color.yellow)
Detail
https://www.fmz.com/strategy/442643
Last Modified
2024-02-23 14:30:30