Name
基于布林带和RSI的趋势追踪策略Bollinger-Bands-and-RSI-Trend-Following-Strategy
Author
ChaoZhang
Strategy Description
[trans]
该策略综合利用布林带、RSI指标以及200期移动平均线来识别趋势方向,在趋势方向合适时,在布林带上下轨附近进行反转交易,从而获利。
首先,使用200期移动平均线判断大致趋势方向,价格在上时定义为多头趋势,价格在下时定义为空头趋势。其次,当处于多头趋势时,如果RSI指标显示过卖并接近布林带下轨时,执行买入操作;当处于空头趋势时,如果RSI指标显示过买并接近布林带上轨时,执行卖出操作。最后,使用ATR指标设置止损位,目标盈利为止损位的2倍。
该策略最大的优势在于综合运用多个指标判断趋势方向和交易时机。首先,200日移动平均线能够有效判断大趋势方向。其次,布林带上下轨能够显示价格可能反转的区域。最后,RSI指标显示了价格可能反转的时机。多重指标的运用避免了单一指标判断失误的风险。
该策略主要风险在于大趋势判断错误以及反转信号发出错误。如果大趋势判断错误,很可能导致不断损失;如果反转信号发出错误,止损被触发的几率会比较大。此外,反转htrading本身就具有较高风险,需要谨慎操作。
为规避上述风险,建议适当调整移动平均线参数,或增加其他指标进行确认,从而提高判断准确性。此外建议适当放宽止损幅度,避免止损过于容易触发。
该策略优化空间较大,可从以下几个方面入手:第一,调整移动平均线参数,优化判断大趋势的准确性。第二,调整布林带参数或增加卡尔曼通道,以提高价格反转区域判断的效果。第三,增加 MACD 等其他指标进行反转确认,减少错误信号。第四,优化止损比例设置,降低实际止损被触发概率。
本策略综合运用布林带、RSI 指标与移动平均线判断趋势和交易时机,实现了较好的效果。但仍需进一步优化参数设置及风险管理,以提高稳定盈利能力。总体而言,该策略思路清晰、易于实现,值得进一步研究与应用。
||
This strategy utilizes Bollinger Bands, RSI indicator and 200-period moving average to identify trend direction and enter counter-trend trades near the Bollinger Bands when the trend direction is appropriate, in order to make profits.
Firstly, the 200-period moving average is used to determine the overall trend direction. An uptrend is defined when the price is above the moving average, and a downtrend is defined when the price is below. Secondly, when in an uptrend, a long entry is executed if the RSI indicator shows oversold and gets close to the Bollinger Lower Band; when in a downtrend, a short entry is executed if the RSI shows overbought and gets close to the Bollinger Upper Band. Finally, the ATR indicator is used to set stop loss level, and the take profit is set to be 2 times of the stop loss.
The biggest advantage of this strategy is that it combines multiple indicators to determine trend direction and timing of entries. Firstly, the 200-day moving average can effectively identify the major trend. Secondly, the Upper/Lower Bands of Bollinger Bands indicate areas where prices may reverse. Finally, the RSI suggests possible reversal timing. The use of multiple indicators avoids the risk of misjudgment from a single one.
The main risks of this strategy come from inaccurate identification of major trends and reversal signals. If the trend is misjudged, it may lead to consecutive losses. If reversal signals are wrong, the chance of stop loss being triggered would be high. Also, counter-trend trading itself has higher risks that require cautious operation.
To mitigate the above risks, it is advisable to adjust the parameters of the moving average or add other indicators for confirmation, in order to improve accuracy. Also the stop loss level can be loosened to prevent it being triggered too easily.
There is large room for optimizing this strategy: first, adjust the parameters of the moving average to improve accuracy of trend identification. Second, tune parameters of Bollinger Bands or add Kalman Channels to better locate reversal zones. Third, add other indicators like MACD for confirmation to avoid wrong signals. Fourth, optimize the stop loss ratio setting to lower the chance of actual stop loss events.
This strategy combines Bollinger Bands, RSI and Moving Averages to determine trends and timing, and has achieved good results. But further optimization on parameter tuning and risk control is needed to improve profit stability. Overall, with clear logic and easy implementation, it is worth further research and application.
[/trans]
Strategy Arguments
| Argument | Default | Description |
|---|---|---|
| v_input_1 | 3 | lookback length of RSI |
| v_input_2 | 70 | RSI OB |
| v_input_3 | 30 | RSI OS |
| v_input_4 | 20 | Bollinger Period Length |
| v_input_5 | 2 | Bollinger Bands Standard Deviation |
| v_input_6 | 200 | emaLength |
Source (PineScript)
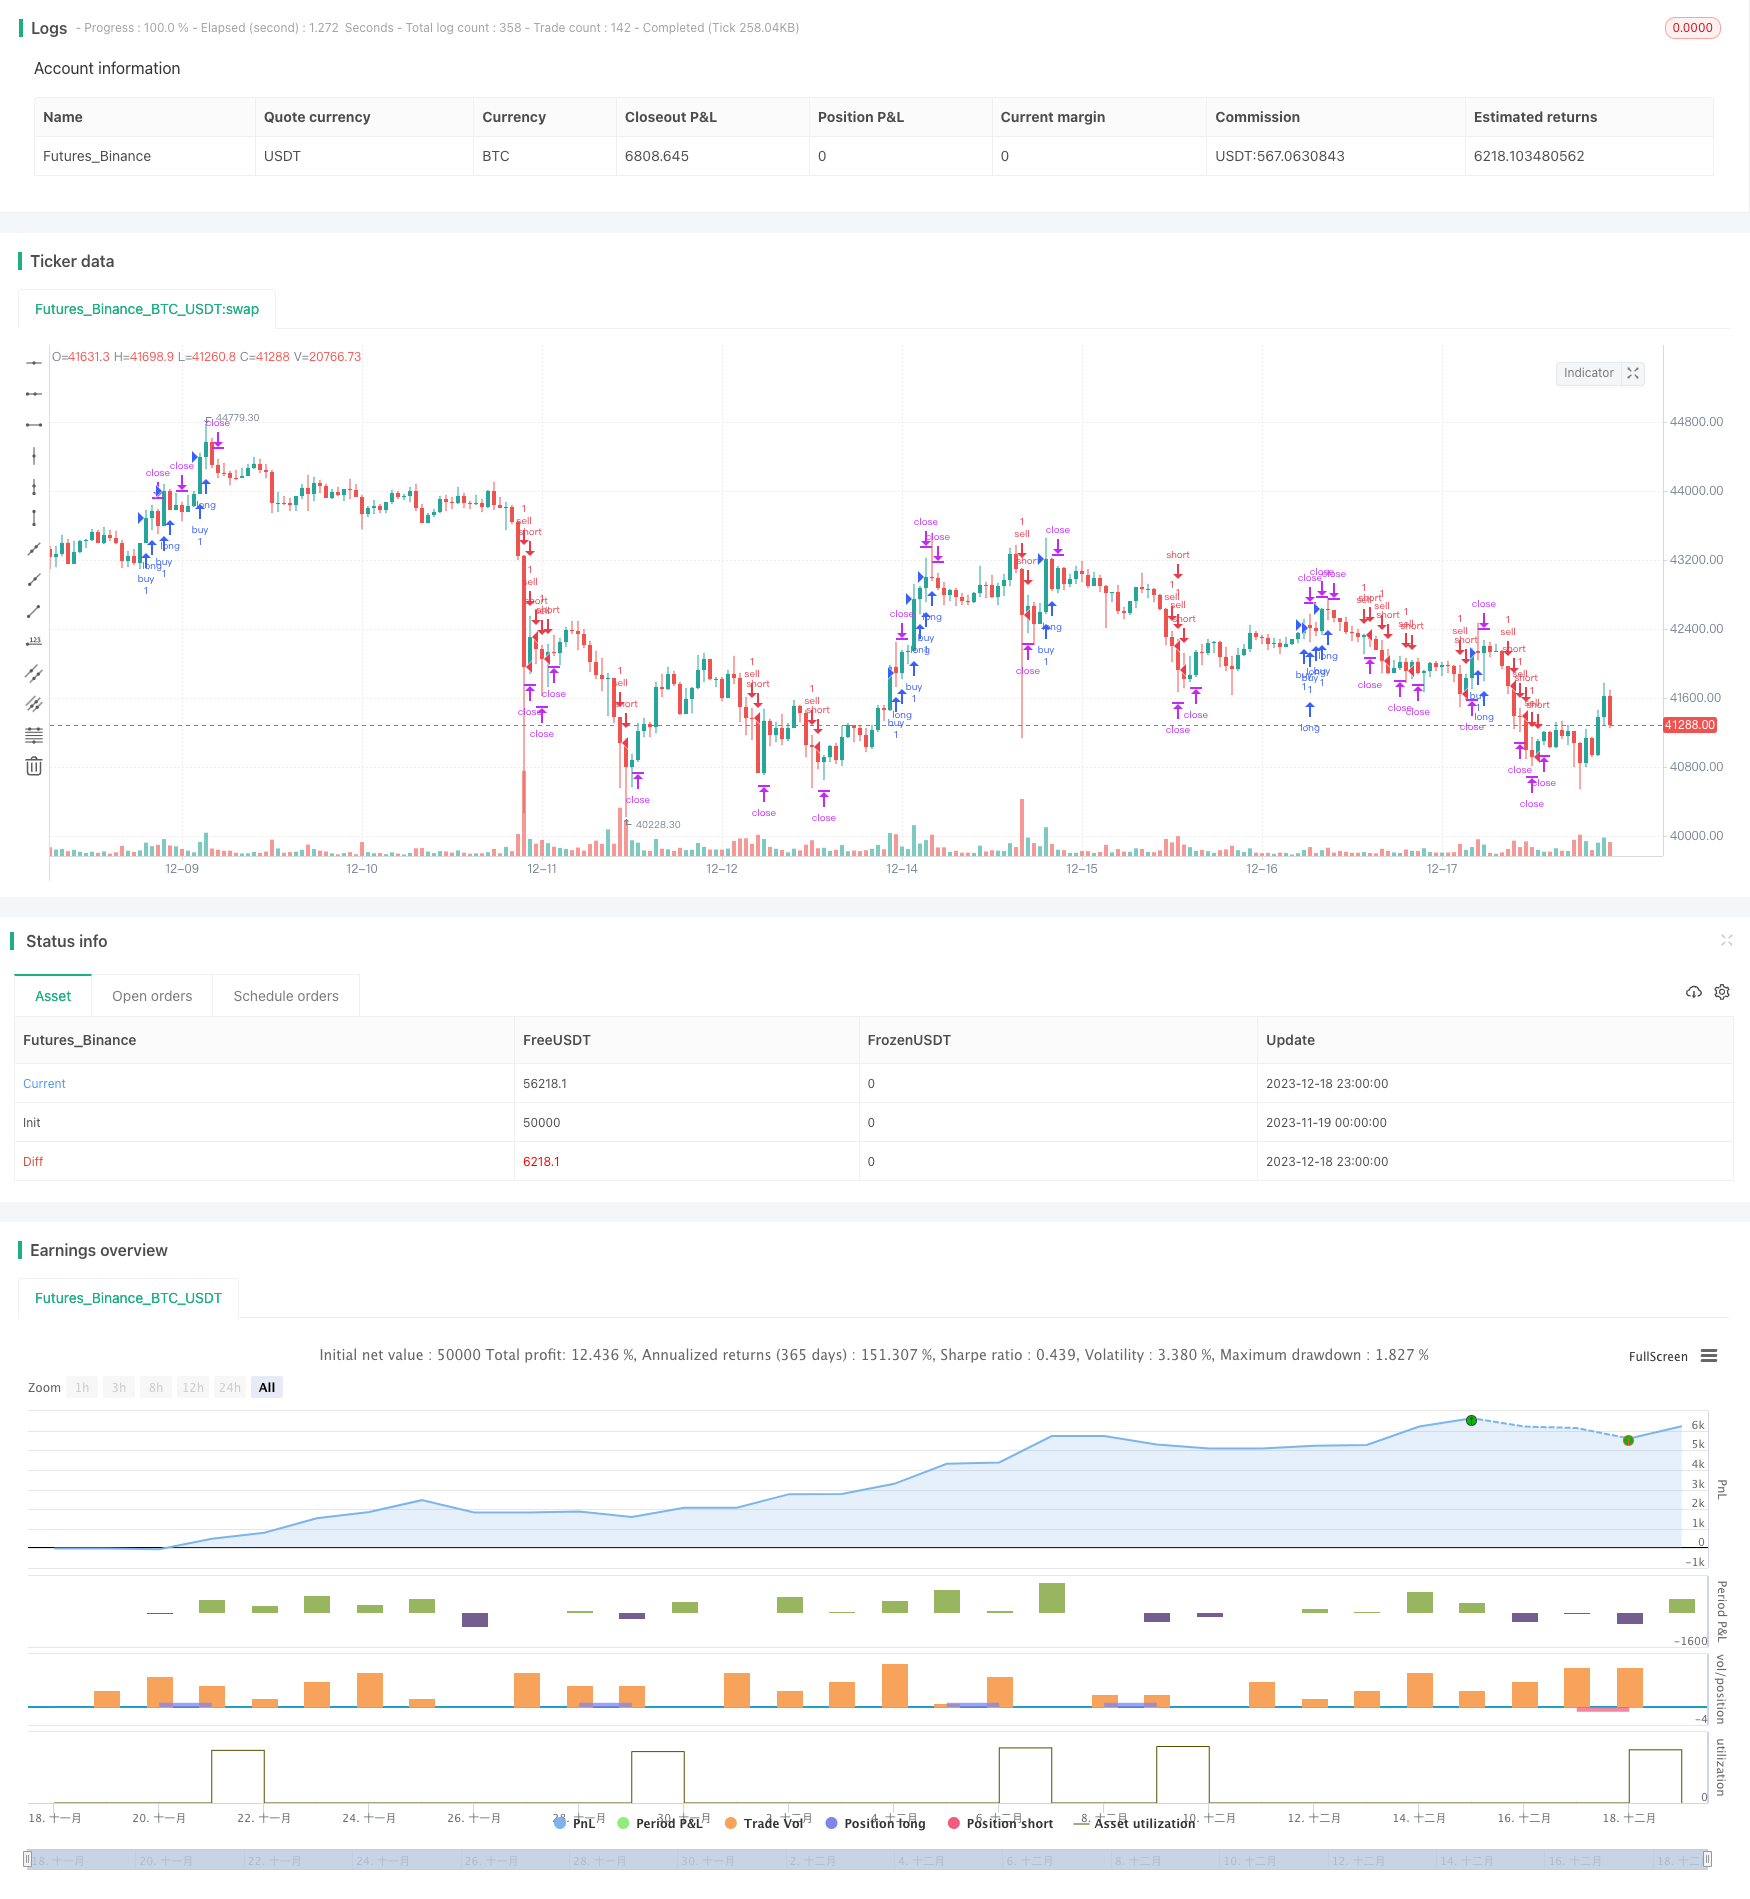
/*backtest
start: 2023-11-19 00:00:00
end: 2023-12-19 00:00:00
period: 1h
basePeriod: 15m
exchanges: [{"eid":"Futures_Binance","currency":"BTC_USDT"}]
*/

//@version=4
strategy("Gab EMA + rsi + bb", overlay=true)
// Custom RSI
RSIlength = input(3, minval=1 , title="lookback length of RSI")
RSIOverBought = input(70, title="RSI OB")
RSIOverSold = input(30, title="RSI OS")
RSIprice = close
vrsi = rsi(RSIprice, RSIlength)


//Bollinger Bands
BBlength = input(20, minval=1,title="Bollinger Period Length")
BBmult = input(2.0, minval=0.001, maxval=50, title="Bollinger Bands Standard Deviation")
BBbasis = sma(close, BBlength)
BBdev = BBmult * stdev(close, BBlength)
BBupper = BBbasis + BBdev
BBlower = BBbasis - BBdev
source = close

//EMA
emaLength=input(200)

//Set TP and SL values
sl_short = high + (syminfo.mintick * 5 * 10)
tp_short = low - (syminfo.mintick * 10 * 10)
sl_long = low - (syminfo.mintick * 5 * 10)
tp_long = high + (syminfo.mintick * 10 * 10)


//Strategy Entry and Exit
strategy.entry("sell", strategy.short, when = low < ema(low, emaLength) and vrsi < RSIOverSold and low < BBlower and barstate.isconfirmed)
strategy.exit("closeshort", from_entry="sell", limit=tp_short, stop=sl_short, when=strategy.position_size != 0)

strategy.entry("buy", strategy.long, when = high > ema(high, emaLength) and vrsi > RSIOverBought and high > BBupper and barstate.isconfirmed)
strategy.exit("closelong", from_entry="buy", limit=tp_long, stop=sl_long, when=strategy.position_size != 0)
Detail
https://www.fmz.com/strategy/435964
Last Modified
2023-12-20 14:32:40