Name
基于布林带的价格行为策略Bollinger-Band-based-Price-Action-Strategy
Author
ChaoZhang
Strategy Description
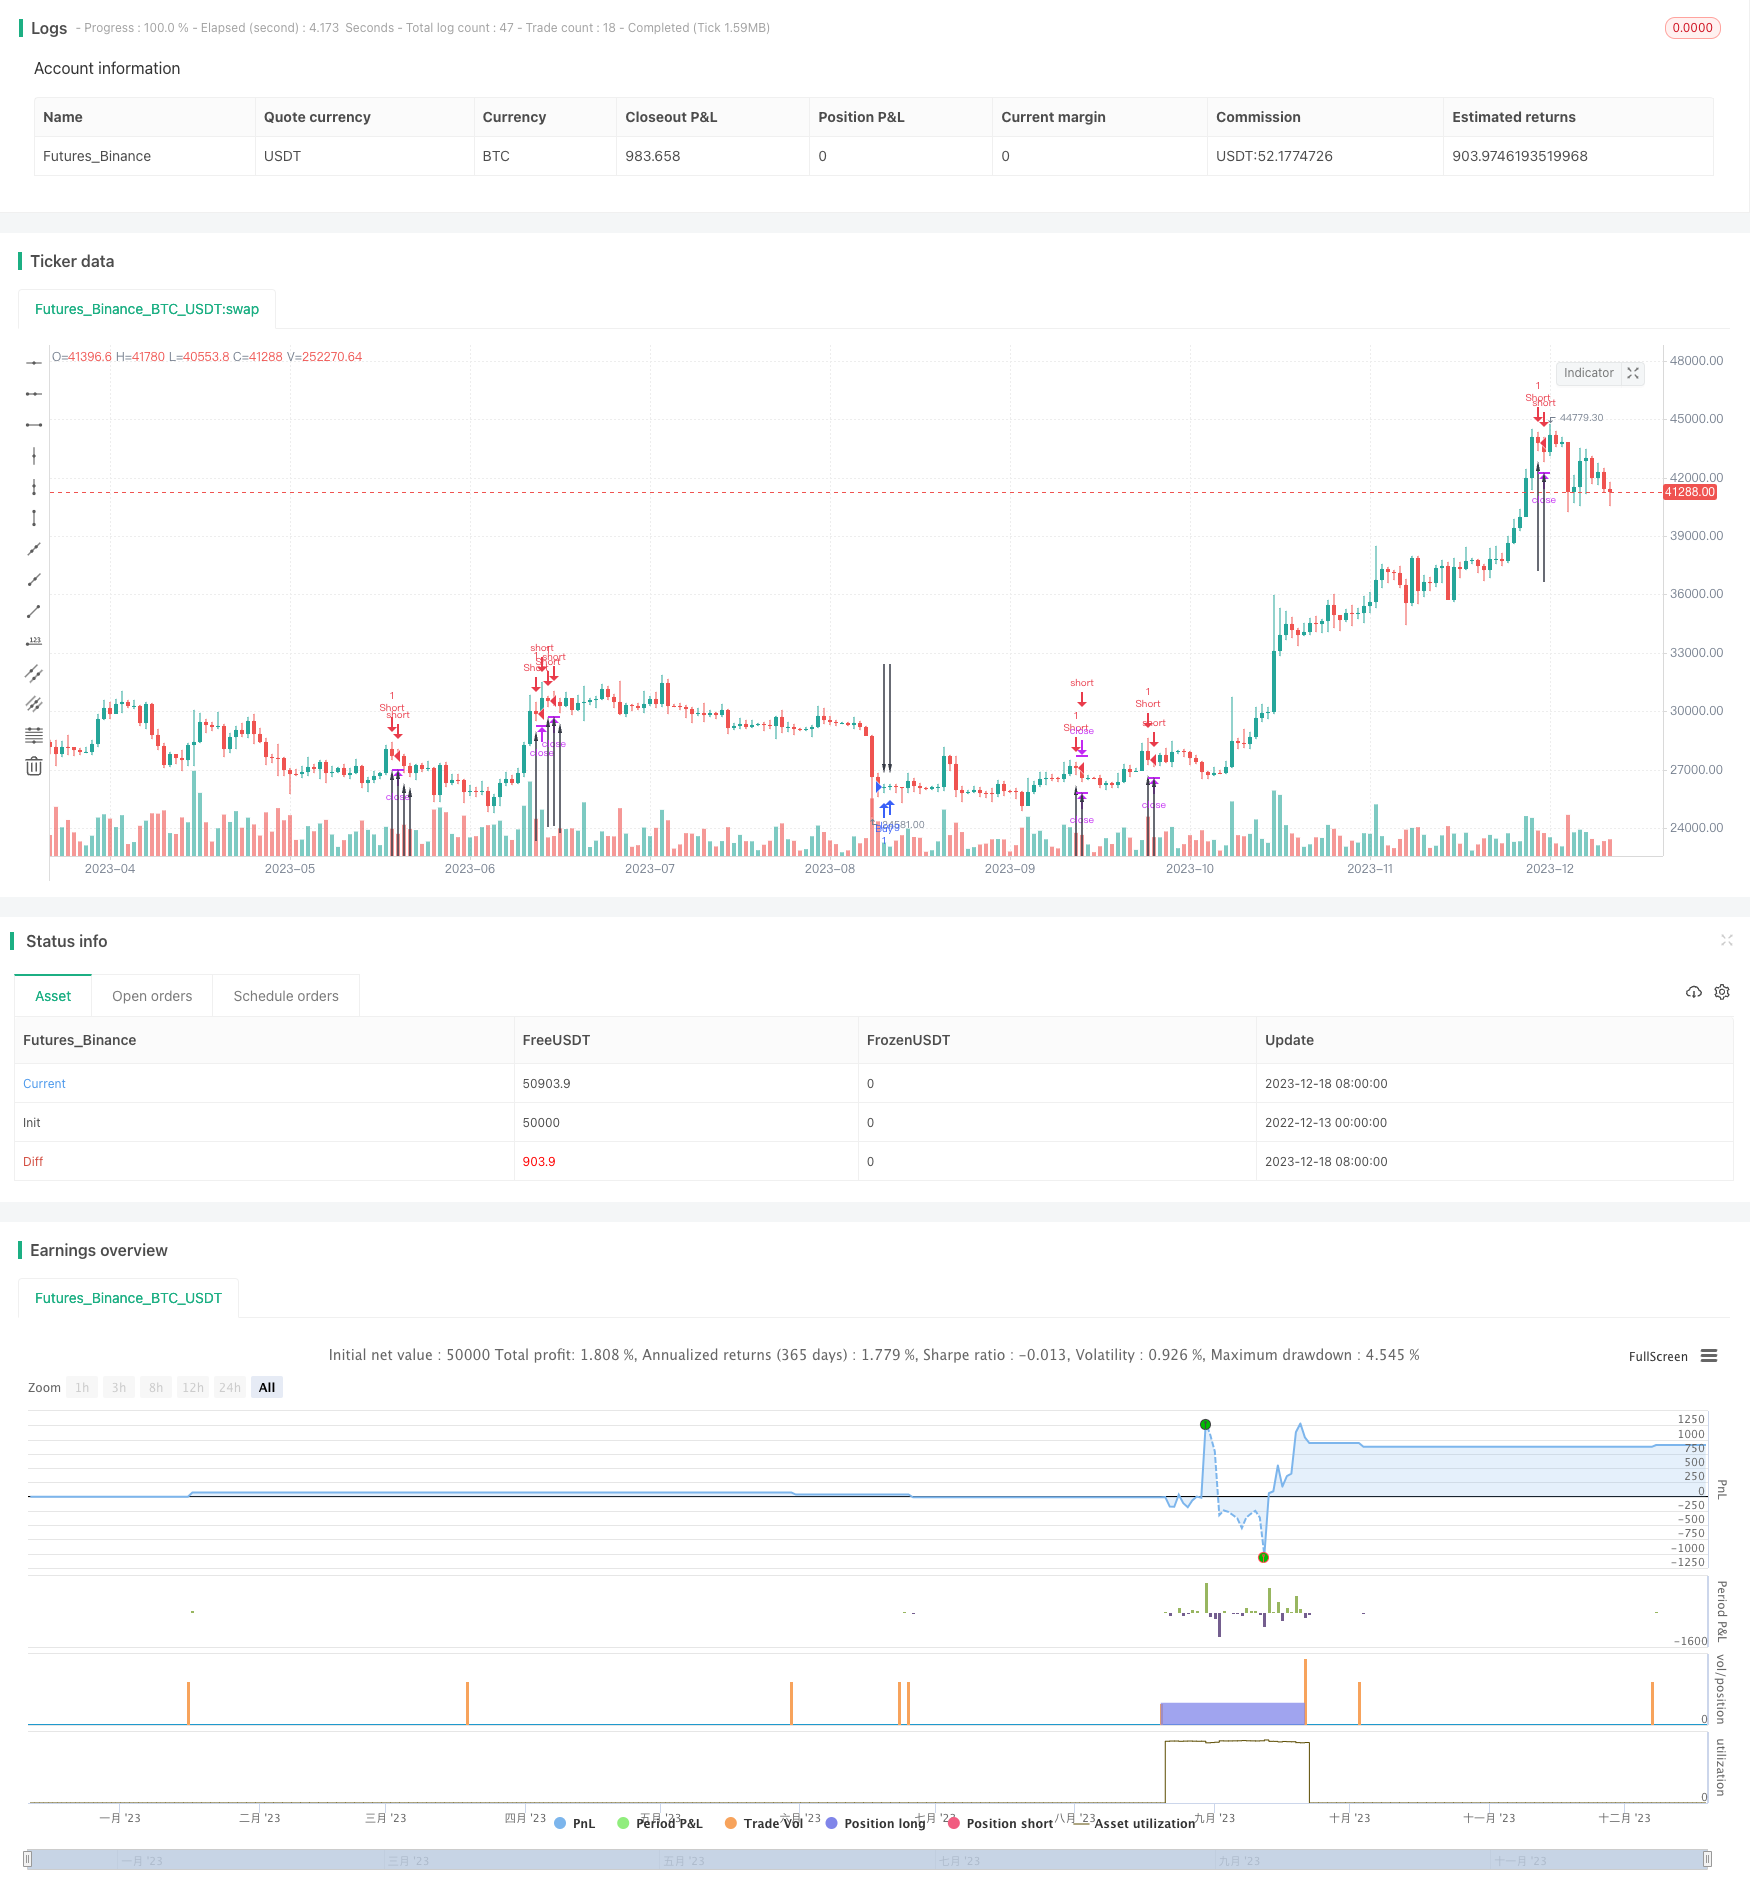
本策略的名称为“基于布林带的价格行为策略”。它整合了价格行为分析和布林带指标,利用复合条件判断来产生交易信号。
该策略首先计算布林带的上下轨,然后判断最后一根K线是否突破布林带上下轨。同时,还会判断最后一根K线的实体是否只有前一根K线实体的一半。当满足这两个条件时,即发出交易信号。
具体来说,策略利用下跌行情中红色K线实体变小达到仅前一根K线实体一半的情况,并配合最后一根K线收盘价突破布林带下轨作为做多信号。反之,利用上涨行情中绿色K线实体变小达到仅前一根K线实体一半的情况,并配合最后一根K线收盘价突破布林带上轨作为做空信号。
该策略结合了技术指标和价格行为判断,可以有效过滤假突破。同时,它只在趋势反转点发出信号,避免在趋势中反复交易。此外,策略利用K线实体变小的特征,可以锁定微小调整后的趋势反转点位。这些优势可以提高策略的稳定性和盈利率。
该策略主要的风险在于布林带参数设置不当和突破失败。如果布林带参数设置过大或过小都会导致误判。此外,即使价格突破布林带上下轨,也可能是假突破,无法形成真正的趋势反转。这些风险都可能导致策略交易亏损。为减少这些风险,可以适当调整布林带参数,或者增加其他指标进行组合验证。
本策略可以从以下几个方面进行优化:
-
优化布林带参数,使其更有效地捕捉趋势和波动。
-
增加移动止损来锁定利润,管理风险。
-
结合其他指标如MACD、RSI等进行验证,过滤假信号。
-
增加机器学习算法,利用大数据训练模型,使策略参数和指标权重动态优化。
本策略成功结合价格行为和布林带指标,在低风险的情况下获得较高的盈利率。它只在关键点位发出信号,避免 noises 的干扰。通过持续优化参数与过滤条件,本策略有望获取更稳定的超额收益。它为量化交易实践提供了一个可靠的模板。
||
The name of this strategy is “Bollinger Band-based Price Action Strategy”. It integrates price action analysis and Bollinger Bands to generate trading signals based on compound condition judging.
This strategy first calculates the upper and lower rails of Bollinger Bands, and then judges whether the last K-line breaks through the upper or lower rails. At the same time, it also judges whether the entity of the last K-line is only half of the previous K-line entity. When both conditions are met, a trading signal is issued.
Specifically, the strategy utilizes the situation where red K-line entities become smaller, reaching only half of the previous K-line entity during a downward trend, together with the last K-line's closing price breaking through the Bollinger Band lower rail as a buy signal. On the contrary, it utilizes the situation where green K-line entities become smaller, reaching only half of the previous K-line entity during an upward trend, together with the last K-line's closing price breaking through the Bollinger Band upper rail as a sell signal.
This strategy combines technical indicators and price behavior analysis, which can effectively filter false breakouts. At the same time, it only issues signals at inflection points, avoiding repetitive trading during trends. In addition, the strategy utilizes the characteristics of K-line entity contraction to lock the inflection point after a minor adjustment. These advantages can improve the stability and profitability of the strategy.
The main risks of this strategy lie in the improper parameter settings of Bollinger Bands and breakout failures. If the parameters of Bollinger Bands are set too large or too small, misjudgments will occur. In addition, even if the price breaks through the upper or lower rails of Bollinger Bands, it may be a false breakout and fail to form a real trend reversal. These risks can all lead to trading losses of the strategy. To reduce these risks, parameters of Bollinger Bands can be adjusted accordingly, or other indicators can be added for combination verification.
This strategy can be optimized in the following aspects:
-
Optimize Bollinger Band parameters to capture trends and fluctuations more effectively.
-
Add moving stop loss to lock in profits and manage risks.
-
Incorporate other indicators such as MACD, RSI for verification to filter false signals.
-
Add machine learning algorithms, train models with big data, and dynamically optimize strategy parameters and indicator weights.
This strategy successfully combines price action and Bollinger Bands, obtaining relatively high profitability with low risk. It only issues signals at key points, avoiding interference from noises. Through continuous optimization of parameters and filtering criteria, this strategy is expected to obtain more steady alpha. It provides a reliable template for quantitative trading practice.
[/trans]
Strategy Arguments
| Argument | Default | Description |
|---|---|---|
| v_input_1 | 21 | SMA candle |
Source (PineScript)
/*backtest
start: 2022-12-13 00:00:00
end: 2023-12-19 00:00:00
period: 1d
basePeriod: 1h
exchanges: [{"eid":"Futures_Binance","currency":"BTC_USDT"}]
*/

//@version=4
// main codebody taken from Trader Noro - Noro's Crypto Pattern for H1
// Intraday strategy- Exit at EOD at all cost

strategy(title = "Price Action + Bollinger Strategy ",overlay=true)
bar = close > open ? 1 : close < open ? -1 : 0
body = abs(close - open)
avgbody = sma(body, 100)

//calculate simple moving average bollinger bands
b_sma = input(21,minval=1,title=" SMA candle")
b_sma_no_of_deviations = 2.1
b_sma_signal = sma(close, b_sma)
b_sma_deviation = b_sma_no_of_deviations * stdev(close, b_sma)
b_sma_upper= b_sma_signal + b_sma_deviation
b_sma_lower= b_sma_signal - b_sma_deviation

up1 = body < body[1] / 2 and bar[1]==1 and bar == -1 and close[1] > b_sma_upper
dn1 = body < body[1] / 2 and bar[1]==-1 and bar == 1 and close[1] < b_sma_lower
up2 = false
dn2 = false
up2 := (up1[1] or up2[1]) and close < close[1]
dn2 := (dn1[1] or dn2[1]) and close > close[1]
plotarrow(up1 or up2 ? 1 : na, colorup = color.black, colordown = color.black, transp = 0)
plotarrow(dn1 or dn2 ? -1 : na, colorup = color.black, colordown = color.black, transp = 0)

strategy.entry("Buy", true, when = dn1)
strategy.exit("exit", "Buy", profit = 3, loss = 1.5)

strategy.entry("Short", false, when = up1)
strategy.exit("exit", "Short", profit = 3, loss = 1.5)
Detail
https://www.fmz.com/strategy/435957
Last Modified
2023-12-20 14:03:52