Name
基于布林带的智能追踪交易策略Bollinger-Bands-Based-Intelligent-Tracking-Trading-Strategy
Author
ChaoZhang
Strategy Description
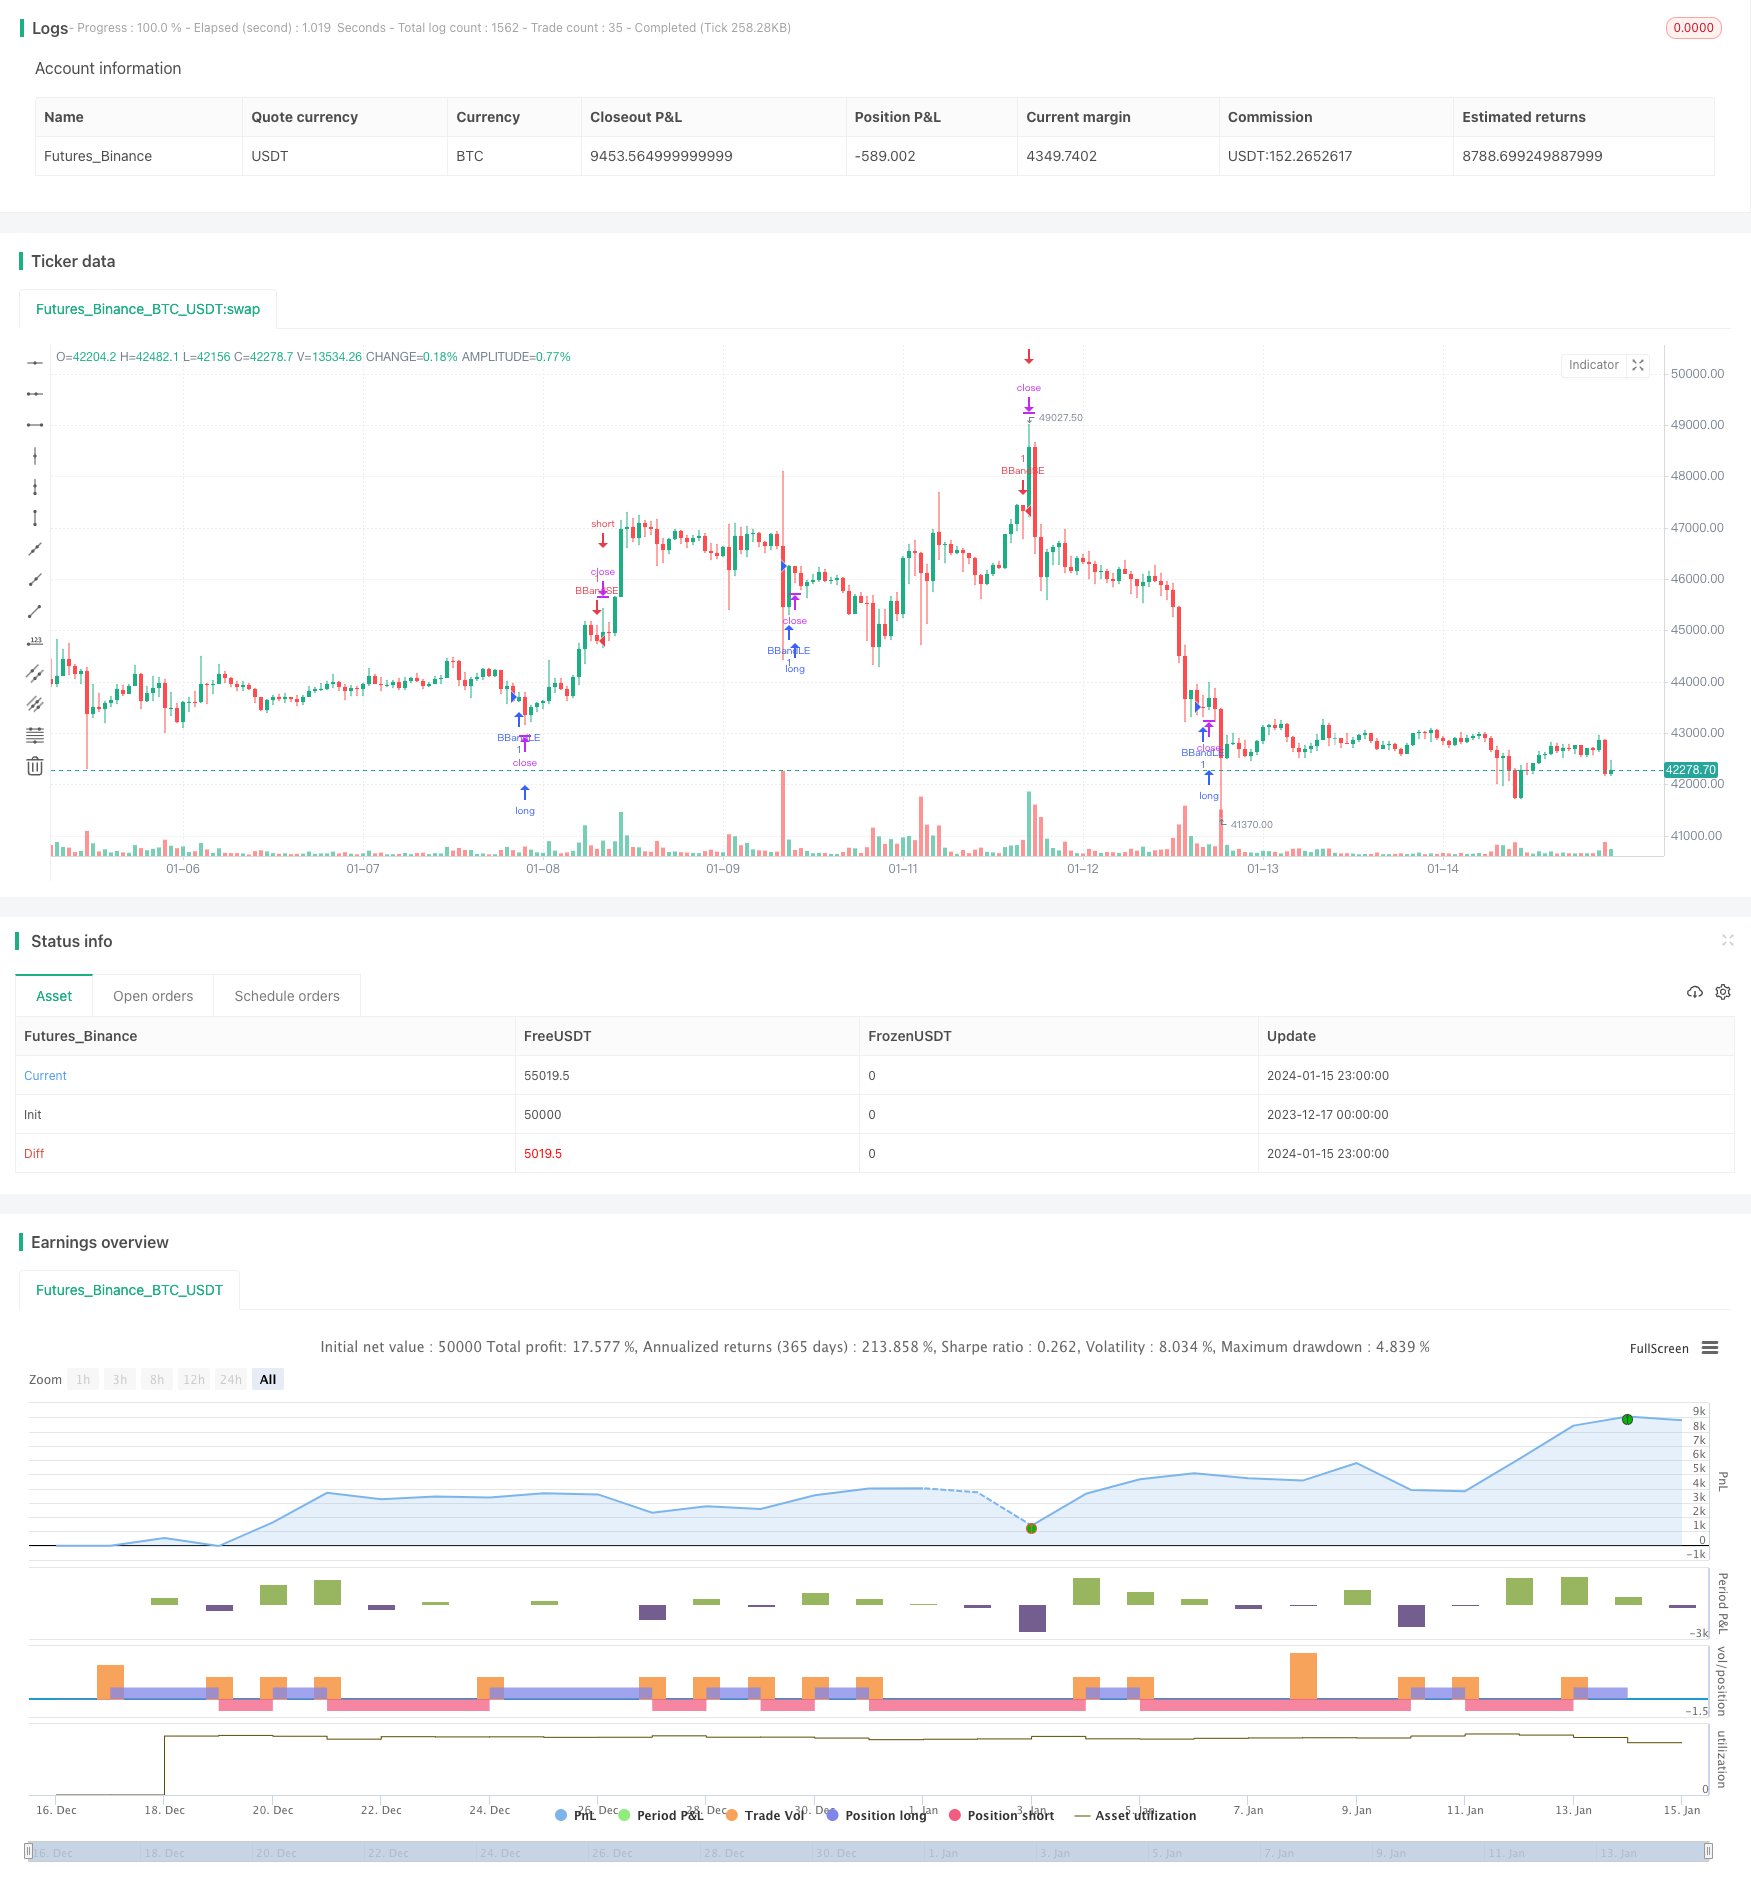
本策略基于布林带指标设计,当价格突破布林带上轨时做空,突破下轨时做多,实现智能追踪交易。
该策略使用布林带中的中线、上轨、下轨为基础指标。中线为n天收盘价的移动平均线,上轨是中线上偏移两个标准差,下轨是中线下偏移两个标准差。当价格从下轨顺势上穿时,做多;当价格从上轨顺势下穿时,做空。这样可以根据市场波动性智能追踪价格。
具体来说,策略主要判断两个指标:
-
ta.crossover(source, lower):收盘价上穿下轨,做多
-
ta.crossunder(source, upper):收盘价下穿上轨,做空
当触发平仓条件时,使用strategy.cancel()函数平掉当前持仓。
该策略主要有以下优势:
- 基于布林带指标设计,可以捕捉市场波动性,有效跟踪价格走势
- 规则清晰简单,容易理解实现
- 可自定义参数如周期长度、标准差倍数等,适应性强
- 可配置移动止损、固定止损及移动止盈等优化策略效果
该策略也存在一些风险:
- 布林带突破容易假突破,可能造成虚假信号
- 效果依赖参数优化,参数选择不当可能影响盈利能力
- 追踪止损困难,无法有效控制单笔损失
对应解决方法:
- 结合其他指标过滤信号,避免假突破
- 做好参数测试,选择最佳参数组合
- 加入移动止损或趋势跟踪止损 clips
该策略还可进一步优化:
- 结合其他指标判断趋势方向,避免不适宜布林带策略的市场
- 测试不同周期参数的效果,找到最佳周期
- 加入移动止损或趋势跟踪止损机制,有效控制单笔亏损
本策略基于布林带指标设计,使用价格突破上下轨的方式实现自动追踪。策略简单易懂,对市场波动性敏感,可通过参数优化和止损方式进一步优化效果。总体来说,该策略适用于波动性较大的股指或商品市场。交易者可根据自己的交易偏好,选择合适的品种和参数进行回测优化,从中获得astika的交易策略。
||
This strategy is designed based on the Bollinger Bands indicator to go short when price breaks above the upper band and go long when price breaks below the lower band, realizing intelligent tracking trading.
The strategy uses the middle line, upper band and lower band of the Bollinger Bands as the base indicators. The middle line is the moving average of the closing prices over n days. The upper band is the middle line shifted up by two standard deviations while the lower band is shifted down by two standard deviations. When price breaks the lower band upwards, go long. When price breaks the upper band downwards, go short. This allows intelligent tracking of price based on market volatility.
Specifically, the strategy mainly judges two metrics:
-
ta.crossover(source, lower): closing price breaks above lower band, go long
-
ta.crossunder(source, upper): closing price breaks below upper band, go short
When the exit condition triggers, use strategy.cancel() function to flatten existing position.
The main advantages of this strategy are:
- Based on Bollinger Bands indicator, able to capture market volatility and effectively track price trend
- Clear and simple logic, easy to understand and implement
- Customizable parameters like period length and standard deviation multiplier, highly adaptable
- Configurable stop loss, break-even or trailing stop mechanisms to optimize strategy performance
There are also some risks with this strategy:
- Bollinger Bands breakouts prone to false signals
- Performance relies on parameter optimization, improper parameters may impact profitability
- Tracking stop loss difficult, unable to effectively control single trade loss
Corresponding solutions:
- Add filters with other indicators to avoid false breakouts
- Test parameters thoroughly to find optimal parameter set
- Add moving or trend-following stop loss mechanisms
The strategy can be further optimized by:
- Adding other indicators to determine trend direction, avoiding unsuitable market conditions for Bollinger strategy
- Testing different period lengths to find the optimal one
- Incorporating moving or trailing stop mechanisms to effectively control single trade loss
This strategy is designed based on the Bollinger Bands indicator, using price breakouts of upper and lower bands to automatically track prices. The logic is simple and sensitive to market volatility. Further optimizations can be done via parameter tuning and stop loss mechanisms. Overall this strategy works well for indices and commodities with higher volatility. Traders can backtest and optimize based on their trading preference to derive an astika trading strategy.
[/trans]
Strategy Arguments
| Argument | Default | Description |
|---|---|---|
| v_input_int_1 | 20 | length |
| v_input_float_1 | 2 | mult |
Source (PineScript)
/*backtest
start: 2023-12-17 00:00:00
end: 2024-01-16 00:00:00
period: 1h
basePeriod: 15m
exchanges: [{"eid":"Futures_Binance","currency":"BTC_USDT"}]
*/

//@version=5
strategy("Bollinger Bands Strategy with alerts (incl. pending orders) via TradingConnector to Forex", overlay=true)
source = close
length = input.int(20, minval=1)
mult = input.float(2.0, minval=0.001, maxval=50)
basis = ta.sma(source, length)
dev = mult * ta.stdev(source, length)
upper = basis + dev
lower = basis - dev
buyEntry = ta.crossover(source, lower)
sellEntry = ta.crossunder(source, upper)
if (ta.crossover(source, lower))
	strategy.entry("BBandLE", strategy.long, stop=lower, oca_name="BollingerBands", comment="BBandLE")
    alert(message='long price='+str.tostring(lower), freq=alert.freq_once_per_bar_close)
else
	strategy.cancel(id="BBandLE")
    alert(message='cancel long', freq=alert.freq_once_per_bar_close)
if (ta.crossunder(source, upper))
	strategy.entry("BBandSE", strategy.short, stop=upper, oca_name="BollingerBands", comment="BBandSE")
    alert(message='short price='+str.tostring(upper), freq=alert.freq_once_per_bar_close)
else
	strategy.cancel(id="BBandSE")
    alert(message='cancel short', freq=alert.freq_once_per_bar_close)
//plot(strategy.equity, title="equity", color=color.red, linewidth=2, style=plot.style_areabr)

//Lines of code added to the original built-in script: 14, 17, 20 and 23 only.
//They trigger alerts ready to be executed on real markets through TradingConnector
//available for Forex, indices, crypto, stocks - anything your broker offers for trading via MetaTrader4/5
Detail
https://www.fmz.com/strategy/439066
Last Modified
2024-01-17 14:05:36