Name
基于布林带的突破策略Bollinger-Bands-Breakout-Strategy
Author
ChaoZhang
Strategy Description
该策略是基于布林带的突破策略。当价格突破布林带下轨时,做多;当价格突破布林带上轨时,做空。该策略利用了布林带能清晰描述价格波动范围的特点,通过捕捉价格突破来产生交易信号。
该策略首先计算出20日的简单移动平均线作为中间基准线,然后计算出距离基准线上下两个标准差的距离作为布林带的上下轨。当收盘价格低于下轨时,认为行情超卖,产生买入信号;当收盘价格高于上轨时,认为行情超买,产生卖出信号。
该策略具有以下优势:
-
利用布林带描述价格波动范围的特性,sellable波动的时候容易产生交易信号。
-
通过下轨突破做多,可以及时捕捉反弹机会。
-
通过上轨突破做空,可以及时捕捉下跌机会。
-
策略思路简单清晰,容易理解与实现。
-
可在多种市场中应用。
该策略也存在一些风险:
-
当行情平静时,容易产生错误信号。
-
无法确定突破后的 Price 行情会继续向哪个方向发展。
-
无法确定突破信号带来的反转力度。
-
布林带参数设置不当也会对策略的效果产生影响。
-
需适当控制仓位规模。
可以通过优化参数,严格控制仓位,设置止损来控制这些风险。
该策略还可以从以下几个方面进行优化:
-
优化布林带的参数,寻找最优的参数组合。
-
利用其他指标进行过滤,避免错误信号。例如量能指标,移动平均线等。
-
设置动态止损或移动止损。
-
根据市场情况,适当调整做多做空的条件。
-
进行回测与模拟交易,评估策略的效果。
该策略整体来说是一种较为经典和常用的突破策略。它利用布林带指标对价格波动范围进行描述,通过捕捉其突破信号来寻找交易机会。该策略思路简单,易于实现,在实际中应用广泛。通过不断测试与优化,可以使其效果更好,风险更小。所以,该策略值得深入研究与应用。
||
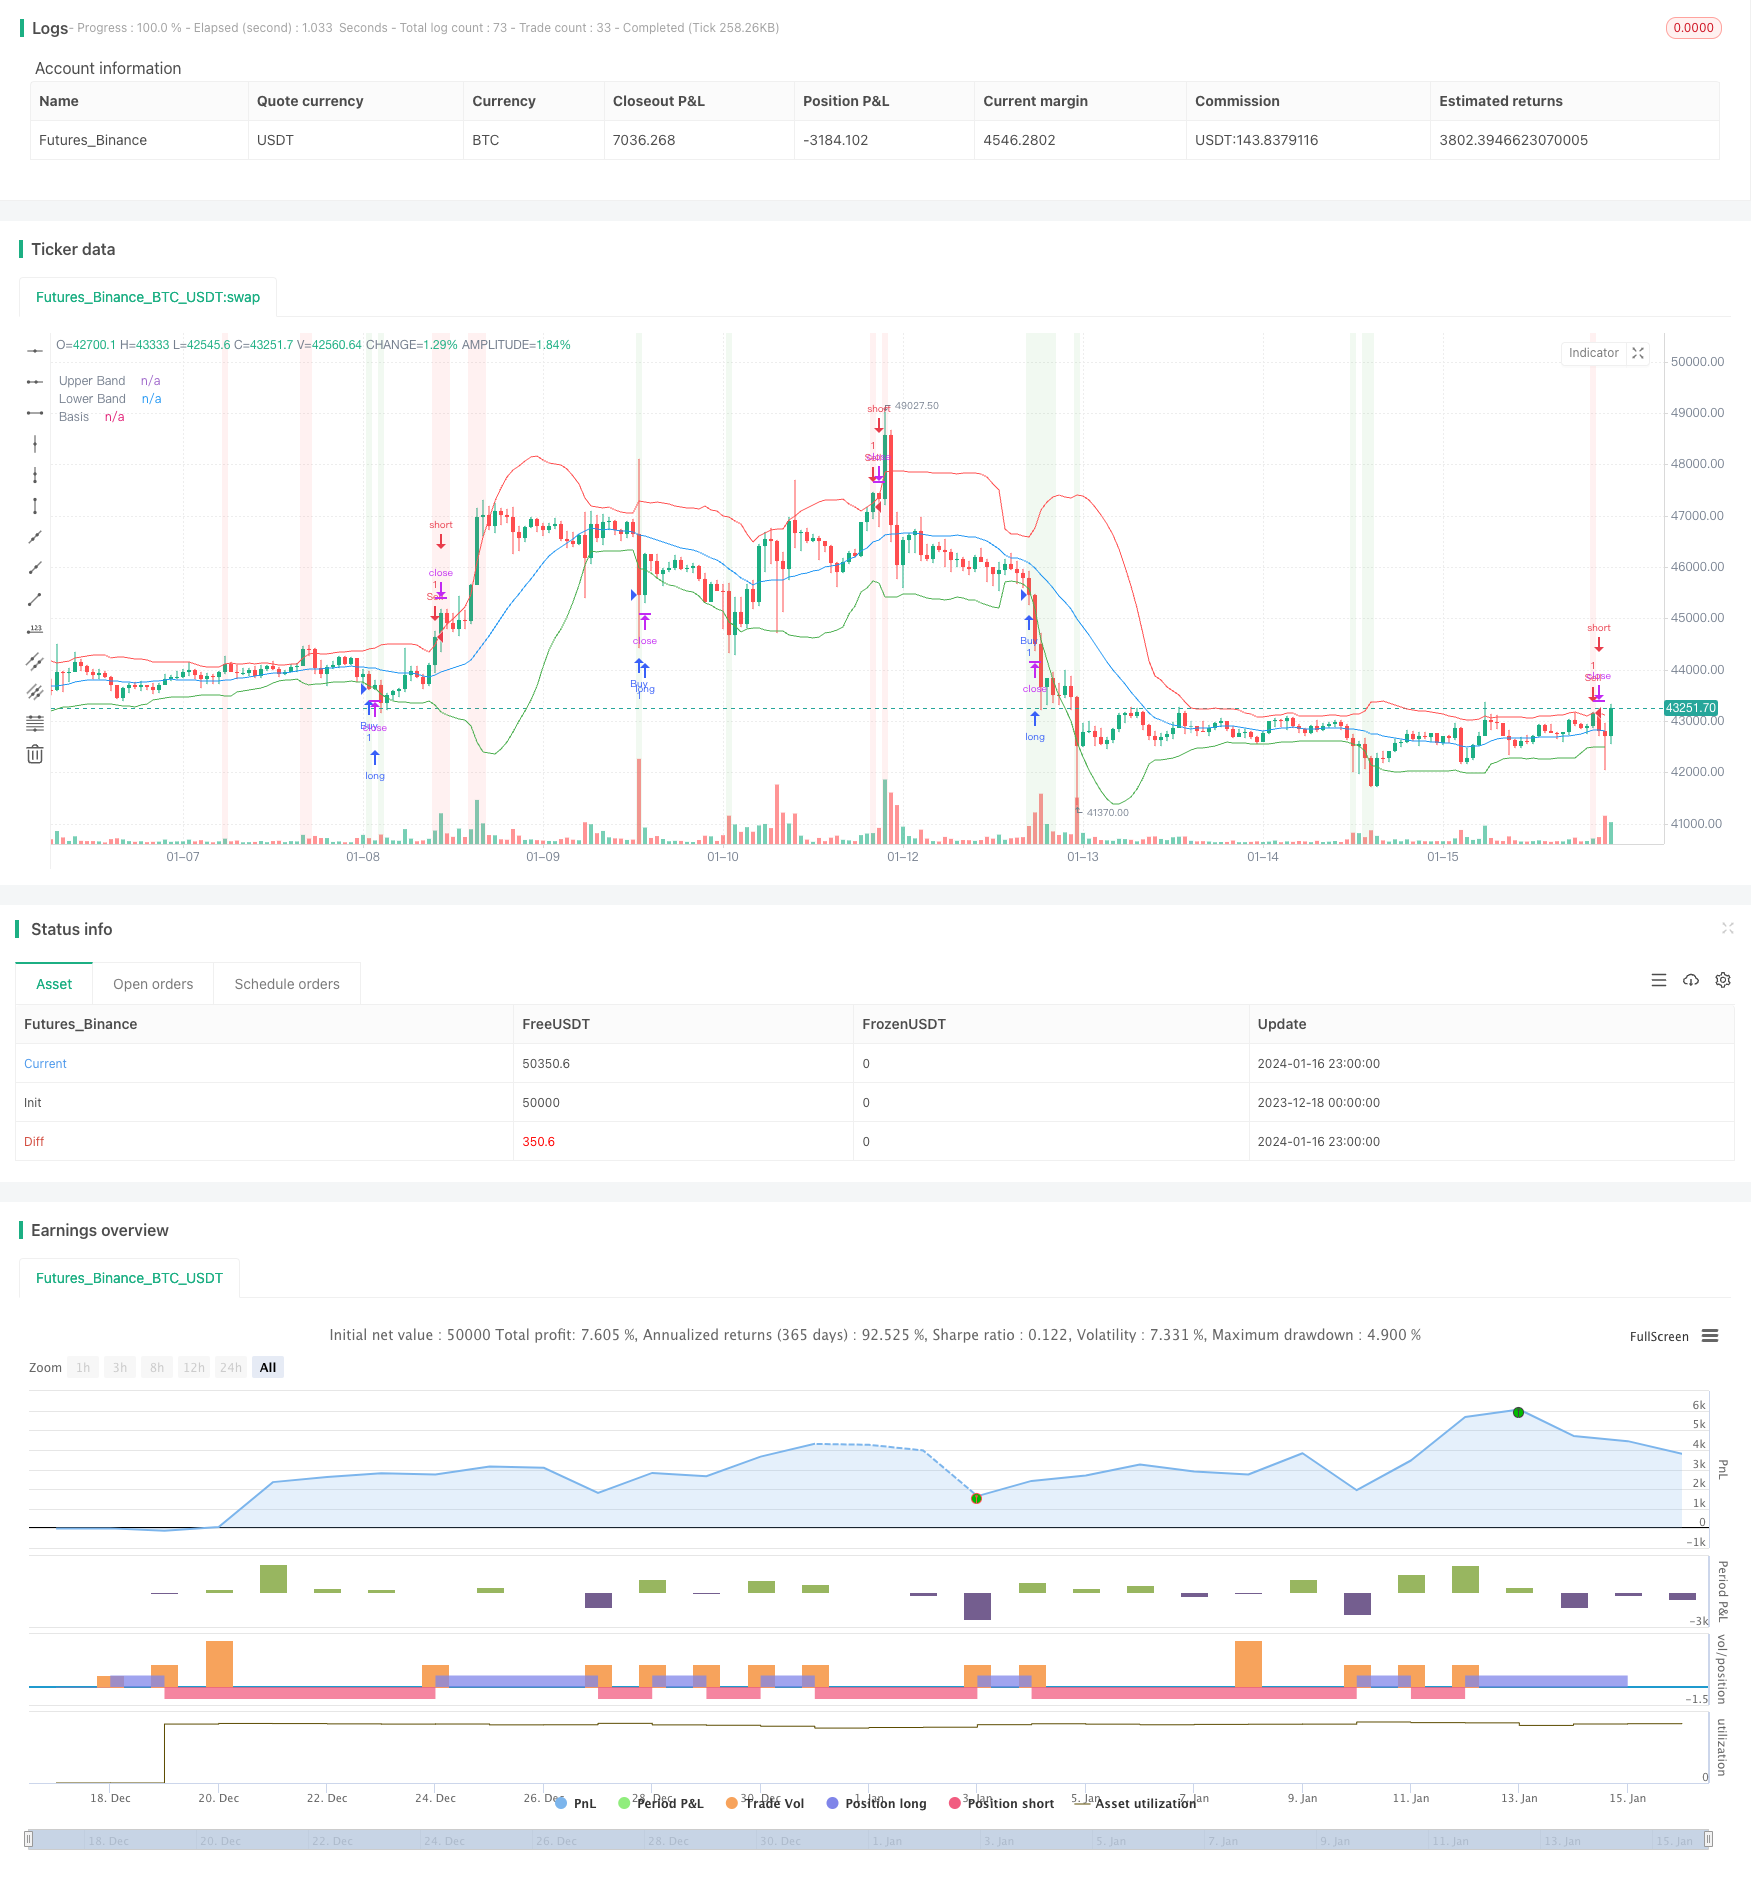
This strategy is a breakout strategy based on Bollinger Bands. It goes long when price breaks below the lower band and goes short when price breaks above the upper band. The strategy utilizes Bollinger Bands' ability to clearly describe price fluctuation ranges to generate trading signals by capturing price breakouts.
The strategy first calculates a 20-day simple moving average as the middle benchmark line, then calculates the distance of two standard deviations above and below the benchmark line as the upper and lower rails of the Bollinger Bands. When the closing price is lower than the lower rail, it is considered oversold, generating a buy signal; when the closing price is higher than the upper rail, it is considered overbought, generating a sell signal.
The strategy has the following advantages:
-
Utilize Bollinger Bands' feature of describing price fluctuation ranges, tends to generate trading signals during sizable fluctuations.
-
Going long on lower rail breakouts can timely capture rebound opportunities.
-
Going short on upper rail breakouts can timely capture downturn opportunities.
-
The strategy idea is simple and clear, easy to understand and implement.
-
Can be applied in various markets.
The strategy also has some risks:
-
Prone to generating false signals when the market is calm.
-
Unable to determine which direction the post-breakout price action will continue to develop towards.
-
Unable to determine the momentum of reversal brought by the breakout signals.
-
Inappropriate Bollinger Bands parameter settings can also affect the strategy's performance.
-
Need to appropriately control position sizing.
These risks can be controlled by optimizing parameters, strictly controlling positions, and setting stop losses.
The strategy can also be optimized in the following aspects:
-
Optimize Bollinger Bands parameters to find the optimal parameter combination.
-
Use other indicators for filtration to avoid false signals, such as momentum indicators, moving averages, etc.
-
Set dynamic or trailing stop loss.
-
Adjust long and short conditions according to market conditions.
-
Conduct backtesting and paper trading to evaluate the strategy's effectiveness.
Overall, this is a relatively classic and commonly used breakout strategy. It uses the Bollinger Bands indicator to describe price fluctuation ranges and captures its breakout signals to find trading opportunities. The strategy idea is simple and easy to implement, widely used in practice. Through continuous testing and optimization, its effectiveness can be improved and risks reduced. Therefore, the strategy is worth in-depth research and application.
[/trans]
Strategy Arguments
| Argument | Default | Description |
|---|---|---|
| v_input_1 | 20 | Bollinger Bands Length |
| v_input_2 | 2 | Multiplier |
Source (PineScript)
/*backtest
start: 2023-12-18 00:00:00
end: 2024-01-17 00:00:00
period: 1h
basePeriod: 15m
exchanges: [{"eid":"Futures_Binance","currency":"BTC_USDT"}]
*/

//@version=5
strategy("Bollinger Bands Strategy", shorttitle="BB Strategy", overlay=true)

// Input parameters
length = input(20, title="Bollinger Bands Length")
mult = input(2, title="Multiplier")

// Calculate Bollinger Bands
basis = ta.sma(close, length)
bb_upper = basis + mult * ta.stdev(close, length)
bb_lower = basis - mult * ta.stdev(close, length)

// Buy and sell conditions
buy_condition = close < bb_lower
sell_condition = close > bb_upper

// Execute trades
strategy.entry("Buy", strategy.long, when=buy_condition)
strategy.entry("Sell", strategy.short, when=sell_condition)

// Plotting Bollinger Bands on the chart
plot(bb_upper, color=color.red, title="Upper Band")
plot(bb_lower, color=color.green, title="Lower Band")
plot(basis, color=color.blue, title="Basis")

// Highlighting buy and sell signals on the chart
bgcolor(buy_condition ? color.new(color.green, 90) : na)
bgcolor(sell_condition ? color.new(color.red, 90) : na)
Detail
https://www.fmz.com/strategy/439201
Last Modified
2024-01-18 12:18:34