Name
基于布林带的趋势跟踪策略Bollinger-Bands-Based-Trend-Following-Strategy
Author
ChaoZhang
Strategy Description
本策略采用布林带指标判断价格趋势方向,结合快慢移动平均线进行入场。当价格突破布林带中轨时且快速移动平均线上穿慢速移动平均线为做多信号。当价格跌破布林带中轨且快速移动平均线下穿慢速移动平均线为做空信号。止损方式为ATR止损。
该策略主要由布林带指标和移动平均线指标组成。
布林带指标由中轨、上轨和下轨组成。中轨为n日简单移动平均线。上轨和下轨分别为中轨上下k倍标准差。当价格接近上轨时代表着超买,当价格接近下轨时代表着超卖。中轨代表价格趋势方向。
移动平均线指标采用快速移动平均线和慢速移动平均线。快速移动平均线参数为40,慢速移动平均线参数为120。当快速移动平均线上穿慢速移动平均线为金叉做多信号。当快速移动平均下穿慢速移动平均线为死叉做空信号。
根据以上指标规则,本策略的具体交易信号如下:
做多信号:收盘价突破布林带中轨且快速移动平均线上穿慢速移动平均线
做空信号:收盘价跌破布林带中轨且快速移动平均线下穿慢速移动平均线
止损方式:ATR止损,止损点为当前价格减去4倍ATR值
该策略结合布林带指标和移动平均线指标,能够有效判断价格趋势方向,避免因震荡行情而频繁开仓。
布林带中轨能清晰地反映价格趋势,价格突破中轨时形成强烈的趋势信号。上下轨可有效地判断超买超卖情况,避免在震荡行情追高杀低。
快慢移动平均线的金叉死叉也是常用的判断趋势的方式。结合布林带指标,能更准确判断入场时机。
ATR止损方式使止损点随市场波动自适应调整,有效控制单笔损失。
该策略最大的风险在于价格突破中轨后很快就会回撤,无法有效获利。这时就会造成亏损。解决方法是适当调整移动平均线参数,使指标参数更加匹配市场特征。
另一个风险是在震荡行情中,布林带指标和移动平均线指标会发出错误信号。这时就要考虑跳过交易信号,等待更明确的趋势行情。或者适当缩小仓位规模。
该策略可以从以下几个方面进行优化:
-
调整布林带指标参数,适应不同周期的市场特征
-
调整快慢移动平均线参数,使指标更加匹配具体交易品种
-
增加其他辅助指标进行组合,提高策略的稳定性
-
优化仓位管理方式,在趋势行情中加大仓位,在震荡行情中缩小仓位
-
测试不同的止损方式,寻找更优解
本策略整体而言是一种较为典型的趋势跟踪策略。它结合布林带指标和移动平均线指标判断价格趋势和交易机会。策略信号生成较为明确,适合自动量化交易。但也存在一定风险,需要进行参数和规则优化以适应更广泛的市场环境。总的来说,该策略框架是可行的,有很大的改进空间。
||
This strategy uses Bollinger Bands to determine the price trend direction combined with fast and slow moving averages to enter positions. The buy signal is triggered when the price breaks through the Bollinger middle band and the fast moving average crosses over the slow moving average. The sell signal is triggered when the price breaks below the Bollinger middle band and the fast moving average crosses below the slow moving average. The stop loss method is ATR trailing stop loss.
The strategy consists mainly of the Bollinger Bands indicator and Moving Averages.
The Bollinger Bands include the middle band, upper band and lower band. The middle band is the n-day simple moving average. The upper band and lower band are k standard deviations above and below the middle band. When price is close to the upper band, it indicates overbought conditions. When price is close to the lower band, it indicates oversold conditions. The middle band represents the price trend direction.
The Moving Averages adopt a fast moving average and a slow moving average. The fast moving average has a period of 40 and the slow moving average has a period of 120. When the fast MA crosses over the slow MA, it is a buy signal. When the fast MA crosses below the slow MA, it is a sell signal.
Based on the rules of the above indicators, the specific trading signals of this strategy are:
Buy Signal: Close price breaks through the middle band and fast MA crosses over slow MA
Sell Signal: Close price breaks below the middle band and fast MA crosses below slow MA
Stop Loss: ATR trailing stop loss, stop loss price is current price minus 4 times ATR
This strategy combines the Bollinger Bands and Moving Averages, which can effectively determine the price trend direction and avoid excessive position opening during ranging periods.
The Bollinger middle band can clearly reflect the price trend. When price breaks through the middle band, it forms a strong trend signal. The upper and lower bands can effectively judge overbought and oversold conditions to avoid chasing new highs and killing lows during ranging periods.
The golden cross and dead cross of fast and slow MAs are also commonly used methods to determine trends. Combined with the Bollinger Bands, it can more accurately determine entry timing.
The ATR trailing stop loss adjusts the stop loss point to adapt to market fluctuations, effectively controlling single position loss.
The biggest risk of this strategy is that price may quickly pullback after breaching the middle band, unable to make profits effectively. This would result in losses. The solution is to appropriately adjust the MA parameters to make the indicators match better to market characteristics.
Another risk is that during ranging periods, the Bollinger Bands and Moving Averages may give out wrong signals. At this time, we should consider skipping trading signals and wait for clearer trends. Or reduce position sizing appropriately.
The strategy can be optimized in the following aspects:
-
Adjust Bollinger Bands parameters to adapt to market characteristics of different periods
-
Adjust fast and slow MA parameters to match the specific trading instruments better
-
Add other auxiliary indicators for combination to improve strategy stability
-
Optimize position sizing methods, increase positions during trending periods and decrease positions during ranging periods
-
Test different stop loss methods to find better solutions
In general, this is a typical trend following strategy. It combines Bollinger Bands and Moving Averages to determine price trends and trading opportunities. The strategy signal is relatively clear, suitable for automated trading. But it also has some risks, parameters and rules need to be optimized to adapt to more extensive market environments. Overall, the strategy framework is feasible and has large room for improvement.
[/trans]
Strategy Arguments
| Argument | Default | Description |
|---|---|---|
| v_input_float_1 | 2 | StdDev |
| v_input_2_close | 0 | Source Fast MA: close |
| v_input_3_close | 0 | Source Slow MA: close |
| v_input_int_1 | 20 | (?Bollinger Bands Inputs)length |
| v_input_1_close | 0 | Source: close |
| v_input_int_2 | false | Offset |
| v_input_int_3 | 40 | (?Moving Average Inputs)Length Fast MA |
| v_input_int_4 | 120 | Length Slow MA |
| v_input_color_1 | red | Color Fast MA |
| v_input_color_2 | purple | Color Slow MA |
| v_input_int_5 | 14 | (?ATR Input)ATR Period |
| v_input_4 | 0.01 | Risk Per Trade |
| v_input_5 | 2 | (?ATR Inputs)ATR Multiplier |
Source (PineScript)
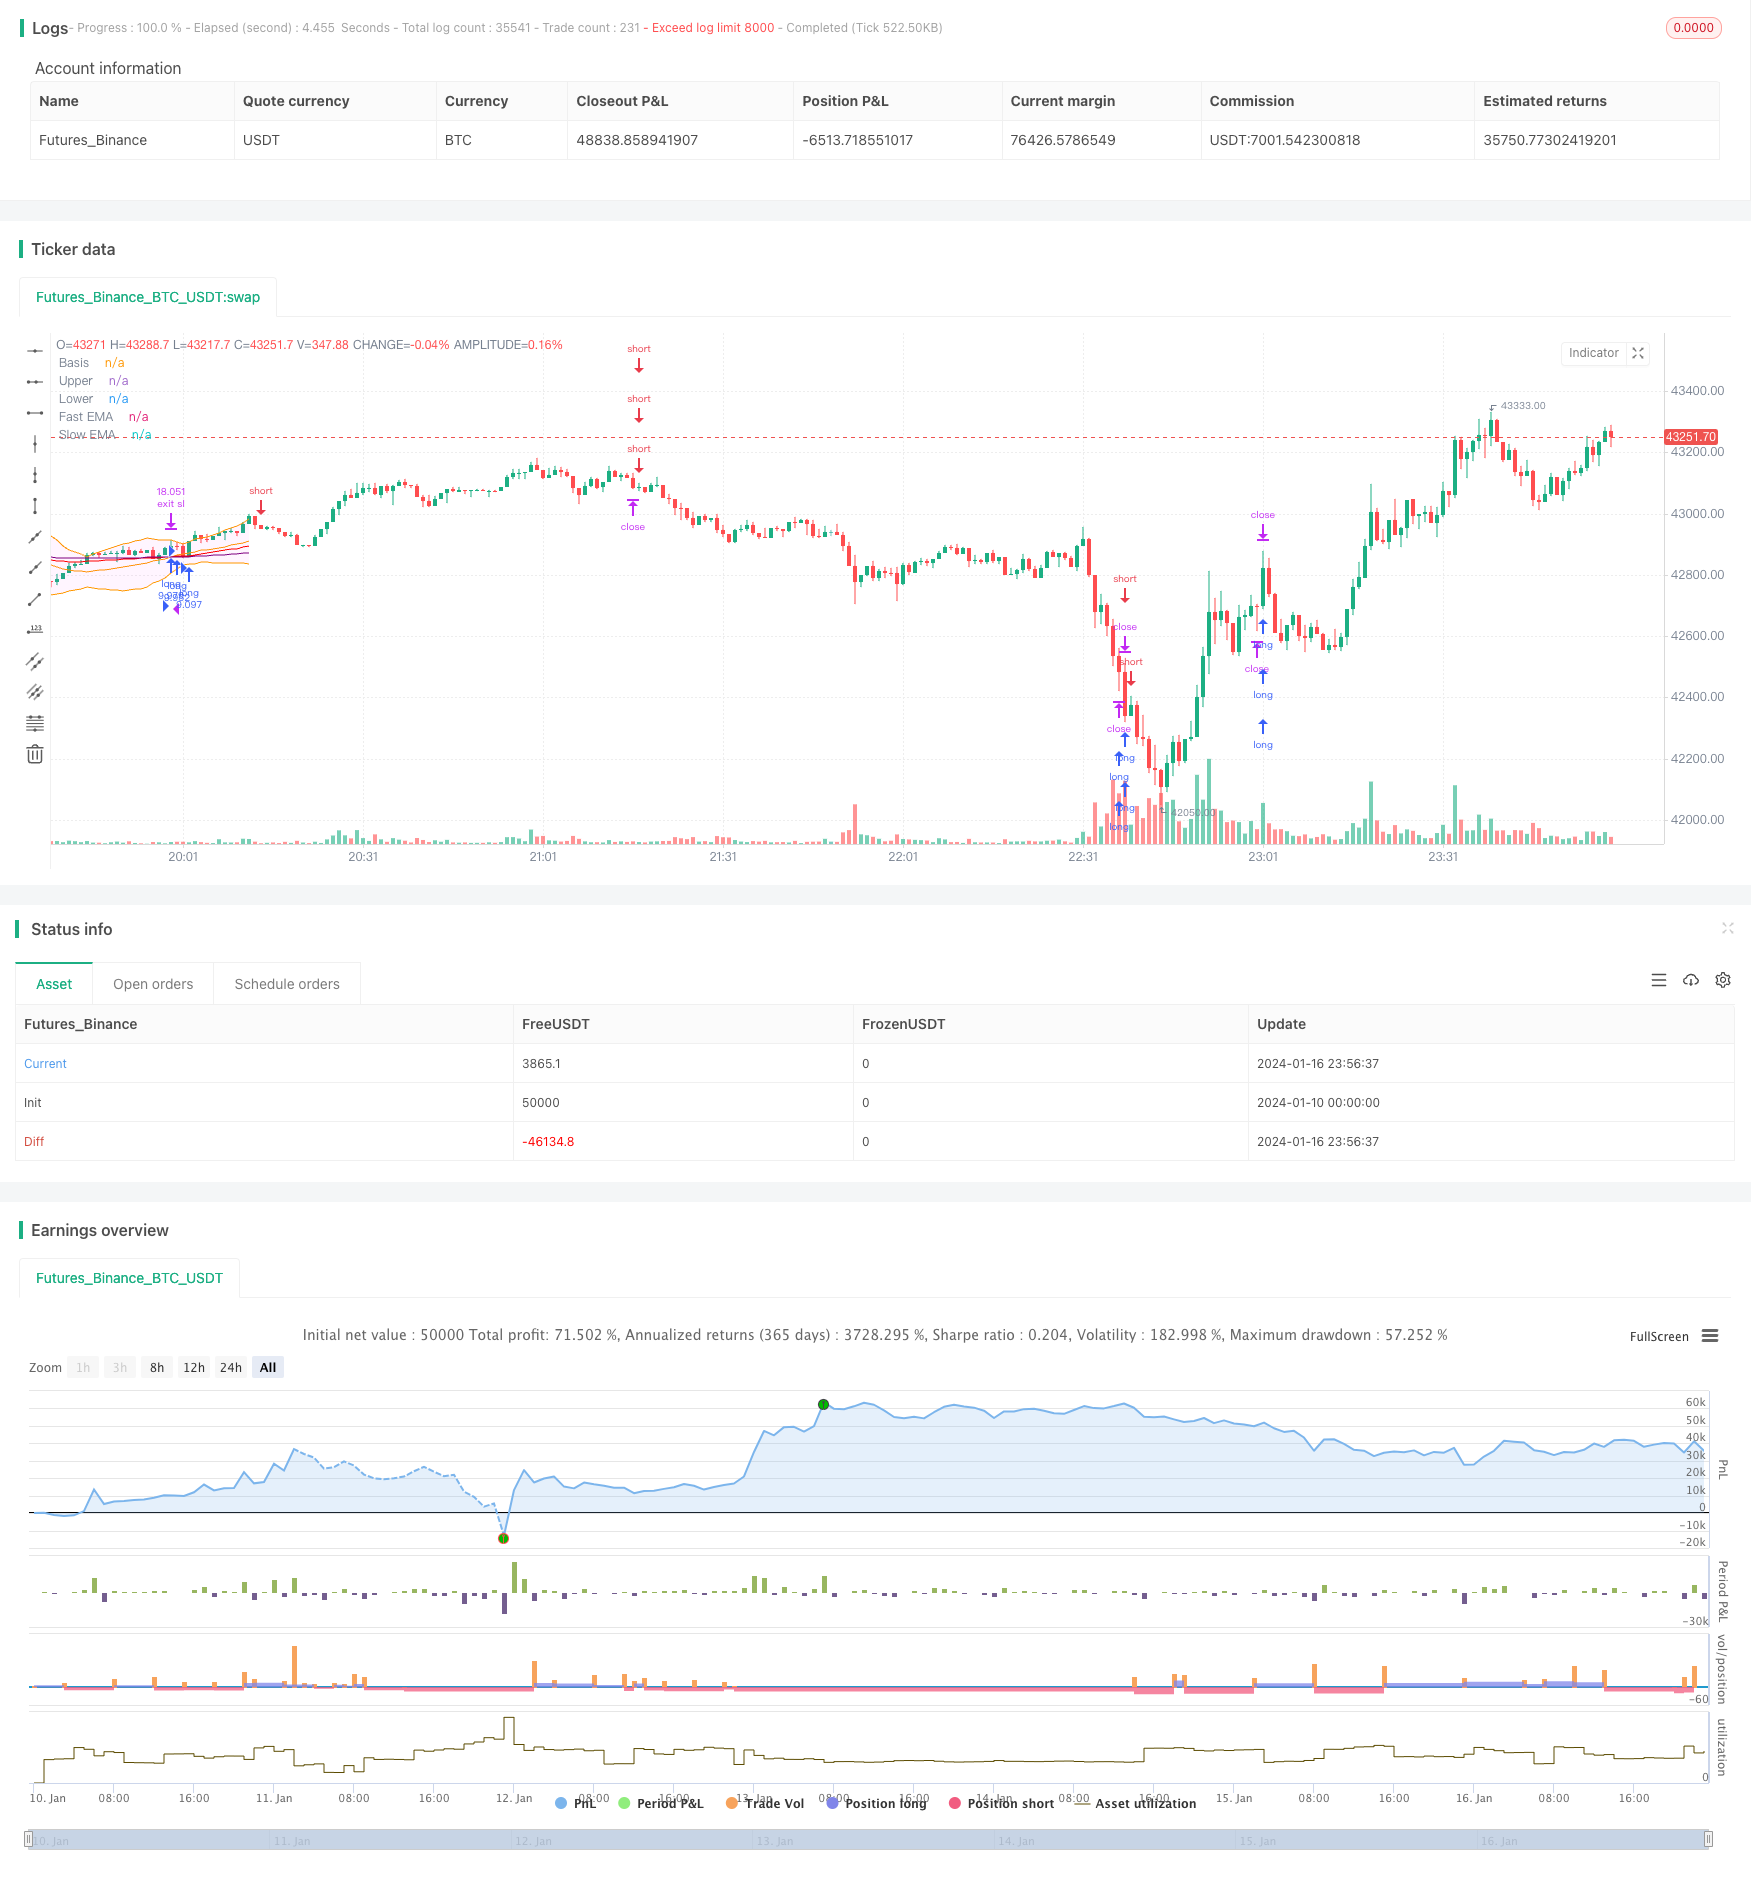
/*backtest
start: 2024-01-10 00:00:00
end: 2024-01-17 00:00:00
period: 1m
basePeriod: 1m
exchanges: [{"eid":"Futures_Binance","currency":"BTC_USDT"}]
*/

// This source code is subject to the terms of the Mozilla Public License 2.0 at https://mozilla.org/MPL/2.0/
// © Robrecht99

//@version=5
strategy("Trend Following with Bollinger Bands", overlay=true, margin_long=100, margin_short=100, pyramiding=4)

// Bollinger Bands //

length = input.int(20, minval=1, group="Bollinger Bands Inputs")
src = input(close, title="Source", group="Bollinger Bands Inputs")
mult = input.float(2.0, minval=0.001, maxval=50, title="StdDev")
basis = ta.sma(src, length)
dev = mult * ta.stdev(src, length)
upper = basis + dev
lower = basis - dev
offset = input.int(0, "Offset", minval = -500, maxval = 500, group="Bollinger Bands Inputs")
plot(basis, "Basis", color=color.orange, offset = offset)
p1 = plot(upper, "Upper", color=color.orange, offset = offset)
p2 = plot(lower, "Lower", color=color.orange, offset = offset)
fill(p1, p2, title = "Background", color=color.rgb(255, 0, 255, 95))

// Moving Averages //

len1 = input.int(40, minval=1, title="Length Fast MA", group="Moving Average Inputs")
len2 = input.int(120, minval=1, title="Length Slow MA", group="Moving Average Inputs")
src1 = input(close, title="Source Fast MA")
src2 = input(close, title="Source Slow MA")
maColorFast = input.color(color.new(color.red, 0), title = "Color Fast MA", group = "Moving Average Inputs", inline = "maFast")
maColorSlow = input.color(color.new(color.purple, 0), title = "Color Slow MA", group = "Moving Average Inputs", inline = "maSlow")
fast = ta.ema(src1, len1)
slow = ta.ema(src2, len2)
plot(fast, color=maColorFast, title="Fast EMA")
plot(slow, color=maColorSlow, title="Slow EMA")

// ATR Inputs //
strategy.initial_capital = 50000

lengthATR = input.int(title="ATR Period", defval=14, minval=1, group="ATR Input")
risk = input(title="Risk Per Trade", defval=0.01, group="ATR Input")
multiplier = input(title="ATR Multiplier", defval=2, group="ATR Inputs")
atr = ta.atr(length)
amount = (risk * strategy.initial_capital / (2 * atr))

// Buy and Sell Conditions //

entrycondition1 = ta.crossover(fast, slow)
entrycondition2 = fast > slow
sellcondition1 = ta.crossunder(fast, slow)
sellcondition2 = slow > fast

// Buy and Sell Signals //

if (close > basis and entrycondition2)
    strategy.entry("long", strategy.long, qty=amount)
    stoploss = close - atr * 4
    strategy.exit("exit sl", stop=stoploss, trail_offset=stoploss)
if (sellcondition1 and sellcondition2)
    strategy.close(id="long")

if (close < basis and sellcondition2)
    strategy.entry("short", strategy.short, qty=amount)
    stoploss = close + atr * 4
    strategy.exit("exit sl", stop=stoploss, trail_offset=stoploss)
if (entrycondition1 and entrycondition2)
    strategy.close(id="short")
Detail
https://www.fmz.com/strategy/439273
Last Modified
2024-01-18 16:37:56