Name
基于情绪的XBT期货交易策略Sentiment-Based-XBT-Futures-Trading-Strategy
Author
ChaoZhang
Strategy Description
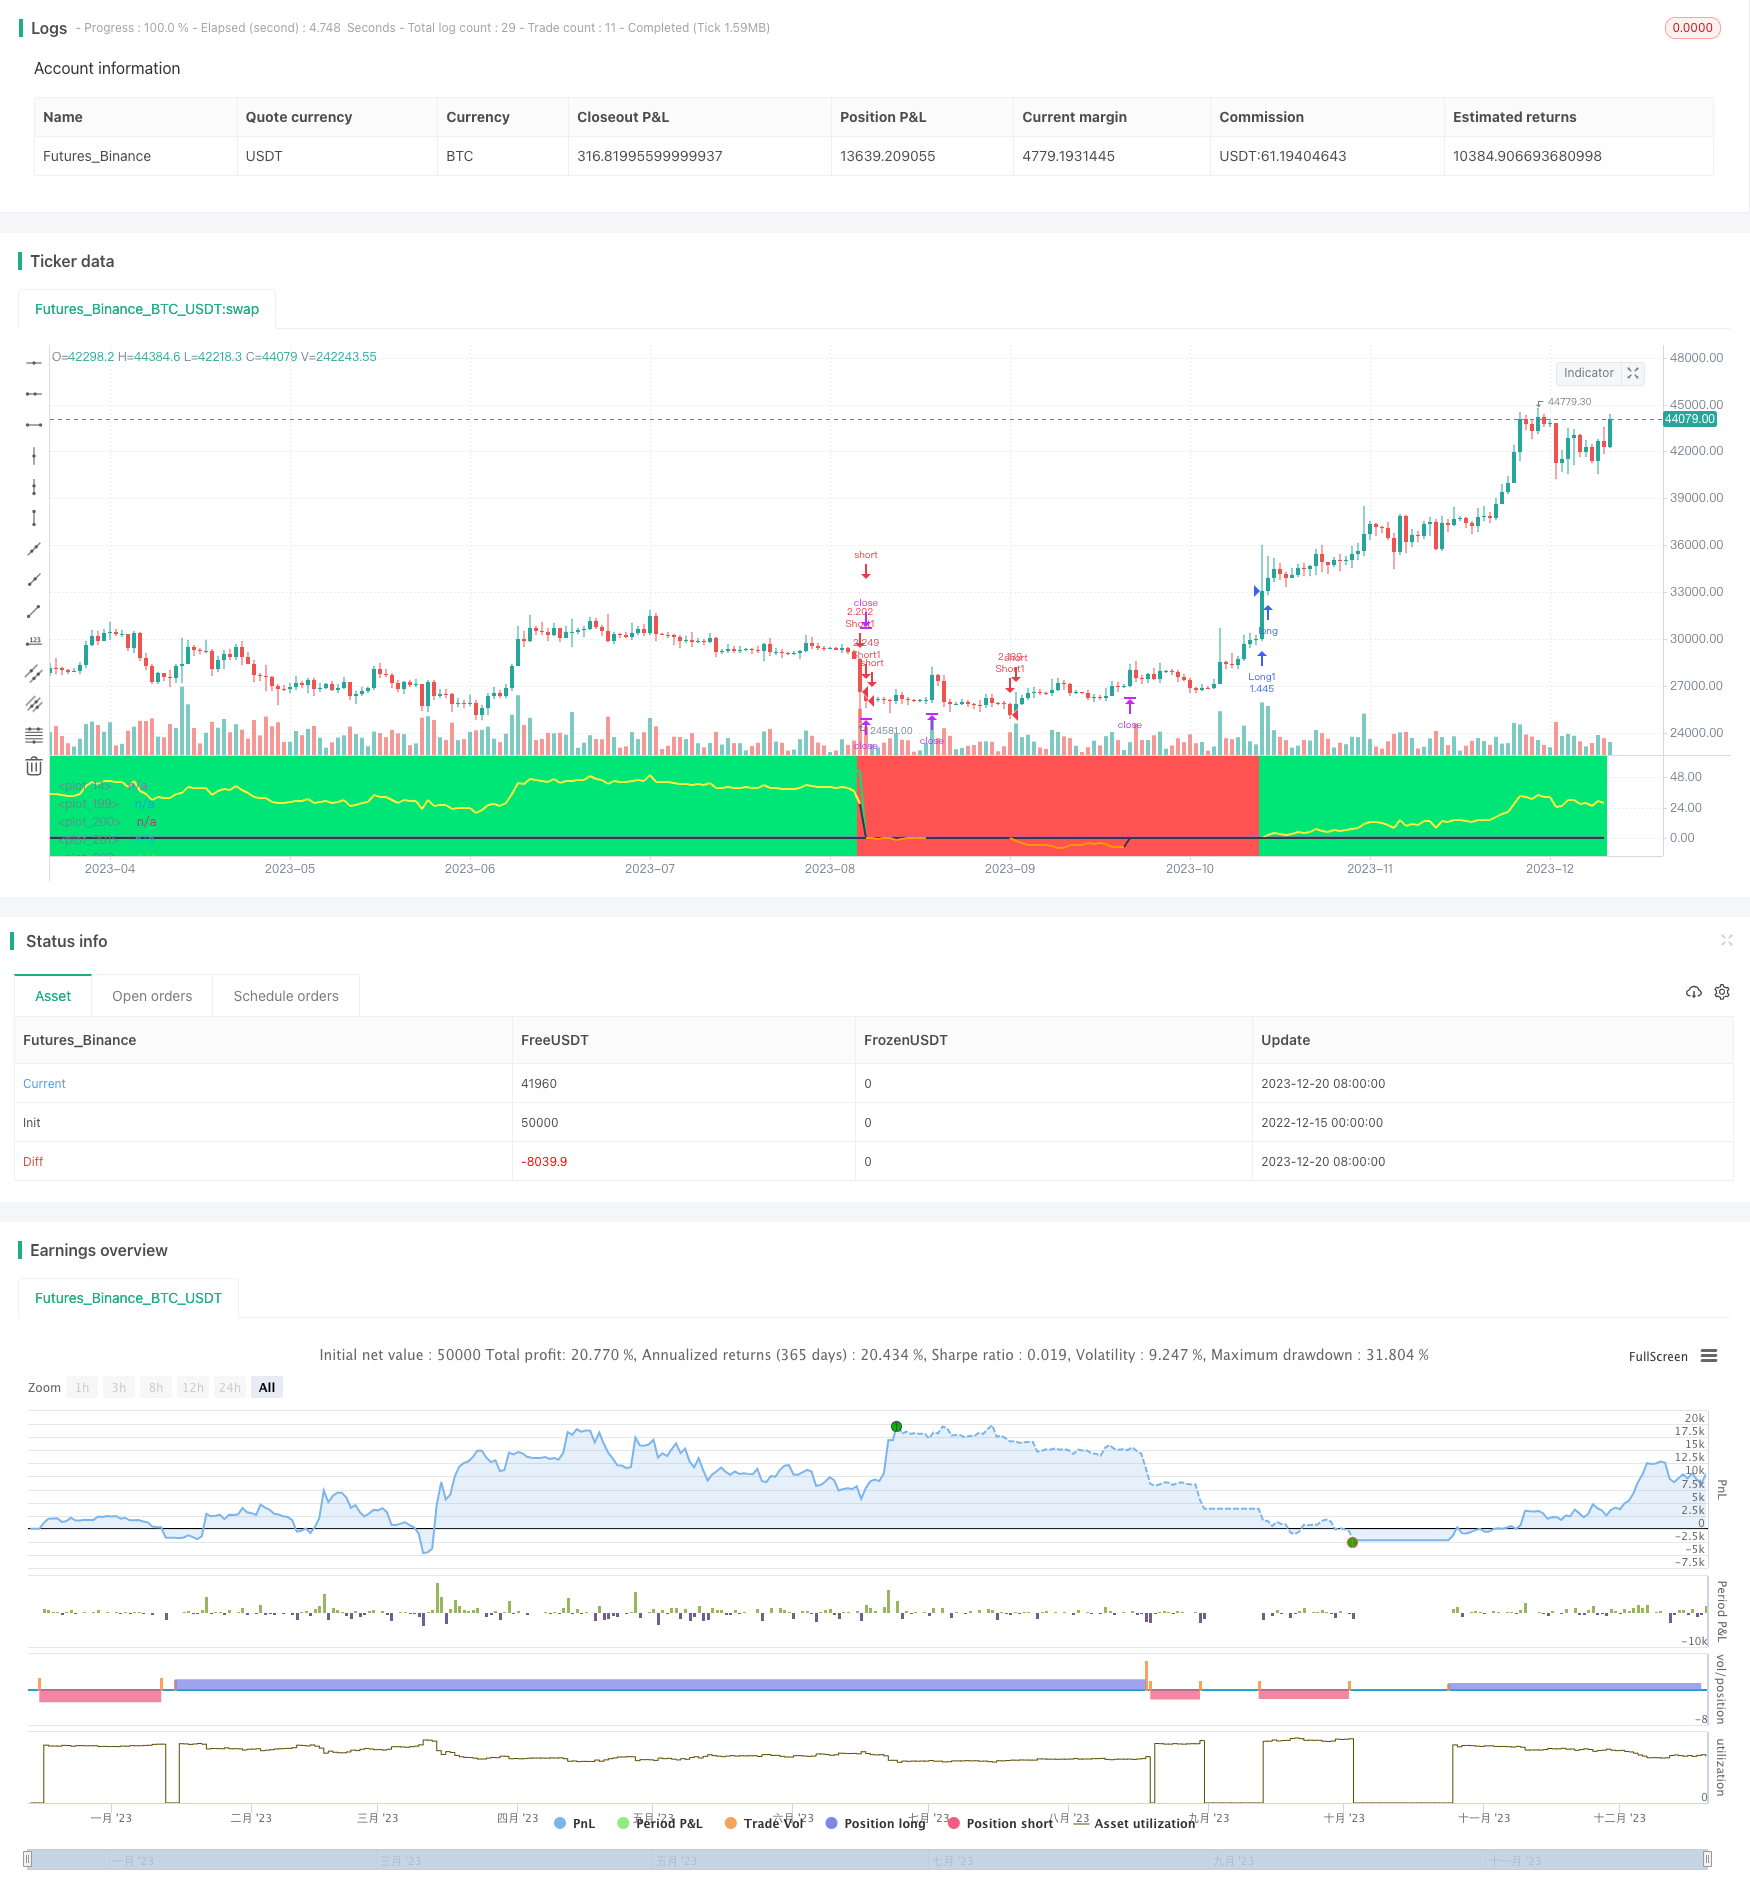
本策略采用多周期情绪分析的方法,对XBTUSD合约做多空交易。它综合考虑了不同周期下的价格波动幅度和最高价、最低价信息,通过一系列权重调整,计算出当前市场的整体情绪值。根据情绪值的变化规律判断行情,产生买入和卖出信号。
-
计算a到j个周期(1到89根K线)下的最高价、最低价、平均价、价格波动幅度等指标。
-
定义当前收盘价在价格范围内的标准化位置(place变量),再结合各周期价格波动幅度,计算出不同周期下的情绪值。
-
情绪值经过一系列权重(w变量)调整,计算出整体情绪值(sentiment)。情绪值反映目前市场的平均情绪。
-
分析情绪值的波动情况,当情绪从正转负时,产生卖出信号;当情绪从负转正时,产生买入信号。
-
根据情绪的绝对波动值大小(delta变量),判断入场的力度,以及设置止盈止损条件。
-
考虑了多种不同时间周期下的情绪,更全面判断市场走势。
-
权重调整机制使策略更稳定。
-
综合考虑情绪值和情绪波动,判断入场时机更精准。
-
结合最高价最低价、止盈止损机制控制风险。
-
参数设置不当可能导致过于频繁交易或漏掉交易机会。
-
突发黑天鹅事件可能导致策略失效。
-
合约调整、交易规则变更等可能对策略产生影响。
-
情绪值计算依赖历史数据,在市场结构发生变化时需要重新评估和调整。
可以通过调整权重、交易周期、止盈止损幅度等参数来优化,使策略更适应市场结构的变化。同时优化资金管理,严格控制单笔交易规模和总体仓位。
-
继续扩充分析周期,丰富情绪判断的基础。
-
加入更多技术指标,实现情绪判断和技术指标的组合。
-
结合机器学习方法提取情绪特征。
-
动态调整权重设置。
-
优化止盈止损策略。
本策略立足于情绪分析的交易理念,通过多周期综合考量,判断当前整体市场情绪。其连续的情绪变化作为产生交易信号的依据,并辅以价格波动信息判断具体入场时机。这套策略判断行情的角度独特,在大周期震荡行情中表现较好。通过进一步扩充周期设置、加入更多辅助技术指标、调整参数优化等手段,可以使该情绪交易策略更加成熟和稳定,适应更加复杂的市场环境。
||
This strategy adopts the approach of multi-cycle sentiment analysis to go long or short XBTUSD futures contract. It comprehensively considers the price fluctuation range and highest and lowest prices across different cycles, and calculates the overall market sentiment through a series of weight adjustments. Buy and sell signals are generated based on the changing patterns of the sentiment value.
-
Calculate the highest price, lowest price, average price, price fluctuation range and other indicators across cycles from a to j (1 to 89 bars).
-
Define the standardized position of the closing price within the price range (place variable). Combine it with price fluctuation range of each cycle to get sentiment value for different cycles.
-
The sentiment values go through a series of weight (w variable) adjustments to get the overall sentiment value (sentiment). The sentiment reflects current overall market mood.
-
Analyze the fluctuation of sentiment value. A sell signal is generated when sentiment turns from positive to negative. A buy signal is generated when sentiment turns from negative to positive.
-
Determine entry momentum and set take profit and stop loss conditions based on the absolute value of sentiment fluctuation (delta variable).
-
Consider sentiment across different cycles for a more comprehensive market trend judgment.
-
The weight adjustment mechanism makes the strategy more stable.
-
More precise entry timing by combining sentiment value and its fluctuation.
-
Manage risks with highest price, lowest price, take profit and stop loss.
-
Improper parameter settings may cause too frequent trading or missing opportunities.
-
Black swan events may invalidate the strategy logic.
-
Contract adjustments and rule changes may impact strategy performance.
-
Sentiment calculation relies on historical data. Reassessment is needed when market regime changes.
Risks can be managed by adjusting weights, trading cycles, take profit ratios etc to fit changing market conditions. Meanwhile optimize capital management by strictly controlling position sizing and overall exposure.
-
Expand analysis cycles to build richer basis for sentiment judgment.
-
Incorporate more technical indicators for a combined approach.
-
Extract sentiment features with machine learning methods.
-
Dynamically adjust weight settings.
-
Optimize take profit and stop loss strategies.
This strategy is based on the trading philosophy of sentiment analysis. It determines current overall market mood by considering multiple cycles. The continuous sentiment changes serve as the basis for generating trading signals, assisted by price fluctuation for timing entry. This unique approach of judging market trends works well in ranging cycles. Further expanding analysis periods, adding more indicators and optimizing can make the sentiment trading strategy more mature and stable for adapting more complex market environments.
[/trans]
Strategy Arguments
| Argument | Default | Description |
|---|---|---|
| v_input_1 | true | leverage |
| v_input_2 | 53 | take profit % |
| v_input_3 | 7 | stoploss % |
| v_input_4 | 0.7 | level to initiate trade |
| v_input_5 | false | level to close trade |
| v_input_6 | 0.68 | level to initiate trade |
| v_input_7 | false | level to close trade |
| v_input_8 | 1.158 | weight a |
| v_input_9 | 1.119 | weight b |
| v_input_10 | 1.153 | weight c |
| v_input_11 | 1.272 | weight d |
| v_input_12 | 1.295 | weight e |
| v_input_13 | 1.523 | weight f |
| v_input_14 | 1.588 | weight g |
| v_input_15 | 2.1 | weight h |
| v_input_16 | 1.816 | weight i |
| v_input_17 | 2.832 | weight j |
Source (PineScript)
/*backtest
start: 2022-12-15 00:00:00
end: 2023-12-21 00:00:00
period: 1d
basePeriod: 1h
exchanges: [{"eid":"Futures_Binance","currency":"BTC_USDT"}]
*/

// This source code is subject to the terms of the Mozilla Public License 2.0 at https://mozilla.org/MPL/2.0/
// © Jomy

//@version=4

//2h chart BITMEX:XBTUSD
//use on low leverage 1-2x only

strategy("expected range STRATEGY",overlay=false,initial_capital=1000,precision=2)
leverage=input(1,"leverage",step=.5)
tp=input(53,"take profit %",step=1)
sl=input(7,"stoploss %",step=1)
stoploss=1-(sl/100)
plot(stoploss)
level=input(.70,"level to initiate trade",step=.02)
closelevel=input(0.0,"level to close trade",step=.02)
levelshort=input(.68,"level to initiate trade",step=.02)
closelevelshort=input(0.0,"level to close trade",step=.02)

wa=input(1.158,"weight a",step=.2)
wb=input(1.119,"weight b",step=.2)
wc=input(1.153,"weight c",step=.2)
wd=input(1.272,"weight d",step=.2)
we=input(1.295,"weight e",step=.2)
wf=input(1.523,"weight f",step=.2)
wg=input(1.588,"weight g",step=.2)
wh=input(2.100,"weight h",step=.2)
wi=input(1.816,"weight i",step=.2)
wj=input(2.832,"weight j",step=.2)
a=1
b=2
c=3
d=5
e=8
f=13
g=21
h=34
i=55
j=89

n=0
n:=if volume > -1
    nz(n[1])+1


ra=highest(high,a)-lowest(low,a)
aa=sma(ohlc4,a)
ha=aa[1]+ra[1]/2
la=aa[1]-ra[1]/2

rb=highest(high,b)-lowest(low,b)
ab=sma(ohlc4,b)
hb=ab[1]+rb[1]/2
lb=ab[1]-rb[1]/2

rc=highest(high,c)-lowest(low,c)
ac=sma(ohlc4,c)
hc=ac[1]+rc[1]/2
lc=ac[1]-rc[1]/2

rd=highest(high,d)-lowest(low,d)
ad=sma(ohlc4,d)
hd=ad[1]+rd[1]/2
ld=ad[1]-rd[1]/2

re=highest(high,e)-lowest(low,e)
ae=sma(ohlc4,e)
he=ae[1]+re[1]/2
le=ae[1]-re[1]/2

rf=highest(high,f)-lowest(low,f)
af=sma(ohlc4,f)
hf=af[1]+rf[1]/2
lf=af[1]-rf[1]/2

rg=highest(high,g)-lowest(low,g)
ag=sma(ohlc4,g)
hg=ag[1]+rg[1]/2
lg=ag[1]-rg[1]/2

rh=highest(high,h)-lowest(low,h)
ah=sma(ohlc4,h)
hh=ah[1]+rh[1]/2
lh=ah[1]-rh[1]/2

ri=highest(high,i)-lowest(low,i)
ai=sma(ohlc4,i)
hi=ai[1]+ri[1]/2
li=ai[1]-ri[1]/2

rj=highest(high,j)-lowest(low,j)
aj=sma(ohlc4,j)
hj=aj[1]+rj[1]/2
lj=aj[1]-rj[1]/2

placea=((close-la)/(ha-la)-.5)*-100
placeb=((close-lb)/(hb-lb)-.5)*-100
placec=((close-lc)/(hc-lc)-.5)*-100
placed=((close-ld)/(hd-ld)-.5)*-100
placee=((close-le)/(he-le)-.5)*-100
placef=((close-lf)/(hf-lf)-.5)*-100
placeg=((close-lg)/(hg-lg)-.5)*-100
placeh=((close-lh)/(hh-lh)-.5)*-100
placei=((close-li)/(hi-li)-.5)*-100
placej=((close-lj)/(hj-lj)-.5)*-100

sentiment=((placea/j)*ra*wa+(placeb/i)*rb*wb+(placec/h)*rc*wc+(placed/g)*rd*wd+(placee/f)*re*we+(placef/e)*rf*wf+(placeg/d)*rg*wg+(placeh/c)*rh*wh+(placei/b)*ri*wi+(placej/a)*rj*wj)/(wa+wb+wc+wd+we+wf+wg+wh+wi+wj)

deltalong=0.0
deltalong:=if sentiment>0
    nz(deltalong[1])+sentiment-sentiment[1]
else
    0
deltashort=0.0
deltashort:=if sentiment<0
    nz(deltashort[1])+((sentiment-sentiment[1])*-1)
else
    0

//plot(sentiment*-1,color=color.blue)
//plot(deltalong,color=color.red)
//plot(deltashort,color=color.lime)

peakfindlong=highest(deltalong,j)*level


peakfindshort=highest(deltashort,j)*levelshort


contracts=(strategy.equity/close)*leverage


//reason for o is this strategy makes dumb trades before the sentiment line crosses the 0 point the first time
o=0
o:=if cross(0,sentiment) and n>j
    1
else
    nz(o[1])

long=deltashort>peakfindlong and o==1

short=deltalong>peakfindshort and o==1


longstart=0.0
longstart:=if strategy.position_size>0 and strategy.position_size[1]<=0
    close
else
    nz(longstart[1])

shortstart=0.0
shortstart:=if strategy.position_size<0 and strategy.position_size[1]>=0
    close
else
    nz(shortstart[1])

highsincelong = 0.0
highsincelong := if strategy.position_size>0
    max(max(highsincelong[1],high),high[1])
else
    0

lowsinceshort = 1000000.0
lowsinceshort := if strategy.position_size<0
    min(min(lowsinceshort[1],low),low[1])
else
    10000000

closelong=strategy.position_size > 0 and ((highsincelong/longstart-1)*100) > tp
closeshort=strategy.position_size < 0 and ((shortstart/lowsinceshort-1)*100) > tp

stoptrade=0
stoptrade:= if closelong
    1
else
    nz(stoptrade[1])

stoptrade:= if short and stoptrade[1]==1
    0
else
    stoptrade

stoptrade:= if closeshort
    -1
else
    stoptrade

stoptrade:= if long and stoptrade[1]==-1
    0
else
    stoptrade

if(closelong)
    strategy.close("Long1")

pnllong = ((close - strategy.position_avg_price) / strategy.position_avg_price)*100
pnlshort = ((strategy.position_avg_price-close) / strategy.position_avg_price) *100
plot (strategy.position_size > 0 ?(highsincelong/longstart-1)*100 : 0.0,color=color.lime,linewidth=2)
plot (strategy.position_size < 0 ?(shortstart/lowsinceshort-1)*100 : 0.0,color=color.red,linewidth=2)
plot( strategy.position_size > 0 ? pnllong:0, color=strategy.position_size > 0 ?color.yellow:color.black,linewidth=2 )
plot( strategy.position_size < 0 ? pnlshort:0, color=strategy.position_size < 0 ?color.orange:color.black,linewidth=2)
longuntilshort=0
longuntilshort:=if long
    1
else
    if short
        -1
    else
        nz(longuntilshort[1])
bgcolor(stoptrade!=0?color.black:longuntilshort==1?color.lime:longuntilshort==-1?color.red:na,transp=70)

if(long and stoptrade==0)
    strategy.entry("Long1",strategy.long,qty=max(1,min(contracts,1000000000)))

if(closelong)
    strategy.close("Long1")

strategy.exit("Long1",stop=longstart * stoploss,when = strategy.position_size>0)

if(short and stoptrade==0)
    strategy.entry("Short1",strategy.short,max(1,min(contracts,1000000000)))

if(closeshort)
    strategy.close("Short1")

strategy.exit("Long1",stop=shortstart / stoploss,when = strategy.position_size<0)
Detail
https://www.fmz.com/strategy/436248
Last Modified
2023-12-22 14:48:44