Name
基于斐波那契HMA的AI买卖信号策略Fibonacci-HMA-AI-Buy-Sell-Signal-Strategy
Author
ChaoZhang
Strategy Description
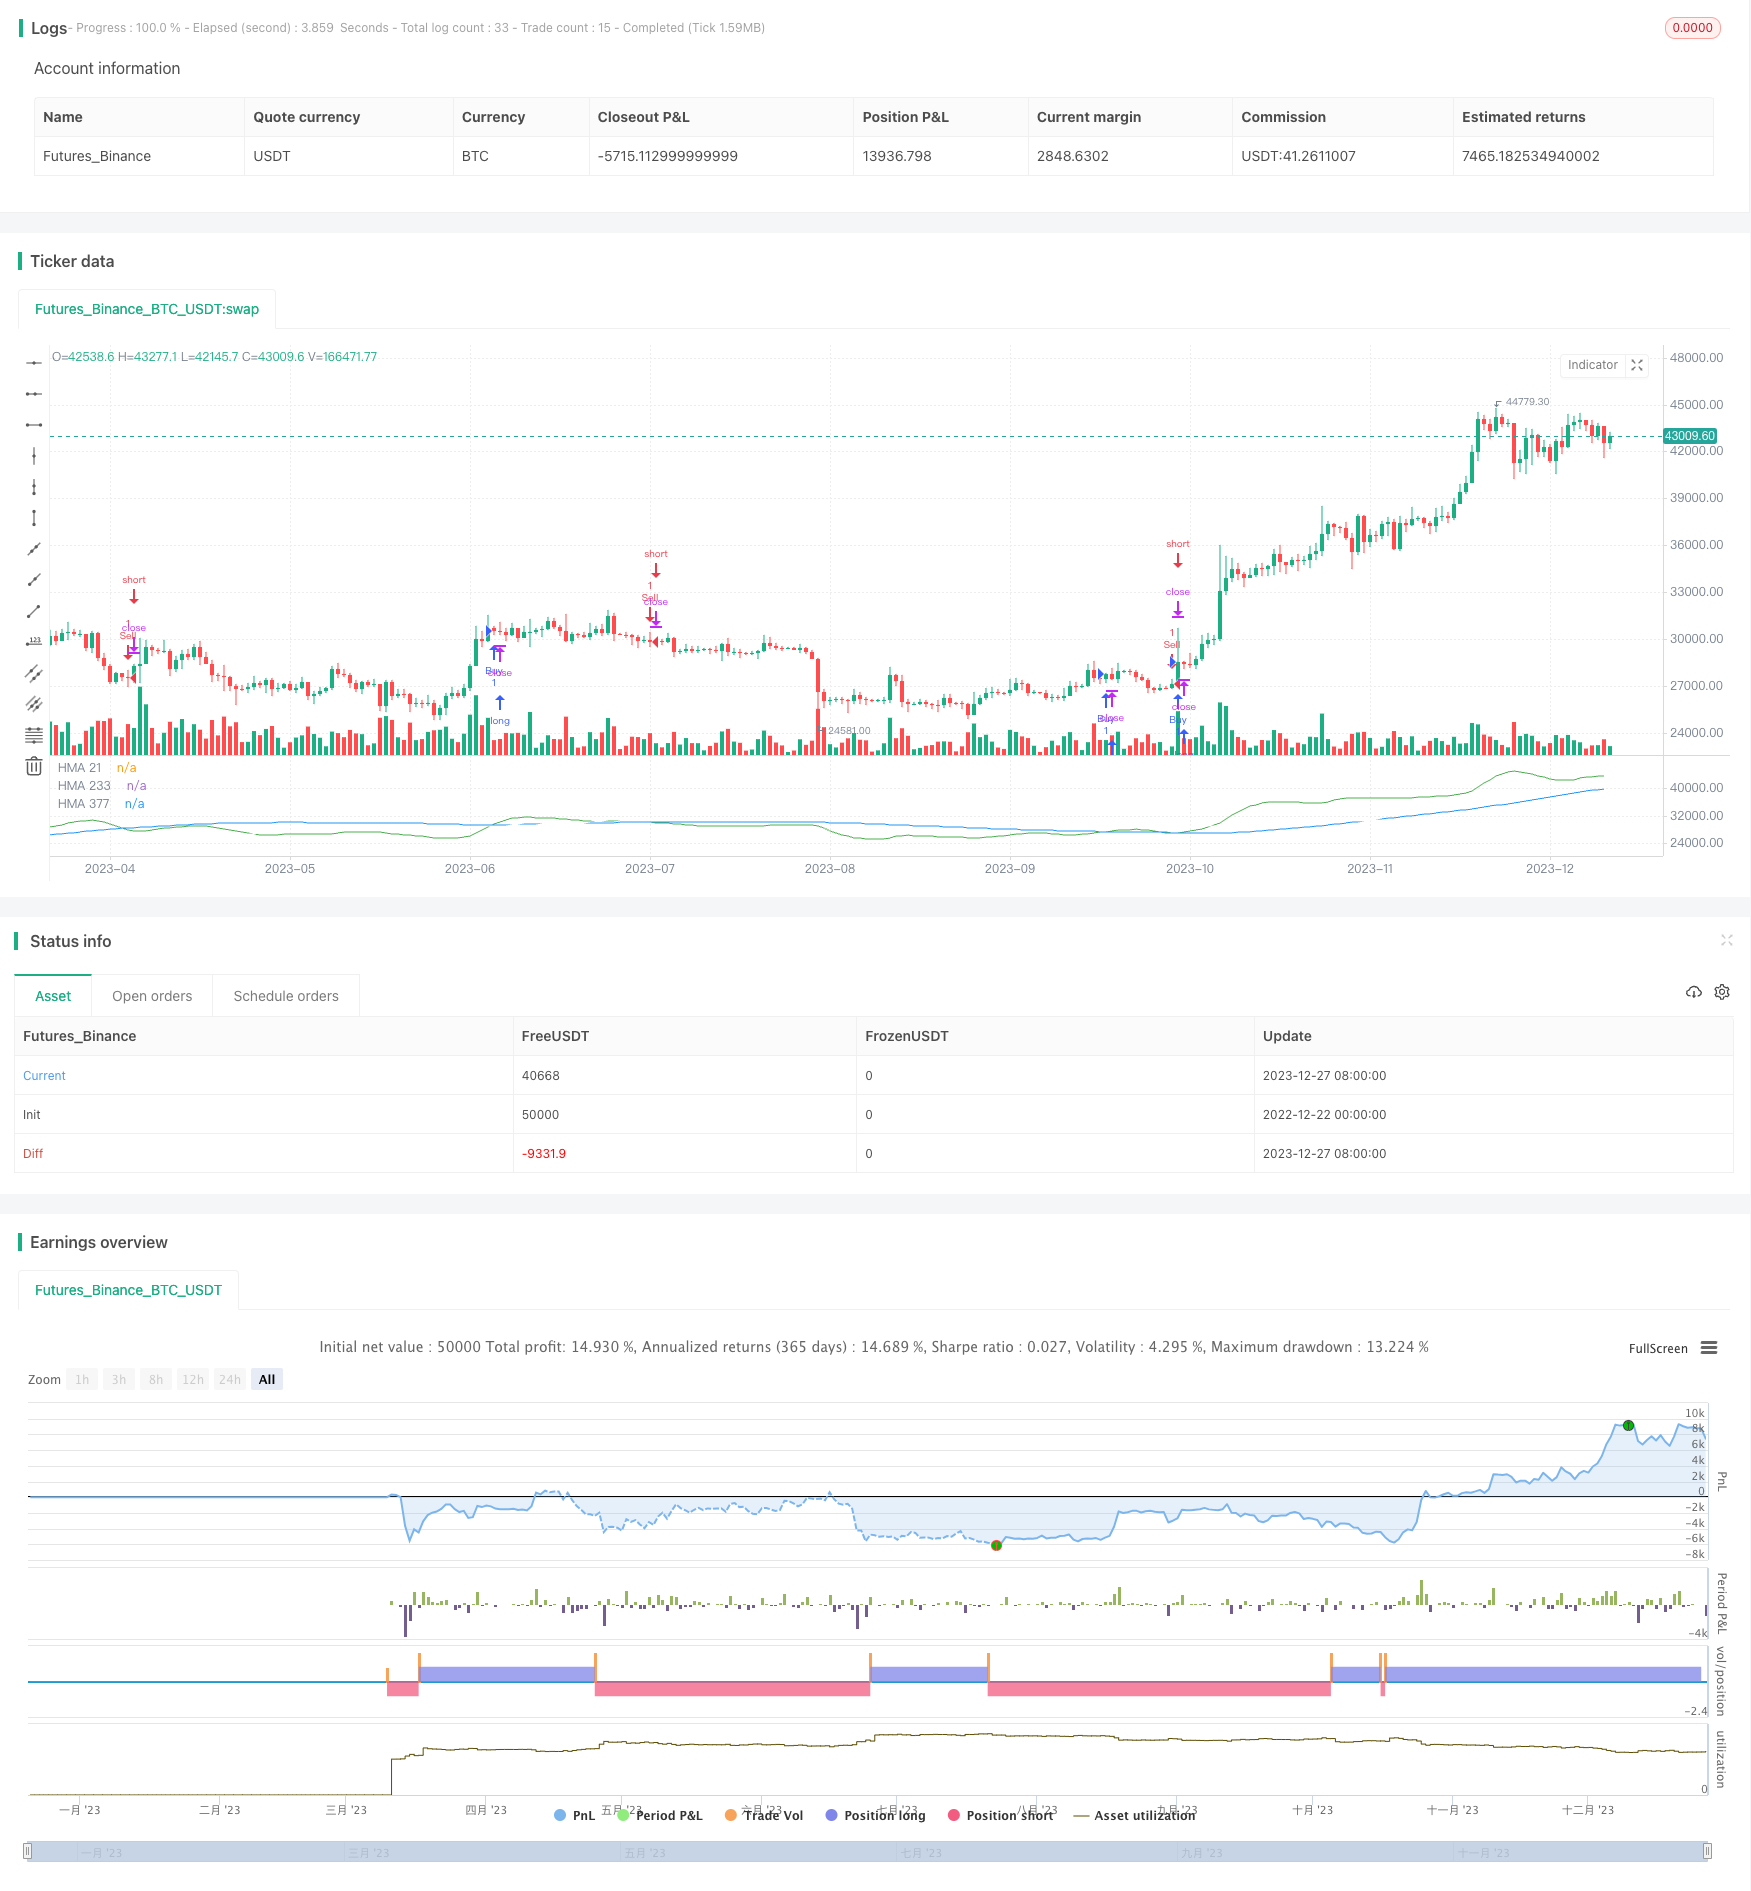
本策略引入了一种基于斐波那契数列的Hull移动平均线(HMA)的交易策略,以识别潜在的买入和卖出信号。该策略运用特定的与斐波那契数列相关的HMA线,旨在为交易环境中可能的入市和退市点提供洞察。
该策略使用与斐波那契数列中数字1、2和3相关的独特HMA线,即HMA 1、HMA 2和HMA 3。当这些HMA线发生交叉时,会生成自动的买入和卖出信号。例如,当HMA 3上穿HMA 2时会产生买入信号,而当HMA 3下穿HMA 2时会产生卖出信号。这些HMA线使用不同的颜色进行可视化表示,以方便识别交易机会。
该策略结合了斐波那契分析和Hull移动平均线的优点。斐波那契分析可用于识别关键的支撑与阻力位,而HMA线平滑价格数据减少噪音,生成更可靠的交易信号。此外,该策略简化了视觉呈现,易于判断趋势的开始和结束。
该策略可能会在价格震荡时产生错误信号。此外,参数设置不当也会影响策略表现。需要调整HMA线的周期长度以适应不同的市场环境。
可以考虑结合其他指标进行信号过滤,例如RSI来避免错误信号。此外,可以测试不同参数组合的实际交易表现,以确定最佳参数。也可以尝试把该策略与其他交易策略组合使用。
本策略充分利用了斐波那契数列在金融市场中的应用优势,与HMA指标的信号过滤能力相结合,形成一个用于发现潜在趋势的有效工具。该策略简单直观,容易实施,值得进一步测试与优化。
||
This strategy introduces a trading approach leveraging Fibonacci-based Hull Moving Averages (HMA) aimed at identifying potential buy and sell signals. By employing distinct HMA lines associated with Fibonacci numbers, it seeks to provide insights into entry and exit points within the trading landscape.
The strategy utilizes specific HMA lines linked to the Fibonacci numbers 1, 2, and 3, denoted as HMA 1, HMA 2, and HMA 3. When these HMA lines cross each other, automatic buy and sell signals are generated. For instance, a buy signal is triggered when HMA 3 crosses above HMA 2, while a sell signal occurs when HMA 3 crosses below HMA 2. These HMA lines are visually distinguished by colors to facilitate spotting trading opportunities.
This strategy combines the strengths of Fibonacci analysis and Hull Moving Averages. Fibonacci analysis helps identify key support and resistance levels, while HMA lines smooth out price data and generate more reliable trading signals. Additionally, the simplified visualization makes determining the start and end of trends straightforward.
The strategy may produce false signals during periods of price whipsaws. Improper parameter settings can also impact performance. The periods of the HMA lines need adjusting to suit different market environments.
Consider adding other indicators like RSI for signal filtration to avoid false signals. Backtesting various parameter combinations to find optimal settings is also worthwhile. Combining this strategy with other trading systems is another enhancement possibility.
This strategy aptly utilizes the efficacy of Fibonacci analysis in financial markets and combines it with the signal filtering capacity of HMA to form an effective instrument for uncovering potential trends. Simple and intuitive, it warrants further testing and refinements.
[/trans]
Source (PineScript)
/*backtest
start: 2022-12-22 00:00:00
end: 2023-12-28 00:00:00
period: 1d
basePeriod: 1h
exchanges: [{"eid":"Futures_Binance","currency":"BTC_USDT"}]
*/

//@version=4
// © Blackynator
strategy("AI Fibonacci HMA Strategy | Buy / Sell Indicator")

// Set the parameters for the moving averages
hma377Period = 377
hma233Period = 233
hma21Period = 21

// Calculate the moving averages
hma377 = hma(close, hma377Period)
hma233 = hma(close, hma233Period)
hma21 = hma(close, hma21Period)

// Plot the moving averages on the chart with different colors and titles
plot(hma377, color=color.white, title="HMA 377")
plot(hma233, color=color.blue, title="HMA 233")
plot(hma21, color=color.green, title="HMA 21")

// Create variables to hold the HMA 21 value and its previous value
hmaValue = hma21
hmaValuePrev = nz(hmaValue[1], hmaValue)

// Create variables to hold the HMA 200 value and its previous value
hma233Value = hma233
hma233ValuePrev = nz(hma233Value[1], hma233Value)

// Check if the HMA 21 has crossed up the HMA 200 and create a buy signal if it has
if (hmaValue > hma233Value) and (hmaValuePrev < hma233ValuePrev)
    strategy.entry("Buy", true)

// Check if the HMA 21 has crossed down the HMA 200 and create a sell signal if it has
if (hmaValue < hma233Value) and (hmaValuePrev > hma233ValuePrev)
    strategy.entry("Sell", false)
Detail
https://www.fmz.com/strategy/436994
Last Modified
2023-12-29 11:24:34