Name
基于海鸥指标的加密货币趋势追踪策略Cryptocurrency-Trend-Following-Strategy-Based-on-Heiken-Ashi
Author
ChaoZhang
Strategy Description
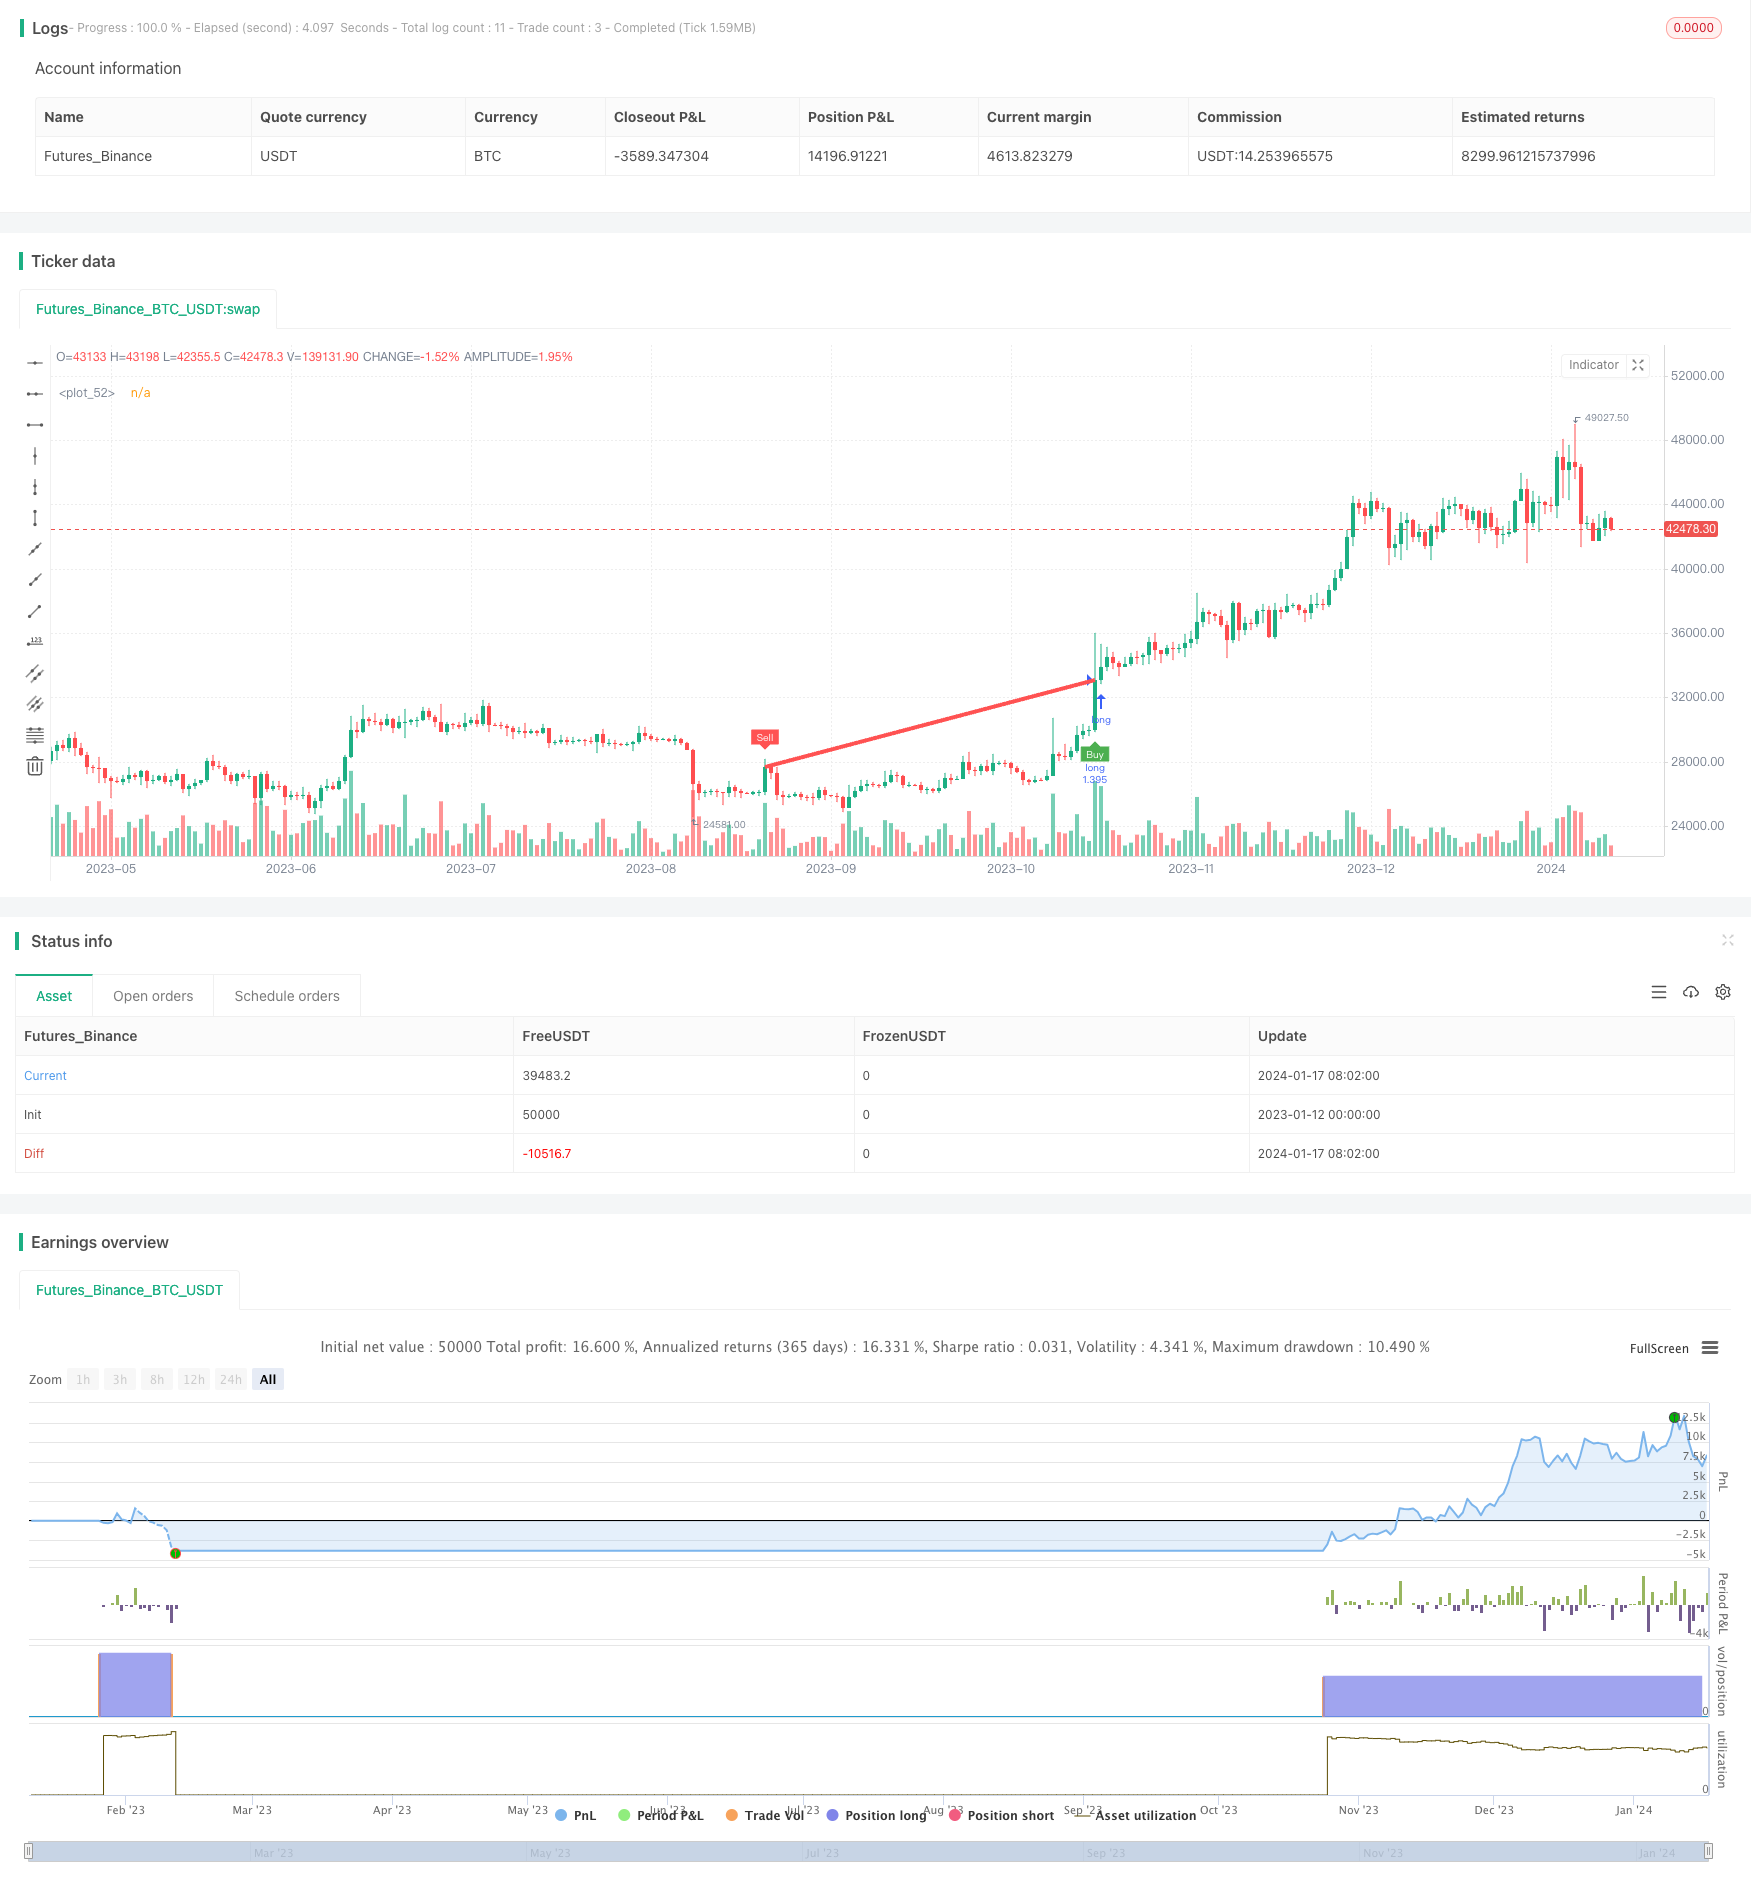
该策略是基于海鸥指标的加密货币趋势追踪策略。它使用两个不同周期的指数移动平均线以及海鸥指标结合多种条件来生成交易信号。该策略旨在识别中长线的价格趋势,在趋势发生转折的时候及时入场。
该策略使用50周期和100周期的EMA均线。同时,它计算海鸥线,这是一种能够过滤市场噪音的特殊蜡烛线。策略使用海鸥线的开盘价、收盘价、最高价和最低价并应用到100周期的EMA线上,以发生更准确的交易信号。
具体来说,当100周期海鸥线的开盘价高于收盘价,并且上一根K线的开盘价低于收盘价时,就是做多的信号。相反,当100周期海鸥线的开盘价低于收盘价,并且上一根K线的开盘价高于收盘价时,就是做空的信号。
该策略结合双EMA系统和海鸥指标,旨在在中长线趋势形成的时候及时捕捉机会。它使用海鸥指标来过滤掉短期市场噪音,使得交易信号更加可靠。
- 使用海鸥指标能有效过滤噪音,使交易信号更加清晰可靠
- 多周期EMA结合海鸥指标,能够识别较强的中长线趋势
- 结合多个条件判断能够避免错失良机
- 该策略特别适用于高波动率的加密货币市场
- 它可配置为仅做多策略,降低操作风险
- 由于使用止损可能过于宽松,存在亏损风险较大的情况
- 在震荡行情中,该策略可能产生较多无效交易
- 海鸥指标还是有一定程度价格滞后,无法完全规避风险
- 无法判断趋势反转点,存在亏损扩大的风险
为了降低风险,可以适当缩小止损幅度,或考虑结合其他指标判断趋势反转。当市场进入震荡区间时,也可以暂停该策略,等待新的趋势产生。
该策略还可以从以下几个方向进行优化:
- 优化EMA的参数,找到最佳的参数组合
- 尝试其他指标替代海鸥指标,如KDJ,MACD等
- 增加价格突破作为入场确认
- 结合波动率指标判断趋势反转
- 使用机器学习方法动态优化参数
基于海鸥指标的加密货币趋势追踪策略,综合考虑了趋势判断、入场时机、止损控制多个方面,对加密货币这种高波动品种具有很好的适应性。该策略通过使用海鸥指标过滤噪音,采用稳健的风险控制方法,能够有效抓住中长线价格趋势带来的交易机会。如果进一步优化参数设置、指标选择和风险控制方法,该策略的表现还具有很大的提升空间。
||
This strategy is a cryptocurrency trend following strategy based on the Heiken Ashi indicator. It uses two exponential moving averages (EMAs) with different periods combined with Heiken Ashi and various conditions to generate trading signals. The goal of this strategy is to identify mid- to long-term price trends and get in timely when trend reversal occurs.
The strategy employs 50- and 100-period EMAs. Meanwhile, it calculates Heiken Ashi candles, which is a special candlestick that can filter out market noise. The strategy uses open, close, high and low prices of the Heiken Ashi candles and applies them to the 100-period EMA to generate more accurate trading signals.
Specifically, when the open price of the 100-period Heiken Ashi is above the close price, and the open price of the previous candle is below the close price, it is a long signal. On the contrary, when the open price of the 100-period Heiken Ashi is below the close price, and the open price of the previous candle is above the close price, it is a short signal.
The strategy combines the dual EMA system and Heiken Ashi indicator, aiming to capture opportunities timely when mid- to long-term trends form. It uses Heiken Ashi to filter out short-term market noise so that trading signals can be more reliable.
- Using Heiken Ashi can effectively filter out noise and make trading signals clearer
- The dual-EMA combined with Heiken Ashi can identify relatively strong mid- to long-term trends
- Multiple condition judgments help avoid missing good chances
- The strategy is especially suitable for the highly volatile cryptocurrency market
- It can be configured as long-only strategy to reduce trading risks
- There may be large losses due to the stop loss being too loose
- The strategy may generate more ineffective trades in range-bound markets
- There is still some degree of lag in Heiken Ashi, unable to completely avoid risks
- It cannot determine trend reversal points, facing risks of expanding losses
To mitigate risks, we can appropriately reduce the stop loss range, or consider combining other indicators to determine trend reversal. When the market enters a range-bound period, we can also pause the strategy and wait for new trends to emerge.
The strategy can also be optimized in the following aspects:
- Optimize EMA parameters to find the best parameter combination
- Try other indicators to replace Heiken Ashi, such as KDJ, MACD etc.
- Add price breakout as entry confirmation
- Incorporate volatility indicators to determine trend reversal
- Use machine learning methods to dynamically optimize parameters
The cryptocurrency trend following strategy based on Heiken Ashi has comprehensively considered aspects like trend judgment, entry timing, stop loss control etc., making it very adaptive to highly volatile assets like cryptocurrencies. By using Heiken Ashi to filter out noise and adopting robust risk control methods, the strategy can effectively seize trading opportunities brought by mid- to long-term price trends. There is still much room for improvement in the strategy's performance if we can further optimize parameters, indicator selections and risk control methods.
[/trans]
Strategy Arguments
| Argument | Default | Description |
|---|---|---|
| v_input_1 | 50 | ma1_len |
| v_input_2 | 100 | ma2_len |
| v_input_3 | true | From Day |
| v_input_4 | true | From Month |
| v_input_5 | 2020 | From Year |
| v_input_6 | 31 | To Day |
| v_input_7 | 12 | To Month |
| v_input_8 | 2020 | To Year |
| v_input_9 | true | onlylong |
| v_input_10 | false | original |
| v_input_11 | 0.075 | sl |
Source (PineScript)
/*backtest
start: 2023-01-12 00:00:00
end: 2024-01-18 00:00:00
period: 1d
basePeriod: 1h
exchanges: [{"eid":"Futures_Binance","currency":"BTC_USDT"}]
*/

//@version=4
//@SoftKill21
strategy(title="CRYPTO HA Strategy", shorttitle="CRYPTO HA Strategy", overlay=true , default_qty_type =strategy.percent_of_equity, default_qty_value =100, commission_type= strategy.commission.percent,commission_value =0.1 )


ma1_len = input(50)
ma2_len = input(100)

fromDay = input(defval = 1, title = "From Day", minval = 1, maxval = 31)
fromMonth = input(defval = 1, title = "From Month", minval = 1, maxval = 12)
fromYear = input(defval = 2020, title = "From Year", minval = 1970)
 //monday and session
// To Date Inputs
toDay = input(defval = 31, title = "To Day", minval = 1, maxval = 31)
toMonth = input(defval = 12, title = "To Month", minval = 1, maxval = 12)
toYear = input(defval = 2020, title = "To Year", minval = 1970)

startDate = timestamp(fromYear, fromMonth, fromDay, 00, 00)
finishDate = timestamp(toYear, toMonth, toDay, 00, 00)
time_cond = true


//First Moving Average data
o = ema(open, ma1_len)
c = ema(close, ma1_len)
h = ema(high, ma1_len)
l = ema(low, ma1_len)

// === HA calculator ===
ha_t = heikinashi(syminfo.tickerid)
ha_o = security(ha_t, timeframe.period, o)
ha_c = security(ha_t, timeframe.period, c)
ha_h = security(ha_t, timeframe.period, h)
ha_l = security(ha_t, timeframe.period, l)

//Second Moving Average data

o2 = ema(ha_o, ma2_len)
c2 = ema(ha_c, ma2_len)
h2 = ema(ha_h, ma2_len)
l2 = ema(ha_l, ma2_len)

// === Color def ===
ha_col = o2 > c2 ? color.white : color.lime

sell = o2 > c2 and o2[1] < c2[1] and time_cond
buy = o2 < c2 and o2[1] > c2[1] and time_cond
plotshape(buy, color=color.green, text= "Buy", location= location.belowbar,style= shape.labelup, textcolor=color.white, size = size.tiny, title="Buy Alert",editable=false, transp=60)
plotshape(sell, color=color.red, text= "Sell", location= location.abovebar,style= shape.labeldown, textcolor=color.white, size = size.tiny, title="Sell Alert", editable=false, transp=60)

trendColor = buy ? color.red : sell ? color.green : na
plot( buy ? close: sell  ? close : na , color=trendColor, style=plot.style_line, linewidth=4, editable=false)


onlylong=input(true)
original=input(false)

if(onlylong)
    strategy.entry("long",1,when=buy)
    strategy.close("long",when=sell)
if(original)
    strategy.entry("long",1,when=buy)
    strategy.entry("short",0,when=sell)

sl = input(0.075)
strategy.exit("closelong", "long" , loss = close * sl / syminfo.mintick, alert_message = "sl point")
strategy.exit("closeshort", "short" , loss = close * sl / syminfo.mintick, alert_message = "sl point")
Detail
https://www.fmz.com/strategy/439378
Last Modified
2024-01-19 17:40:52