Name
基于点数止损止盈的移动止损策略Moving-Stop-Loss-Strategy-Based-on-Points-Take-Profit-and-Stop-Loss
Author
ChaoZhang
Strategy Description
该策略的核心思想是利用EMA和WMA的交叉作为入场信号,并结合基于点数计算的止损止盈来进行交易。其最大的优势在于可以非常灵活和精确的控制风险,通过调整点数大小来控制止损止盈的幅度。
当EMA由下向上突破WMA时产生做多信号;当EMA由上向下跌破WMA时,产生做空信号。进入仓位后,会实时计算入场点位,并在此基础上设置止损和止盈。例如设置止损20点,止盈100点,那么具体的止损价位会是入场价减去20点合约价值,止盈价位是入场价加上100点合约价值。这样来控制风险和盈利。
同时,策略还会结合当前盘口与历史止损进行比较,调整移动止损位置,实现流动止损追价。
相比普通的固定点数或百分比止损,该策略最大的优势在于可以非常灵活和精确的控制风险。调整点数的大小就可以直接影响到止损幅度的大小。这对于不同品种非常适用,可以根据市场的波动频率和幅度来微调。
另外,流动止损也是一个非常实用的功能。它可以根据行情的实时变化来跟踪调整止损位置,在保证风险控制的同时,可以尽可能追求更大的盈利。
该策略的风险主要来自于EMA和WMA这两个指标本身。当行情出现剧烈变动时,它们常常会发出错误信号,容易止损。这时,建议适当放宽止损点数,或考虑替换其他指标组合。
另一个风险点在于止损止盈难以同时兼顾。如果追求更高止盈,通常需要承担更大风险,这很容易在行情转向时止损。所以,止损止盈的设置需要仔细测试和评估。
该策略可以从以下几个方向进行优化:
- 测试不同参数的EMA和WMA组合,找到最佳参数;
- 尝试其他指标如MACD、KDJ等替换或结合,看是否可以提高胜率;
- 评估不同止损止盈点数的风险收益情况,找到最优配置;
- 研究不同品种的特点,调整参数适应不同市场; 5.加入机器学习算法,实现参数的动态优化。
该策略核心思路简单清晰,以EMA和WMA指标为基础,运用基于点数计算的止损止盈机制进行风险控制。策略优势在于风险控制精确灵活,可按不同市场适当调整。后续可从入场信号、参数选择、止损机制等方面进行深度优化,使策略更适应复杂多变的市场环境。
||
The core idea of this strategy is to use the crossover of EMA and WMA as entry signals, and incorporate take profit and stop loss based on points calculation for trading. Its biggest advantage is that it can very flexibly and precisely control risks by adjusting the number of points to control the amplitude of take profit and stop loss.
When EMA crosses WMA upwards, a long signal is generated. When EMA crosses WMA downwards, a short signal is generated. After entering positions, entry price will be calculated in real time, and stop loss and take profit will be set based on that. For example, set stop loss to 20 points and take profit to 100 points, then the specific stop loss price will be entry price minus 20 points * contract value, and take profit price will be entry price plus 100 points * contract value. This is how risk and profit are controlled.
At the same time, the strategy will also combine current market prices with historical stop loss to adjust the moving stop loss position and realize trailing stop loss.
Compared with fixed points or percentage stop loss, the biggest advantage of this strategy is that it can very flexibly and precisely control risks. By adjusting the number of points, the amplitude of stop loss can be directly impacted. This applies very well to different varieties, and parameters can be fine tuned based on market fluctuation frequency and amplitude.
In addition, trailing stop loss is also a very practical function. It can track and adjust stop loss position based on real-time market changes, while ensuring risk control, and maximize possible profits.
The main risks of this strategy come from the EMA and WMA indicators themselves. When there is violent market movement, they often give out wrong signals, easily leading to stop loss. In this case, it is recommended to appropriately loosen the number of stop loss points, or consider replacing other indicator combinations.
Another risk point is that it is difficult to balance stop loss and take profit. Pursuing higher take profit often requires undertaking bigger risks, which can easily lead to stop loss when market turns. Therefore, the configuration of stop loss and take profit needs careful testing and evaluation.
This strategy can be optimized in the following aspects:
- Test different parameter combinations of EMA and WMA to find the optimal one;
- Try other indicators like MACD, KDJ etc. to replace or combine, and see if win rate can be improved;
- Evaluate risk reward of different points configurations for stop loss and take profit, and find the optimal setting;
- Study characteristics of different varieties, and adjust parameters to adapt to different markets;
- Incorporate machine learning algorithms to realize dynamic optimization of parameters.
The core idea of this strategy is simple and clear, using EMA and WMA as basis, and employing points based stop loss and take profit mechanism for risk control. The advantage of the strategy lies in precise and flexible risk control, which can be adjusted accordingly for different markets. Follow-up optimizations can be done in entry signals, parameter selection, stop loss mechanism etc., to make the strategy adapt better to the complex and ever-changing market environments.
[/trans]
Strategy Arguments
| Argument | Default | Description |
|---|---|---|
| v_input_1 | 10 | EMA period |
| v_input_2 | 20 | WMA period |
| v_input_3 | 20 | (?PIP CALCULATION)TP PIP |
| v_input_4 | 20 | SL PIP |
Source (PineScript)
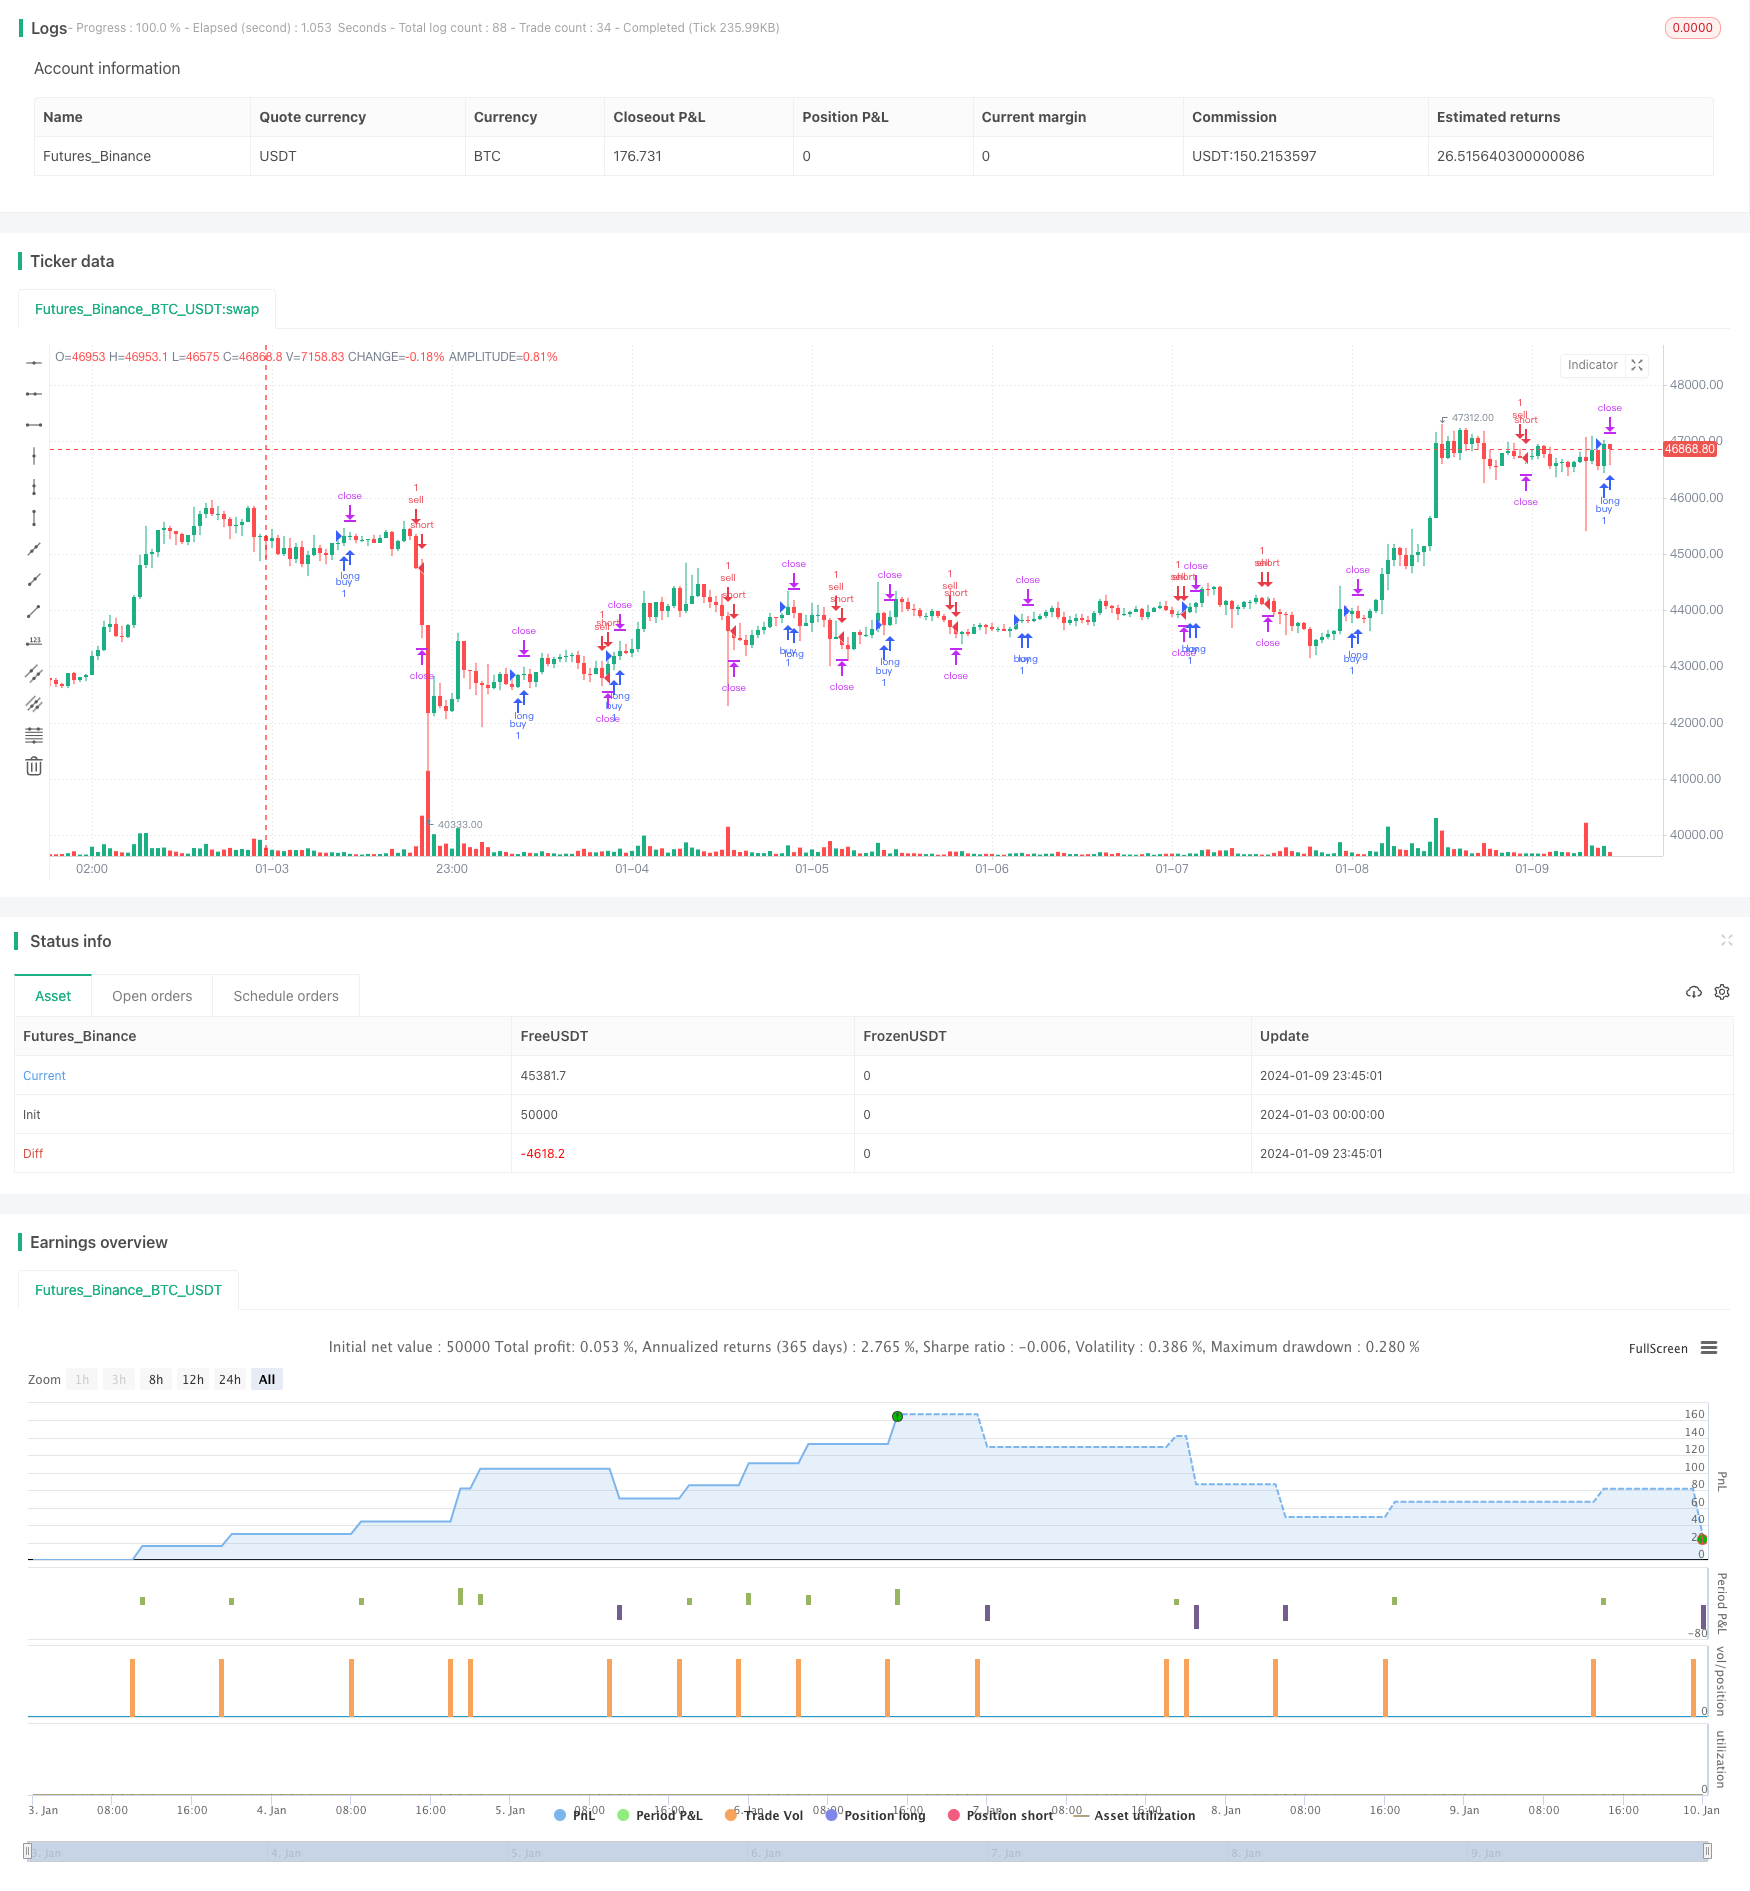
/*backtest
start: 2024-01-03 00:00:00
end: 2024-01-10 00:00:00
period: 45m
basePeriod: 5m
exchanges: [{"eid":"Futures_Binance","currency":"BTC_USDT"}]
*/

// inspiration script from: @ahmad_naquib
// inspiration script link: https://www.tradingview.com/script/tGTV8MkY-Two-Take-Profits-and-Two-Stop-Loss/
// inspiration strategy script name: Two Take Profits and Two Stop Loss


////////////
// Do not use this strategy, it's just an exmaple !! The goal from this script is to show you TP and SL based on PIPS
////////////


//@version=5
strategy('SL & TP based on Pips', "PIP SL & TP", overlay=true, initial_capital=1000)

// MA
ema_period = input(title='EMA period', defval=10)
wma_period = input(title='WMA period', defval=20)
ema = ta.ema(close, ema_period)
wma = ta.wma(close, wma_period)

// Entry Conditions
long = ta.crossover(ema, wma) and nz(strategy.position_size) == 0
short = ta.crossunder(ema, wma) and nz(strategy.position_size) == 0

// Pips Calculation
pip1 = input(20, title = "TP PIP", group = "PIP CALCULATION") * 10 * syminfo.mintick
pip2 = input(20, title = "SL PIP", group = "PIP CALCULATION") * 10 * syminfo.mintick

// Trading parameters
var bool LS = na
var bool SS = na

var float EP = na // Entry Position
var float TVL = na
var float TVS = na
var float TSL = na
var float TSS = na

var float TP1 = na
//var float TP2 = na
var float SL1 = na
///var float SL2 = na

// SL & TP Values
// there's also SL2 and TP2 in case you want to add them to your script,
//also you can add a break event in the strategy.entry section.

if short or long and strategy.position_size == 0
    EP := close
    SL1 := EP - pip2 * (short ? -1 : 1)
    //SL2 := EP - pip2 * (short ? -1 : 1)

    TP1 := EP + pip1 * (short ? -1 : 1)
    //TP2 := EP + pip1 * 2 * (short ? -1 : 1)


// current trade direction
LS := long or strategy.position_size > 0
SS := short or strategy.position_size < 0

// adjust trade parameters and trailing stop calculations
TVL := math.max(TP1, open) - pip1[1]
TVS := math.min(TP1, open) + pip1[1]
TSL := open[1] > TSL[1] ? math.max(TVL, TSL[1]) : TVL
TSS := open[1] < TSS[1] ? math.min(TVS, TSS[1]) : TVS

//if LS and high > TP1
    //if open <= TP1
        //SL2 := math.min(EP, TSL)

//if SS and low < TP1
    //if open >= TP1
        //SL2 := math.max(EP, TSS)


// Closing conditions
// and those are a closing conditions in case you want to add them.

//close_long = LS and open < SL2
//close_short = SS and open > SL2

// Buy
if (long and not SS)
    strategy.entry('buy', strategy.long)
strategy.exit('exit1', from_entry='buy', stop=SL1, limit=TP1, qty_percent=100)
//strategy.exit('exit2', from_entry='buy', stop=SL2, limit=TP2)

// Sell
if (short and not LS)
    strategy.entry('sell', strategy.short)
strategy.exit('exit3', from_entry='sell', stop=SL1, limit=TP1, qty_percent=100)
//strategy.exit('exit4', from_entry='sell', stop=SL2, limit=TP2)

// Plots
// those are plots for the lines of The tp and sl. they are really useful, and in the next update I will use a filling option.

a = plot(strategy.position_size > 0 ? SL1 : na, color=color.new(#af0829, 30), linewidth = 2, style=plot.style_linebr)
b = plot(strategy.position_size < 0 ? SL1 : na, color=color.new(#af0829, 30), linewidth = 2, style=plot.style_linebr)

c = plot(strategy.position_size > 0 ? TP1 : na, color=color.new(#2e7e00, 30), linewidth = 2, style=plot.style_linebr)
d = plot(strategy.position_size < 0 ? TP1 : na, color=color.new(#2e7e00, 30), linewidth = 2, style=plot.style_linebr)

g = plot(strategy.position_size >= 0 ? na : EP, color=color.new(#ffffff, 50), style=plot.style_linebr)
h = plot(strategy.position_size <= 0 ? na : EP, color=color.new(#ffffff, 50), style=plot.style_linebr)


// those are plot for the TP2 and SL2, they are optional if you want to add them.

//e = plot(strategy.position_size > 0 ? TP2 : na, color=color.new(#00ced1, 0), style=plot.style_linebr)
//f = plot(strategy.position_size < 0 ? TP2 : na, color=color.new(#00ced1, 0), style=plot.style_linebr)


//those are the plot for the ema and wma strategy for short and long signal. they are not really a good strategy, I just used them as an example
//but you have the option to plot them or not.
// do not use this strategy, it's just an exmaple !! The goal from this script is to show you TP and SL based on PIPS

//plot(ema, title='ema', color=color.new(#fff176, 0))
//plot(wma, title='wma', color=color.new(#00ced1, 0))
Detail
https://www.fmz.com/strategy/438334
Last Modified
2024-01-11 11:04:57