Name
基于熊力量指标的量化交易策略Bear-Power-Strategy
Author
ChaoZhang
Strategy Description
熊力量策略是基于熊力量指标的量化交易策略。该策略通过计算每日收盘价相对于开盘价的力量来判断市场目前的多空状态,以此来产生交易信号。当熊力量超过设定的卖出水平时,做空;当熊力量低于设定的买入水平时,做多。该策略适合中短线交易。
熊力量策略的核心指标是熊力量指标(Bear Power Indicator)。该指标基于收盘价与开盘价的差值来计算市场的多空力量。具体计算公式如下:
如果收盘价 < 开盘价: 如果前一日收盘价 > 前一日开盘价: 熊力量 = max(收盘价 - 开盘价,最高价 - 最低价) 否则: 熊力量 = 最高价 - 最低价 如果收盘价 >= 开盘价: 如果前一日收盘价 > 前一日开盘价: 熊力量 = max(前一日收盘价 - 最低价,最高价 - 收盘价) 否则: 熊力量 = max(开盘价 - 最低价,最高价 - 收盘价)
该公式的基本思路是,如果当日收盘价 < 开盘价,说明当日市场出现了向下的力量,这是熊市的表现;如果收盘价 >= 开盘价,说明当日市场出现了向上的力量或盘整,属于多头市场。公式中包含前一日数据,是为了确保力量的连续性。
在计算出熊力量指标后,策略会设定一个卖出线和买入线。当熊力量上穿卖出线时,做空;当熊力量下穿买入线时,做多。
熊力量策略具有以下几个优势:
-
策略信号来源独特,具有一定的先见性。熊力量指标在传统技术分析中很少被使用,提供了一个新的视角来判断市场结构。
-
策略回撤可控,具有一定的风险管理功能。相比大幅追踪市场的策略,熊力量策略只在市场出现明确的多头和空头信号时才发出交易指令,可以有效避免不必要的亏损。
-
实现难度不大,容易实际应用。该策略只需要收盘价和开盘价即可实现,代码逻辑不复杂。
-
可根据需要灵活优化。可根据不同市场调整买卖线位置,设置反转交易逻辑等来优化策略。
熊力量策略也存在以下一些风险:
-
市场可能长期处于震荡态势,策略无法有效捕捉趋势产生的巨大利润。这时,策略的获利可能主要来源于买卖差价。
-
熊力量指标并不是百分之百可靠的判断指标,买卖信号可能会失效。这时需要结合其他指标来验证。
-
策略只根据一两个指标生成信号,容易产生过度优化。实际交易中,单一策略容易失效,需要组合多个策略来进行资产配置和风险管理。
-
策略没有考虑交易成本和滑点的影响。实际交易中这两者的影响不能忽视,需要在实现策略时引入这两个因素的模拟。
熊力量策略可以从以下几个方向进行优化:
-
增加止损逻辑。当市场走势与策略信号不符时,及时止损可以减少亏损。
-
增加其他指标的验证。比如结合均线、波动率等指标来验证熊力量指标的信号,防止失效。
-
引入machine learning模型。使用神经网络、SVM等对熊力量指标进行训练,建立更可靠的多空判断模型。
-
优化买卖线位置。可以通过回测找出最佳的参数组合。也可以设置自适应的买卖线,根据market profile来动态调整。
-
增加趋势跟踪机制。识别出趋势市场后,改为趋势跟踪策略,以获利更高。
熊力量策略基于独特的熊力量指标判断市场结构,在熊市中做空获得收益。该策略回撤可控,实现难度不大,适合中短线交易。我们还可以从引入止损、添加信号验证、机器学习等多个维度对该策略进行优化,使其成为稳定可靠的量化策略。
||
The Bear Power strategy is a quantitative trading strategy based on the Bear Power indicator. This strategy generates trading signals by calculating the power of daily closing prices relative to opening prices to determine the current long/short status of the market. It goes short when the bear power exceeds a set sell level, and goes long when the bear power falls below a set buy level. This strategy is suitable for medium-term trading.
The core indicator of the Bear Power strategy is the Bear Power Indicator. This indicator calculates the long/short power of the market based on the difference between the closing price and the opening price. The specific calculation formula is as follows:
If Close < Open:
If Prev Close > Prev Open:
Bear Power = max(Close - Open, High - Low)
Else:
Bear Power = High - Low
If Close >= Open: If Prev Close > Prev Open: Bear Power = max(Prev Close - Low, High - Close) Else: Bear Power = max(Open - Low, High - Close)
The basic idea behind this formula is that if the closing price < the opening price today, it indicates a downward force in the market today, which is characteristic of a bear market; if the closing price >= the opening price, it indicates an upward force or consolidation in the market today, characteristic of a bull market. The formula contains previous day's data to ensure continuity of power.
After calculating the Bear Power indicator, the strategy will set a sell line and a buy line. It goes short when the bear power crosses above the sell line, and goes long when the bear power crosses below the buy line.
The Bear Power strategy has the following advantages:
-
The source of the trading signals is unique and has some leading capability. The Bear Power indicator is rarely used in traditional technical analysis, providing a new perspective to judge market structure.
-
The strategy has controllable drawdowns and some risk management functionality. Compared to strategies that aggressively track the market, the Bear Power strategy only issues trading orders when clear long/short signals appear in the market, which can effectively avoid unnecessary losses.
-
The strategy has low implementation difficulty and is easy to apply in practice. It only relies on closing and opening prices to function, with uncomplicated logic.
-
It can be flexibly optimized according to needs. For example, the buy/sell line positions can be adjusted for different markets, reverse trading logic can be added, etc.
The Bear Power strategy also has some risks:
-
The market may stay range-bound for long periods, and the strategy will fail to capture huge profits generated by trends. In such cases, the strategy's profit may mainly come from bid-ask spreads.
-
The Bear Power Indicator is not 100% reliable for judgments, and its signals may fail. Other indicators are needed to verify its signals in such cases.
-
The strategy relies solely on one or two indicators for signals, making it prone to overfitting. Single strategies tend to fail in actual trading. Multiple strategies should be combined for asset allocation and risk management.
-
Trading costs and slippage are not considered in the strategy. In practical trading their impact is non-negligible and needs to be introduced in simulations.
The Bear Power strategy can be optimized in the following aspects:
-
Add stop loss logic. Timely stop loss when market movements conflict signals can reduce losses.
-
Add validation from other indicators. Combine indicators like moving averages and volatility to validate Bear Power signals and prevent failures.
-
Introduce machine learning models. Use neural networks, SVM etc. to train the Bear Power indicator and establish more reliable long/short judgment models.
-
Optimize buy/sell line positions. Find optimal parameter combinations via backtesting. Adaptive lines can also be used based on market profile.
-
Add trend following mechanisms. Identify trending markets and switch to trend following strategies for higher profits.
The Bear Power strategy identifies market structures and profits from short positions in bear markets based on the unique Bear Power indicator. This strategy has controllable drawdowns and is easy to implement, suitable for medium-term trading. We can further optimize it in aspects like adding stops, signal verification, machine learning etc., to make it a robust quantitative strategy.
[/trans]
Strategy Arguments
| Argument | Default | Description |
|---|---|---|
| v_input_1 | 10 | SellLevel |
| v_input_2 | true | BuyLevel |
| v_input_3 | false | Trade reverse |
Source (PineScript)
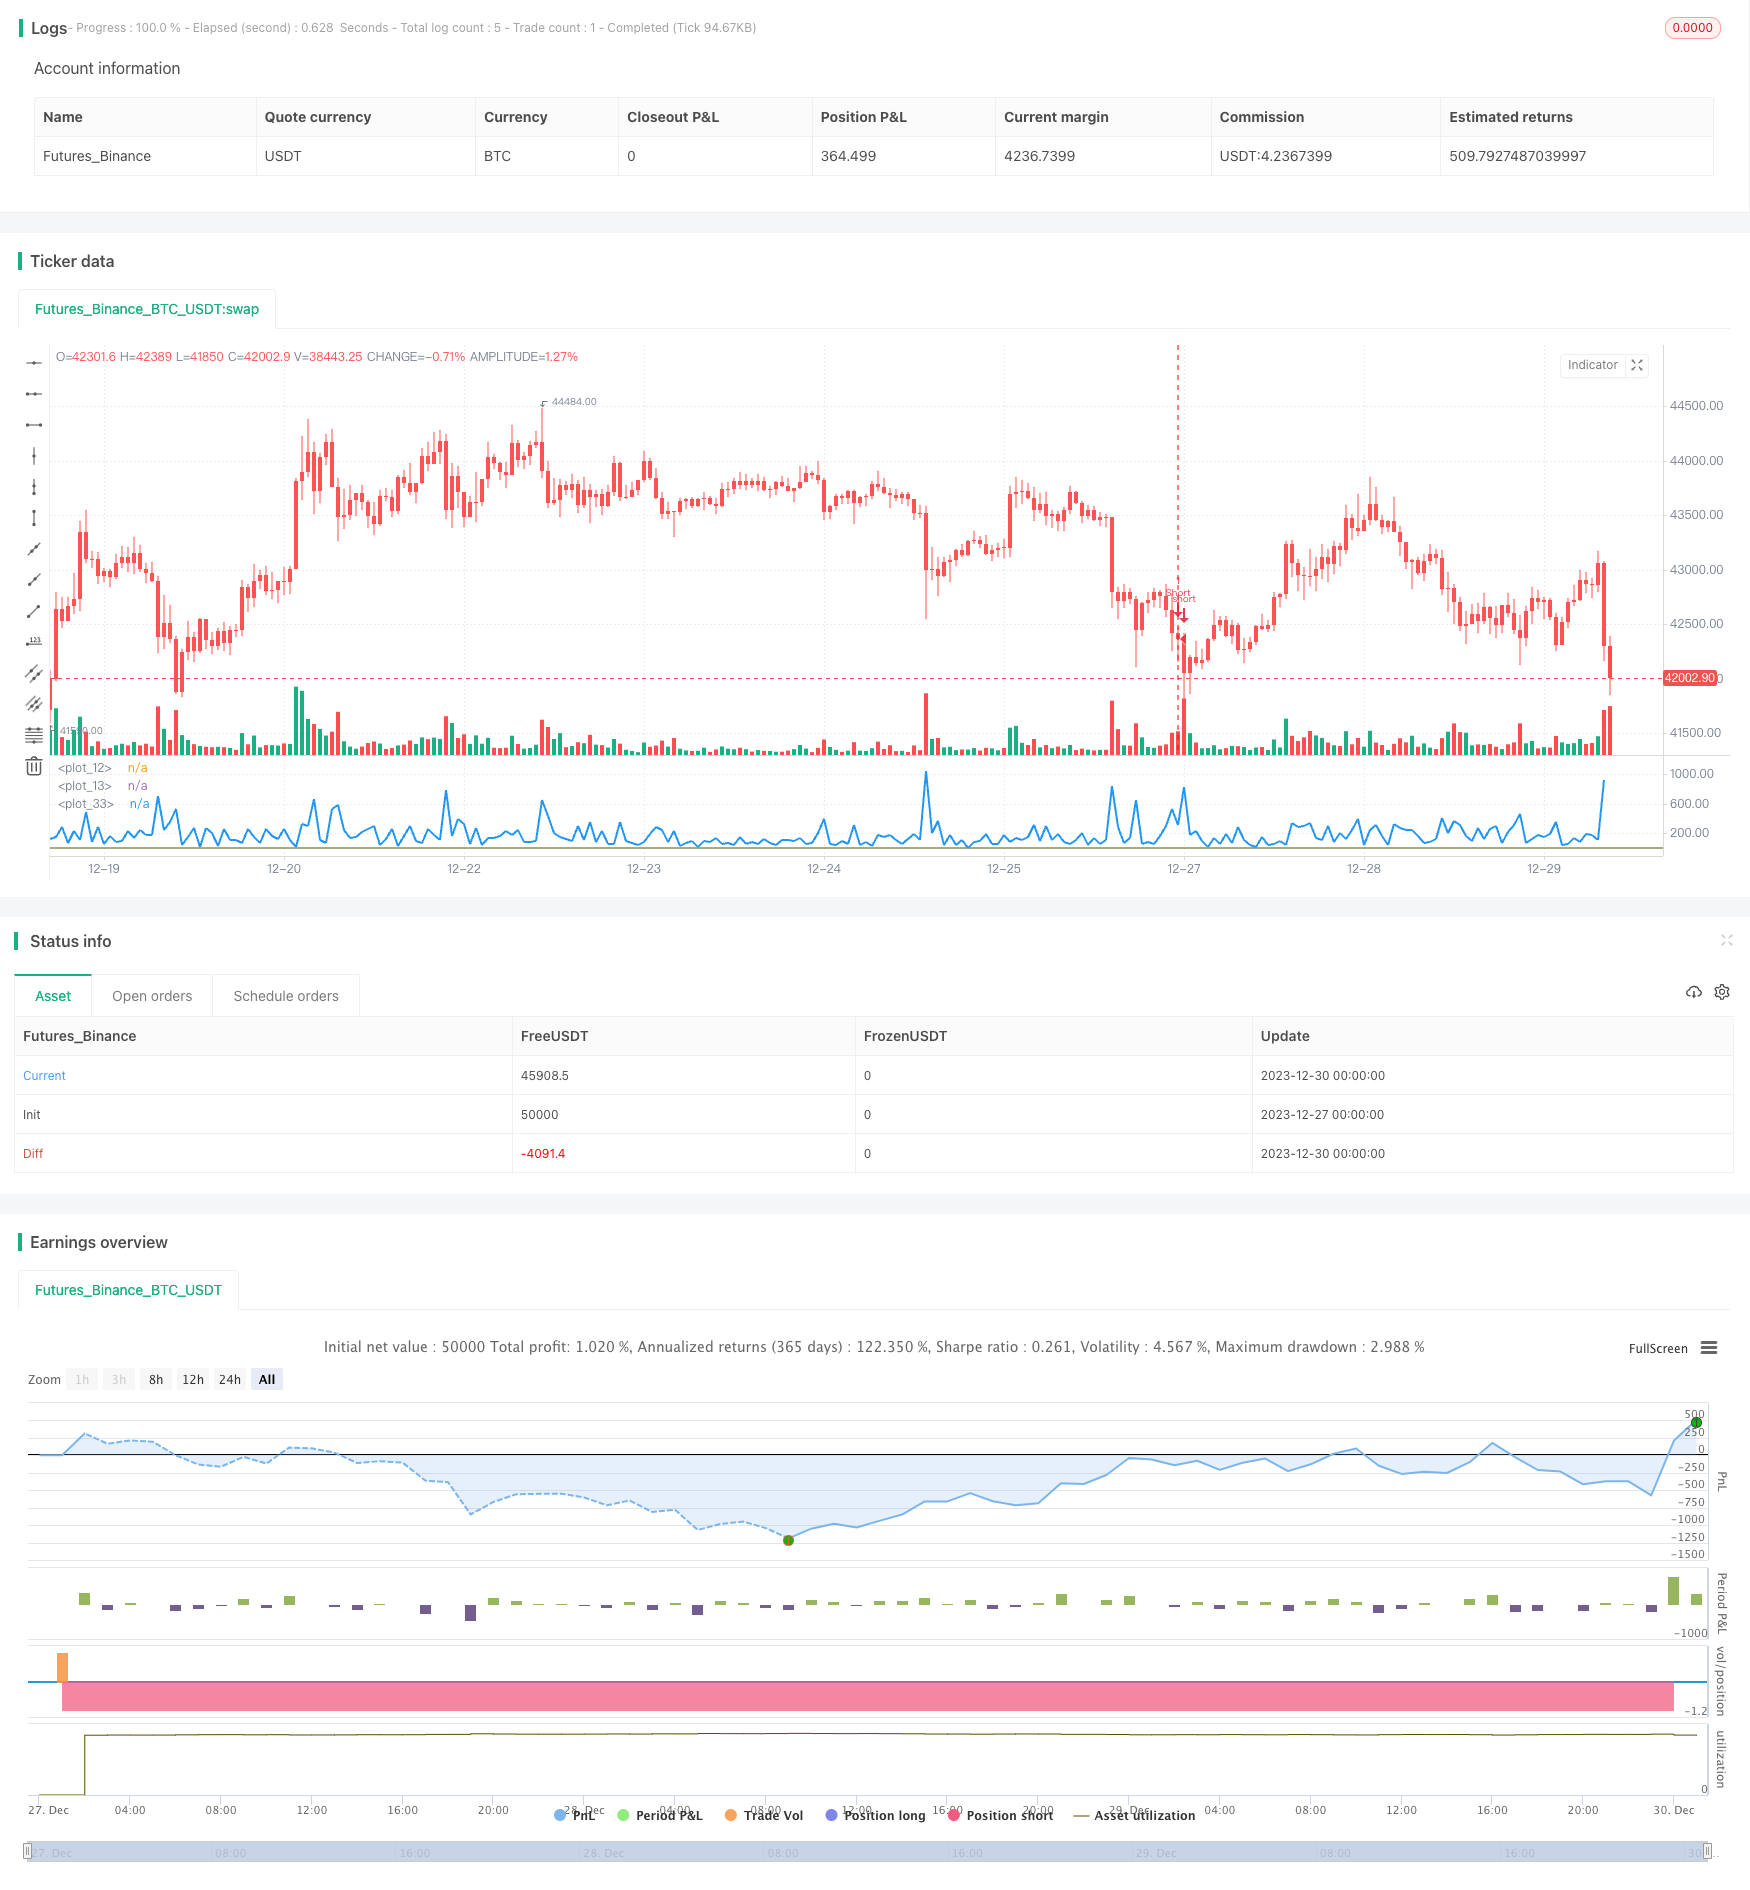
/*backtest
start: 2023-12-27 00:00:00
end: 2023-12-30 01:00:00
period: 1h
basePeriod: 15m
exchanges: [{"eid":"Futures_Binance","currency":"BTC_USDT"}]
*/

//@version=2
////////////////////////////////////////////////////////////
//  Copyright by HPotter v1.0 26/01/2017
//  Bear Power Indicator
//  To get more information please see "Bull And Bear Balance Indicator"
//  by Vadim Gimelfarb.
///////////////////////////////////////////////////////////
strategy(title = "Bear Power Strategy")
SellLevel = input(10, step=0.01)
BuyLevel = input(1, step=0.01)
reverse = input(false, title="Trade reverse")
hline(SellLevel, color=red, linestyle=line)
hline(BuyLevel, color=green, linestyle=line)
value =  iff (close < open ,
             iff (close[1] > open ,  max(close - open, high - low), high - low),
                 iff (close > open,
                     iff(close[1] > open, max(close[1] - low, high - close), max(open - low, high - close)),
                         iff(high - close > close - low,
                             iff (close[1] > open, max(close[1] - open, high - low), high - low),
                              iff (high - close < close - low,
                               iff(close > open, max(close - low, high - close),open - low),
                                 iff (close > open, max(close[1] - open, high - close),
                                  iff(close[1] < open, max(open - low, high - close), high - low))))))
pos = iff(value > SellLevel, -1,
	   iff(value <= BuyLevel, 1, nz(pos[1], 0)))
possig = iff(reverse and pos == 1, -1,
          iff(reverse and pos == -1, 1, pos))
if (possig == -1)
    strategy.entry("Short", strategy.short)
if (possig == 1)
    strategy.entry("Long", strategy.long)
barcolor(possig == -1 ? red: possig == 1 ? green : blue )
plot(value, style=line, linewidth=2, color=blue)
Detail
https://www.fmz.com/strategy/437644
Last Modified
2024-01-04 15:13:16