Name
基于相对强弱指标RSI交易策略RSI-Trading-Strategy
Author
ChaoZhang
Strategy Description
[trans]
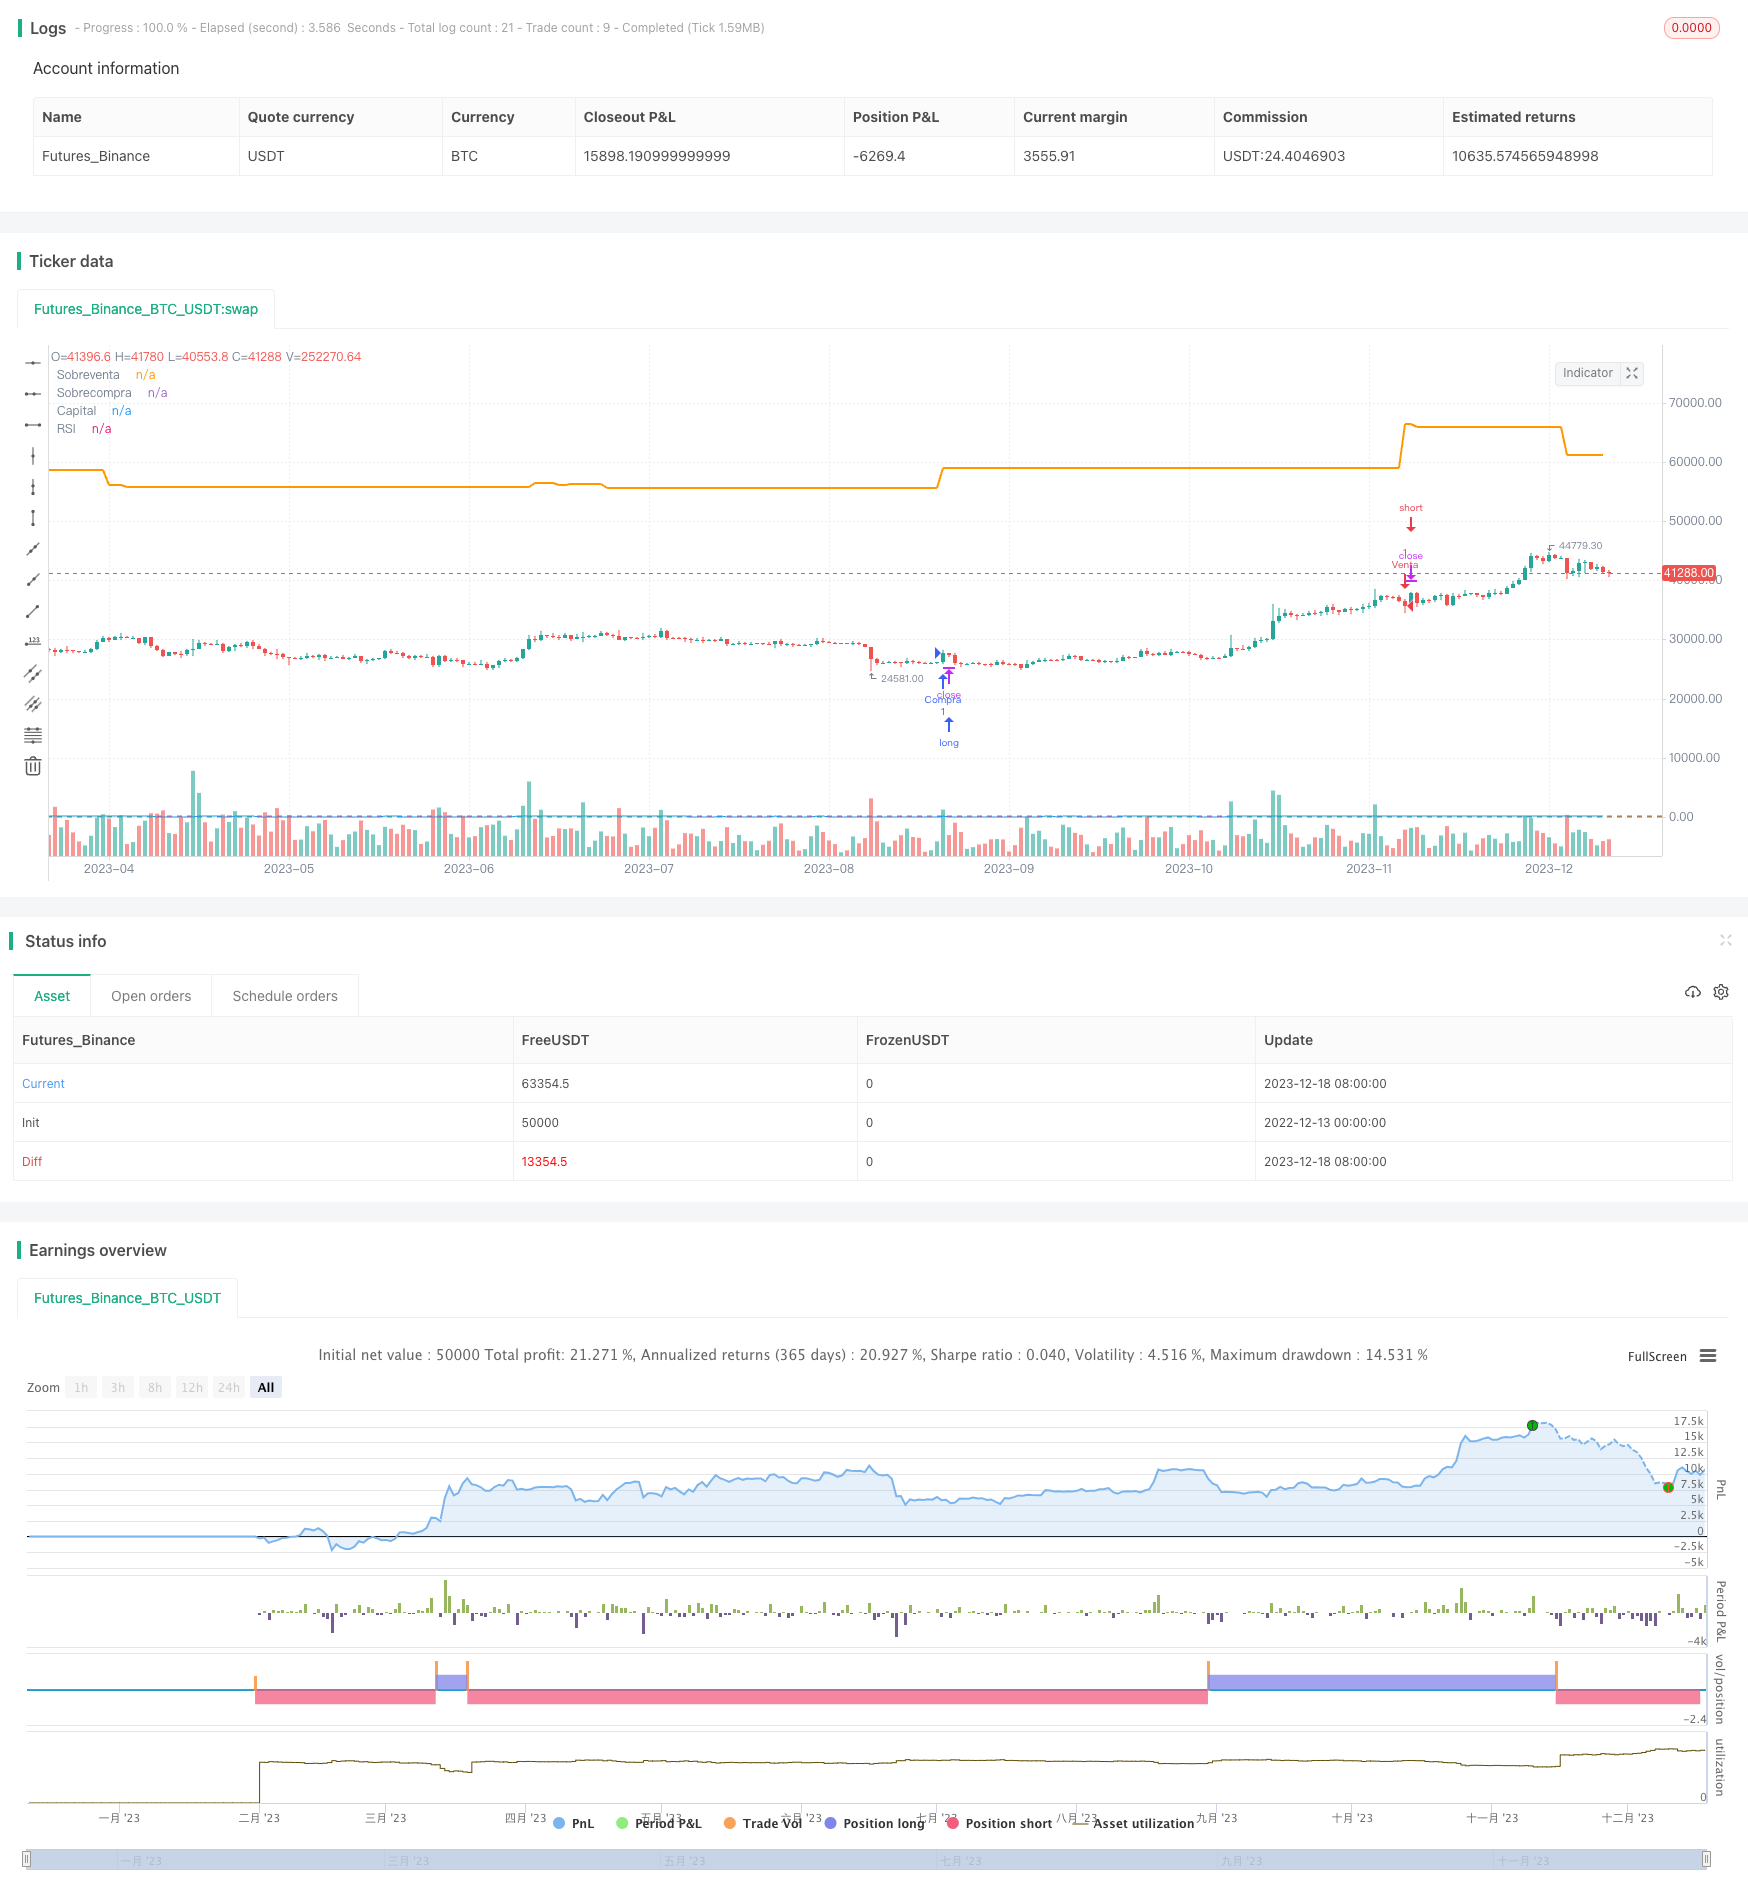
本策略是一个基于相对强弱指标(RSI)的数字货币自动交易策略。它通过计算BTC/USDT的RSI指标,设定超买超卖阈值,形成买入和卖出信号,以实现自动做多做空。
本策略的核心原理是运用RSI指标判断市场的超买超卖状态。RSI指标反映价格变动的速度和强度,值范围0-100。当RSI>70时代表市场超买,应选择卖出;当RSI<30时代表市场超卖,应选择买入。
具体来说,策略通过计算长度为14周期的RSI值,并设定超卖线为30,超买线为70。当RSI上穿超卖线30时产生买入信号;当RSI下穿超买线70时产生卖出信号。利用这两个信号形成做多和做空决策。
此外,策略还设置了保护性止损,即RSI重新回穿超买线和超卖线时选择了平仓。这可以锁定盈利,也可减少损失。
本策略最大的优势在于运用RSI指标判断市场超买超卖状态,这是一种成熟可靠的交易策略思路。RSI指标可以抓住价格反转机会,为我们的交易决策提供信号。
另外,策略参数可调节灵活。我们可以根据市场情况,调整RSI周期参数,或者调整超买超卖阈值参数,优化策略效果。这为我们提供了足够的灵活性。
最后,策略加入了保护性止损机制,可以有效控制风险,这也是策略的一大亮点。
本策略最大的风险在于RSI信号可能发出错误交易信号。当价格出现异常突破时,RSI指标并不能完美判断超买超卖状态,这时就可能造成交易损失。
此外,预设的超买超卖阈值也可能不适合所有的市场情况。我们需要联合更多指标来确认RSI信号,避免信号错误。
最后,止损线设置也会带来一定风险。我们必须根据不同市场来调整止损位置,否则可能过早止损或止损幅度过大。这需要我们持续测试和优化。
本策略可以从以下几个方向进行优化:
-
优化RSI参数,调整周期长度和超买超卖阈值,寻找最佳参数组合
-
增加更多指标进行组合,形成更可靠的交易信号,如K线形态,MACD等
-
优化资金管理策略,如根据价格调整止损线位置,动态交易仓位管理等
-
进行回测优化,测试不同市场下策略表现,不断迭代策略逻辑
-
增加机器学习模型,利用AI模型辅助判断交易信号
通过这些优化,可以提升策略的胜率和盈利能力,减少误差交易的发生。
本策略Overall, this RSI trading strategy utilizes the RSI indicator to determine overbought and oversold market conditions and generate trade signals accordingly. Its core principle, adjustable parameters, protective stop loss, and potential optimization directions make it a viable algorithmic trading system. However, we need to be aware of the risks like false signals and constantly test and iterate the strategy to achieve best performance. With further refinements, this RSI-based approach can become a robust tool for crypto currency trading.
||
This is an automated cryptocurrency trading strategy based on the Relative Strength Index (RSI) indicator. It calculates the RSI metric of BTC/USDT to set overbought and oversold thresholds for generating buy and sell signals, enabling automated long and short positions.
The core principle of this strategy is to use the RSI indicator to judge overbought and oversold market conditions. The RSI reflects the speed and magnitude of price changes with a range of 0-100. When RSI>70 the market is overbought and selling should be chosen; when RSI<30 the market is oversold and buying should be chosen.
Specifically, the strategy calculates 14-period RSI values and sets oversold line at 30 and overbought line at 70. When RSI crosses over the oversold line 30 upwards a buy signal is generated; when RSI crosses down the overbought line 70 a sell signal is generated. These two signals form long and short decisions.
In addition, protective stop losses are built in when RSI crosses back over the overbought and oversold lines for closing positions. This allows locking in profits and reducing losses.
The biggest advantage of this strategy is using the RSI indicator to judge overbought/oversold market conditions, which is a proven and reliable trading principle. RSI can capture price reversal opportunities and provide informative signals for our decisions.
Also, the adjustable parameters provide flexibility. We can optimize the RSI period and threshold values based on changing market dynamics to improve performance. This gives us sufficient adaptivity.
Lastly, the protective stop loss mechanism effectively controls risks, also a major highlight of the strategy.
The biggest risk is that RSI signals may provide incorrect trading guidance. When there are abnormal price penetrations, RSI cannot perfectly determine overbought/oversold levels, which can lead to trading losses.
Additionally, the preset overbought/oversold thresholds may not suit all market conditions. We need to incorporate more indicators to confirm RSI signals and avoid false signals.
Finally, stop loss positioning also introduces some risks. We have to dynamically adjust stop levels based on different markets, otherwise stops may trigger prematurely or have too large loss size. This requires continuous testing and tuning.
The strategy can be improved in the following aspects:
-
Optimize RSI parameters like period length and threshold values to find best combination
-
Incorporate more indicators like candlestick patterns and MACD to form more reliable trade signals
-
Refine capital management like adaptive stop loss levels and dynamic position sizing
-
Backtest for performance under various markets and continuously improve logic
-
Add machine learning models to aid in predicting signals
These optimizations can improve win rate, profitability, and reduce erroneous trades.
Overall, this RSI trading strategy utilizes the RSI indicator to determine overbought and oversold market conditions and generate trade signals accordingly. Its core principle, adjustable parameters, protective stop loss, and potential optimization directions make it a viable algorithmic trading system. However, we need to be aware of the risks like false signals and constantly test and iterate the strategy to achieve best performance. With further refinements, this RSI-based approach can become a robust tool for crypto currency trading.
[/trans]
Strategy Arguments
| Argument | Default | Description |
|---|---|---|
| v_input_1 | 14 | Longitud RSI |
| v_input_2 | 30 | Nivel de sobreventa |
| v_input_3 | 70 | Nivel de sobrecompra |
| v_input_4 | 20 | Capital inicial (USDT) |
Source (PineScript)
/*backtest
start: 2022-12-13 00:00:00
end: 2023-12-19 00:00:00
period: 1d
basePeriod: 1h
exchanges: [{"eid":"Futures_Binance","currency":"BTC_USDT"}]
*/

//@version=4
strategy("Estrategia RSI para BTC/USDT", overlay=true)

// Parámetros de la estrategia
length = input(14, title="Longitud RSI")
oversold_level = input(30, title="Nivel de sobreventa")
overbought_level = input(70, title="Nivel de sobrecompra")
initial_capital = input(20, title="Capital inicial (USDT)")

// Cálculo del RSI
rsi_value = rsi(close, length)

// Variable para el capital actual
var float capital = na

// Inicializar el capital con el capital inicial
if barstate.isfirst
    capital := initial_capital

// Condiciones de entrada
long_signal = crossover(rsi_value, oversold_level)
short_signal = crossunder(rsi_value, overbought_level)

// Condiciones de salida
exit_long_signal = crossunder(rsi_value, overbought_level)
exit_short_signal = crossover(rsi_value, oversold_level)

// Operaciones de compra y venta
if long_signal
    strategy.entry("Compra", strategy.long)
    strategy.close("Venta", strategy.short)
    capital := strategy.equity
if short_signal
    strategy.entry("Venta", strategy.short)
    strategy.close("Compra", strategy.long)
    capital := strategy.equity

// Estilo de visualización
plot(rsi_value, title="RSI", color=color.blue)
hline(oversold_level, "Sobreventa", color=color.green)
hline(overbought_level, "Sobrecompra", color=color.red)

// Mostrar el capital actual en el gráfico
plot(capital, title="Capital", color=color.orange, linewidth=2, style=plot.style_linebr)
Detail
https://www.fmz.com/strategy/435961
Last Modified
2023-12-20 14:20:26