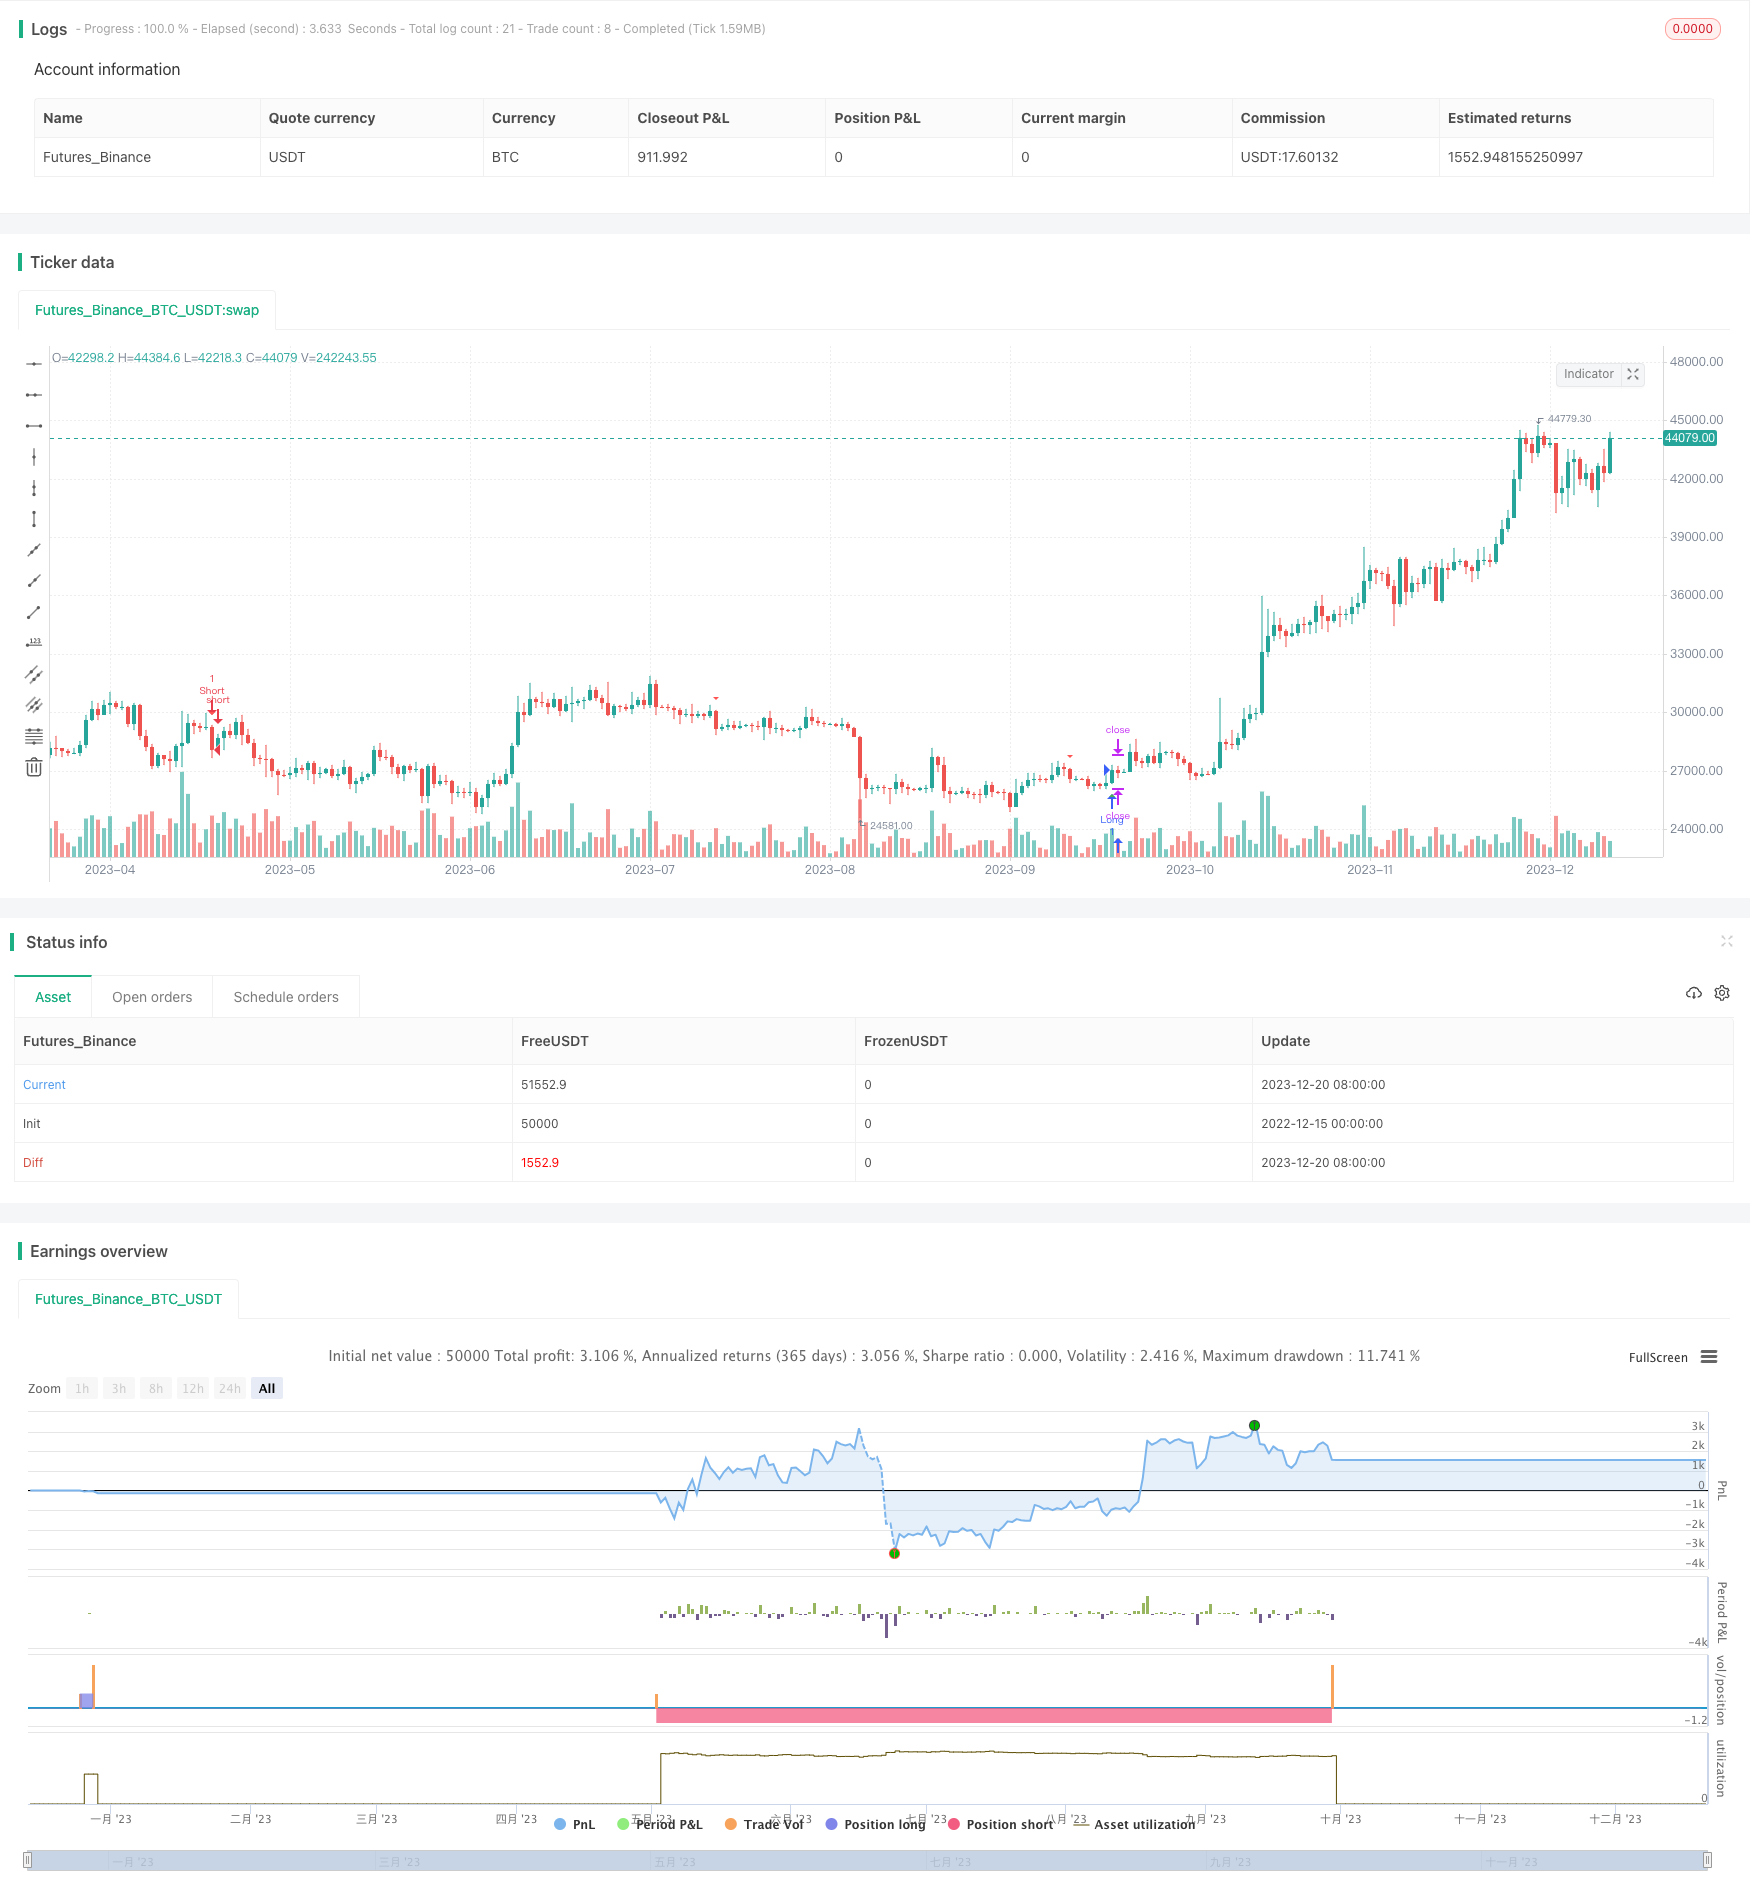
Name
基于简单移动平均线的量化交易策略The-moving-average-crossover-strategy-is-a-quantitative-trading-strategy
Author
ChaoZhang
Strategy Description
均线交叉策略(Moving Average Crossover Strategy)是一种基于简单移动平均线的量化交易策略。该策略通过计算不同周期的简单移动平均线,在它们交叉时产生买入和卖出信号。
具体来说,该策略计算9日线和45日线的简单移动平均线。当价格上穿9日线和45日线时,产生买入信号;当价格下穿9日线和45日线时,产生卖出信号。
该策略的核心逻辑基于移动平均线的“金叉死叉”原理。移动平均线能够有效地过滤市场噪音,指示大趋势的变化。当短期平均线上穿长期平均线时,表示价格开始进入上升趋势;当短期平均线下穿长期平均线时,表示价格开始进入下跌趋势。
具体来说,该策略采用9日线和45日线的简单移动平均线。9日线代表短期趋势,45日线代表长期趋势。当价格上穿9日线和45日线时,表示股价在短期和长期上都处于上升通道,因此产生买入信号;当价格下穿9日线和45日线时,表示股价的上升势头逐渐减弱,因此产生卖出信号。
从代码逻辑上看,该策略首先计算9日线和45日线的简单移动平均线,然后通过ta.crossover和ta.crossunder函数判断均线的金叉和死叉。在产生买入和卖出信号时,使用plotshape函数在K线图上绘制出三角形和倒三角形的信号图形。
此外,该策略还设定了长仓和短仓的止损逻辑。具体来说,在开仓后,会提取前一根K线的最高价和最低价作为止损价格。这能锁定盈利,避免出现超大亏损。
- 使用双均线设定,能捕捉到中长期趋势的变化,避免被短期市场噪音影响,提高信号质量。
- 结合止损策略,可以有效控制风险,锁定盈利。
- 策略逻辑简单易懂,容易实施。
- 资金利用率高,可以进行充分复利。
- 双均线策略容易产生死叉串thrust信号,可能导致过多无效交易。
- 止损价格设定可能过于保守,无法持续跟踪趋势行情。
- 参数选择不当可能导致交易频率过高或过低。
- 无法适应特大行情的反转。
对策:
- 优化均线参数,降低无效交易率
- 优化止损逻辑,采用趋势跟踪止损
- 结合其他指标过滤信号
- 人工干预,避免特大行情反转
该策略还有进一步优化的空间:
-
使用自适应移动平均线或指数移动平均线,能更好地捕捉趋势变化。
-
增加波动率指标等过滤信号,避免在震荡行情中产生错误信号。
-
采用参数优化方法,寻找最佳的参数组合。
-
在止损逻辑中加入趋势跟踪机制,使止损线能够灵活跟踪价格。
-
增加对大级别支持阻力的判断,避免在关键价格区域产生错误信号。
-
结合机器学习模型进一步过滤信号质量。
均线交叉策略是一种简单实用的趋势跟踪策略。它能够有效过滤噪声,捕捉价格中长期趋势的变化。结合适当的止损逻辑后,能够在控制风险的基础上进行趋势交易。该策略逻辑简单易于实施,适合量化交易的初学者开始实践。通过进一步的优化和改进,该策略可以成为量化交易体系中的一个有效组成部分。
||
The moving average crossover strategy is a quantitative trading strategy based on simple moving averages (SMA). It generates buy and sell signals when different period SMA crossovers occur.
Specifically, this strategy calculates the 9-period and 45-period SMA. When the price crosses above both SMA lines, a buy signal is generated. When the price crosses below both lines, a sell signal is triggered.
The core logic of this strategy is based on the "golden cross" and "dead cross" principles of moving averages. Moving averages can effectively filter out market noise and indicate major trend changes. When the shorter-term MA crosses above the longer-term MA, it signals an upward trend reversal. The opposite crossover signals a downtrend.
In particular, this strategy uses the 9-period and 45-period simple moving averages. The 9-period line represents short-term trends while the 45-period line captures longer-term moves. When the price crosses above both SMA lines, it indicates the price is in upward channels both short-term and long-term, hence triggering a long entry. The opposite crossover suggests weakening upside momentum and prompts exit signals.
From the code perspective, the strategy first computes the 9-period and 45-period SMA values. It then uses the ta.crossover and ta.crossunder functions to detect golden crosses and dead crosses between the two MA lines. When buy and sell signals are triggered, plotshape functions draw triangles and inverted triangles on the price chart.
In addition, stop-loss logic is implemented to manage trade exits. Specifically, the high and low prices of the previous bar are extracted as the stop-loss price after opening new trades. This allows the strategy to lock in gains and prevent huge losses.
-
The dual moving average setup captures mid-to-long term trend shifts while filtering out short-term noises, improving signal quality.
-
The stop-loss mechanism effectively controls risks and locks in profits.
-
Simple and easy-to-implement logic, suitable for beginners.
-
High capital utilization for compounding gains.
-
Dual MA strategies tend to generate whipsaws and invalid signals during choppy markets.
-
Conservative stop loss placement unable to track trends effectively.
-
Suboptimal parameter selection may lead to overtrading or insufficient trade frequency.
-
Unable to adapt to huge trend reversals.
Solutions:
-
Optimize MA parameters to reduce false signals
-
Implement trend-following dynamic stops
-
Add filters using other indicators
-
Manual override around major reversals
Further improvements for the strategy:
-
Use adaptive or exponential MAs to better capture trends.
-
Add volatility filter to avoid false signals during ranging markets.
-
Perform parameter optimization for best parameter combinations.
-
Incorporate trend-following mechanisms into stop-loss logic.
-
Add support-resistance analysis to avoid signals around key levels.
-
Leverage machine learning to further filter signal quality.
The moving average crossover system is a simple yet effective trend following approach. By filtering out noise and tracking mid-term trends, it generates quality signals. With proper stop losses, it enables risk-managed trend trading. The simple logic also makes it ideal for beginners to put into practice. Further optimizations can integrate this strategy as an effective component of overall quant systems.
[/trans]
Strategy Arguments
| Argument | Default | Description |
|---|---|---|
| v_input_1 | 9 | Fast SMA Length |
| v_input_2 | 45 | Slow SMA Length |
Source (PineScript)
/*backtest
start: 2022-12-15 00:00:00
end: 2023-12-21 00:00:00
period: 1d
basePeriod: 1h
exchanges: [{"eid":"Futures_Binance","currency":"BTC_USDT"}]
*/

//@version=5
strategy("SMA Crossover Strategy", overlay=true)

// Input parameters
fast_length = input(9, title="Fast SMA Length")
slow_length = input(45, title="Slow SMA Length")

// Calculate moving averages
fast_sma = ta.sma(close, fast_length)
slow_sma = ta.sma(close, slow_length)

// Buy condition
buy_condition = ta.crossover(close, fast_sma) and ta.crossover(close, slow_sma)

// Sell condition
sell_condition = ta.crossunder(close, fast_sma) and ta.crossunder(close, slow_sma)

// Calculate stop loss levels
prev_low = request.security(syminfo.tickerid, "1D", low[1], lookahead=barmerge.lookahead_on)
prev_high = request.security(syminfo.tickerid, "1D", high[1], lookahead=barmerge.lookahead_on)

// Plot signals on the chart
plotshape(buy_condition, style=shape.triangleup, location=location.belowbar, color=color.green, size=size.small)
plotshape(sell_condition, style=shape.triangledown, location=location.abovebar, color=color.red, size=size.small)

// Strategy exit conditions
long_stop_loss = sell_condition ? prev_low : na
short_stop_loss = buy_condition ? prev_high : na

strategy.exit("Long Exit", from_entry="Long", when=sell_condition, stop=long_stop_loss)
strategy.exit("Short Exit", from_entry="Short", when=buy_condition, stop=short_stop_loss)

strategy.entry("Long", strategy.long, when=buy_condition)
strategy.entry("Short", strategy.short, when=sell_condition)
Detail
https://www.fmz.com/strategy/436232
Last Modified
2023-12-22 13:28:01