Name
基于订单块的动量突破策略The-Order-Block-Momentum-Breakout-Strategy
Author
ChaoZhang
Strategy Description
该策略通过识别价格中的订单块来寻找具有突破动量的价格区间,并在出现买卖信号时进入市场。订单块标志着机构参与的区域,是市场较大力量的体现。因此,订单块信号出现时,具有较高的概率出现趋势性的价格变动。
订单块分为多头订单块和空头订单块两种。多头订单块定义为一根向下K线(红色K线)之后紧跟多根向上K线(绿色K线)。空头订单块则定义为一根向上K线(绿色K线)之后紧跟多根向下K线(红色K线)。
要识别出订单块,需要同时满足以下几个条件:
-
K线颜色发生转变:从上一根K线到当前K线,K线颜色发生了转换(例如从红变绿,或从绿变红)。这表明可能有机构结束之前的趋势,准备开启新的趋势。
-
后续K线颜色方向一致:在达到参数periods指定的根数后,后续的K线保持同一颜色方向(例如多头订单块后面全部是绿色K线)。这表明新的趋势得到加强和确认。
-
涨跌幅超过阈值:从订单块的开盘价到后续K线收盘价的涨跌幅超过参数threshold的设定(默认0)。这确保新的趋势有足够的力度和影响力。
当同时满足以上三个条件时,即可认定识别出一个订单块信号。
当识别出多头订单块时,产生买入信号;当识别出空头订单块时,产生卖出信号。
考虑到订单块信号的不确定性以及可能的再次测试,策略在订单块信号出现时不会直接入市,而是通过画线、报警等方式提醒交易者注意。交易者可以选择在订单块价格区域附近适当部署限价单,等待价格触发后进入趋势。
订单块标志着机构资金和庞大交易量的参与,代表市场力量的转换。因此订单块信号具有一定的预见性和准确性,可以预先捕捉到潜在的突破方向。这为搭乘趋势提供了有利的定位和把握时机。
策略的参数包括历史K线数量、突破动量的幅度等都可以通过参数进行调整,从而针对不同市场环境和交易者风格进行优化,提高策略的适应性。
策略不会在订单块信号出现时实际入市,而是设置报警,并通过离场限价单的方式构建仓位。这种方式让交易者可以控制具体的入场点和风险。即使订单块信号判断错误,也只会导致限价单不会触发,风险可控。
由于订单块标志的是一个区间,后续价格再次回调该区间的概率较大。因此订单块信号并不能视为标准的入场信号使用,而是作为预警信息,需要交易者自己进一步判断入场时机。
订单块的参数设置(历史K线数量、幅度阈值等)如果不当,会容易在正常的 Sideways 区间产生假信号。这需要交易者对市场有一定的敏感性和判断力,避免参数盲目优化。
由于订单块信号并非百分之百可靠,交易者在获得信号时需要进一步分析判断当前信号的可信度,这增加了一定的人工工作量。对信号质量的不同判断也可能导致交易表现的差异。
可以在订单块信号出现时,结合别的指标对趋势方向和力度进行判断,例如结合 MACD、RSI 等,过滤掉参数设置导致的错误信号,提升信号的准确性。
不同市场和不同交易品种可以对参数,例如K线数量、涨跌幅阈值等进行测试和优化,使其更符合当下市场环境。也可以设置参数的自适应功能,根据市场波动性和风险偏好自动调整。
目前策略仅作为信号提示工具,交易者需要自行判断入场时机。我们可以针对订单块价格区间开发自动下单机制,在满足一定条件时自动入场;并结合止损等方法设定退出逻辑,降低人工判断的要求,提高策略的自动化程度。
该策略通过有效识别订单流量集中的价格区间,发掘市场中隐含的动量信息,为搭乘趋势的价格突破提供了有利的定位和把握时机。与简单追踪趋势的方法相比,订单块策略具有一定的头部识别能力和主动性。当与参数优化、风控方法结合使用时,可以成为一个有效的趋势策略。但交易者需要警惕错误信号的产生,并对每个信号的质量进行判断。今后有必要继续优化该策略的自动化程度,以减少主观判断带来的偏差。
||
This strategy identifies order blocks in price action to locate momentum bursts and enters the market when buy/sell signals emerge. Order blocks represent institutional participation and significant market forces. Thus order block signals have a higher probability of leading to trending price action.
There are two types of order blocks - bullish and bearish. A bullish order block is defined as the last red candle followed by consecutive green candles. A bearish order block is the last green candle followed by consecutive red candles.
To identify an order block, the following criteria must be met simultaneously:
-
Candle color change - The candle color changes from the previous candle to the current one (e.g. from red to green, or green to red). This suggests institutions may be ending the previous trend and initiating a new potential trend.
-
Consistent direction afterwards - The subsequent candles maintain the same color direction for the number of periods specified in the parameters (e.g. all green candles after a potential bullish block). This confirms the new trend.
-
Breakout exceeds threshold - The percentage price change from the open of the order block candle to the close of the final confirmation candle exceeds the threshold parameter (default 0). This ensures strong enough momentum.
When all three criteria are true, an order block signal is identified.
A buy signal is generated when detecting a bullish order block. A sell signal emerges when a bearish order block is identified.
Considering the uncertainty of order flow signals, the strategy does not immediately enter the market. It alerts the trader and allows price limit orders to be placed near the order block levels instead. This provides controlled entries and risk management.
Captures hidden momentum
Order blocks represent institutional money flow and substantial volume. They indicate shifts in market forces and provide early clues into potential breakout direction. This facilitates trend following with good timing.
The parameters controlling candle count, breakout percentage etc. can be adjusted to optimize for changing market conditions and trading style. This enhances adaptability.
By not auto-entering on signals and using limit orders instead, traders can define entry levels and control risk. Failed signals simply lead to unfilled limit orders. Risks are contained.
As order blocks signify zones, prices revisiting the level is common. Signals should not be viewed as direct entries. Further timing judgement is needed.
If parameters are not set properly, fake signals can emerge in range-bound markets. Traders need to exercise discretion in applying signals. Blind optimization should be avoided.
With each signal requiring further validation, significant manual effort is involved. Inconsistencies in human discretion on signal quality may lead to performance divergence.
Incorporate additional indicators like MACD and RSI when signals appear to gauge market conditions. This filters bad signals from poor parameter settings.
The parameters can be tested and tuned to suit different markets and instruments for better fit. Adaptive settings can also be implemented to auto-adjust based on volatility and risk tolerance.
Currently the strategy only serves as signal alerts. Logics can be added to automate limit order entries on signals and implement stops for exits. This increases automation and reduces reliance on human judgement.
By detecting order flow convergence, this strategy reveals hidden momentum moves brewing under the surface. Compared to simple trend following, it has predictive abilities in locating turning points. When combined with optimization and risk control techniques, it can become an effective trend trading system. Nonetheless, traders should be wary of bad signals and assess each signal’s quality. Further efforts should focus on enhancing automation to minimize biases from subjective discretion.
[/trans]
Strategy Arguments
| Argument | Default | Description |
|---|---|---|
| v_input_1 | 0 | Color Scheme: DARK |
| v_input_2 | 5 | Relevant Periods to identify OB |
| v_input_3 | false | Min. Percent move to identify OB |
| v_input_4 | false | Use whole range [High/Low] for OB marking? |
| v_input_5 | false | Show latest Bullish Channel? |
| v_input_6 | false | Show latest Bearish Channel? |
| v_input_7 | false | Show Label for documentation tooltip? |
| v_input_8 | false | Show Latest OB Panel? |
| v_input_9 | false | Plot Offset? |
| v_input_10 | true | Stop Loss [%] |
| v_input_11 | 2 | Take Profit [%] |
| v_input_12 | true | Pyramiding |
Source (PineScript)
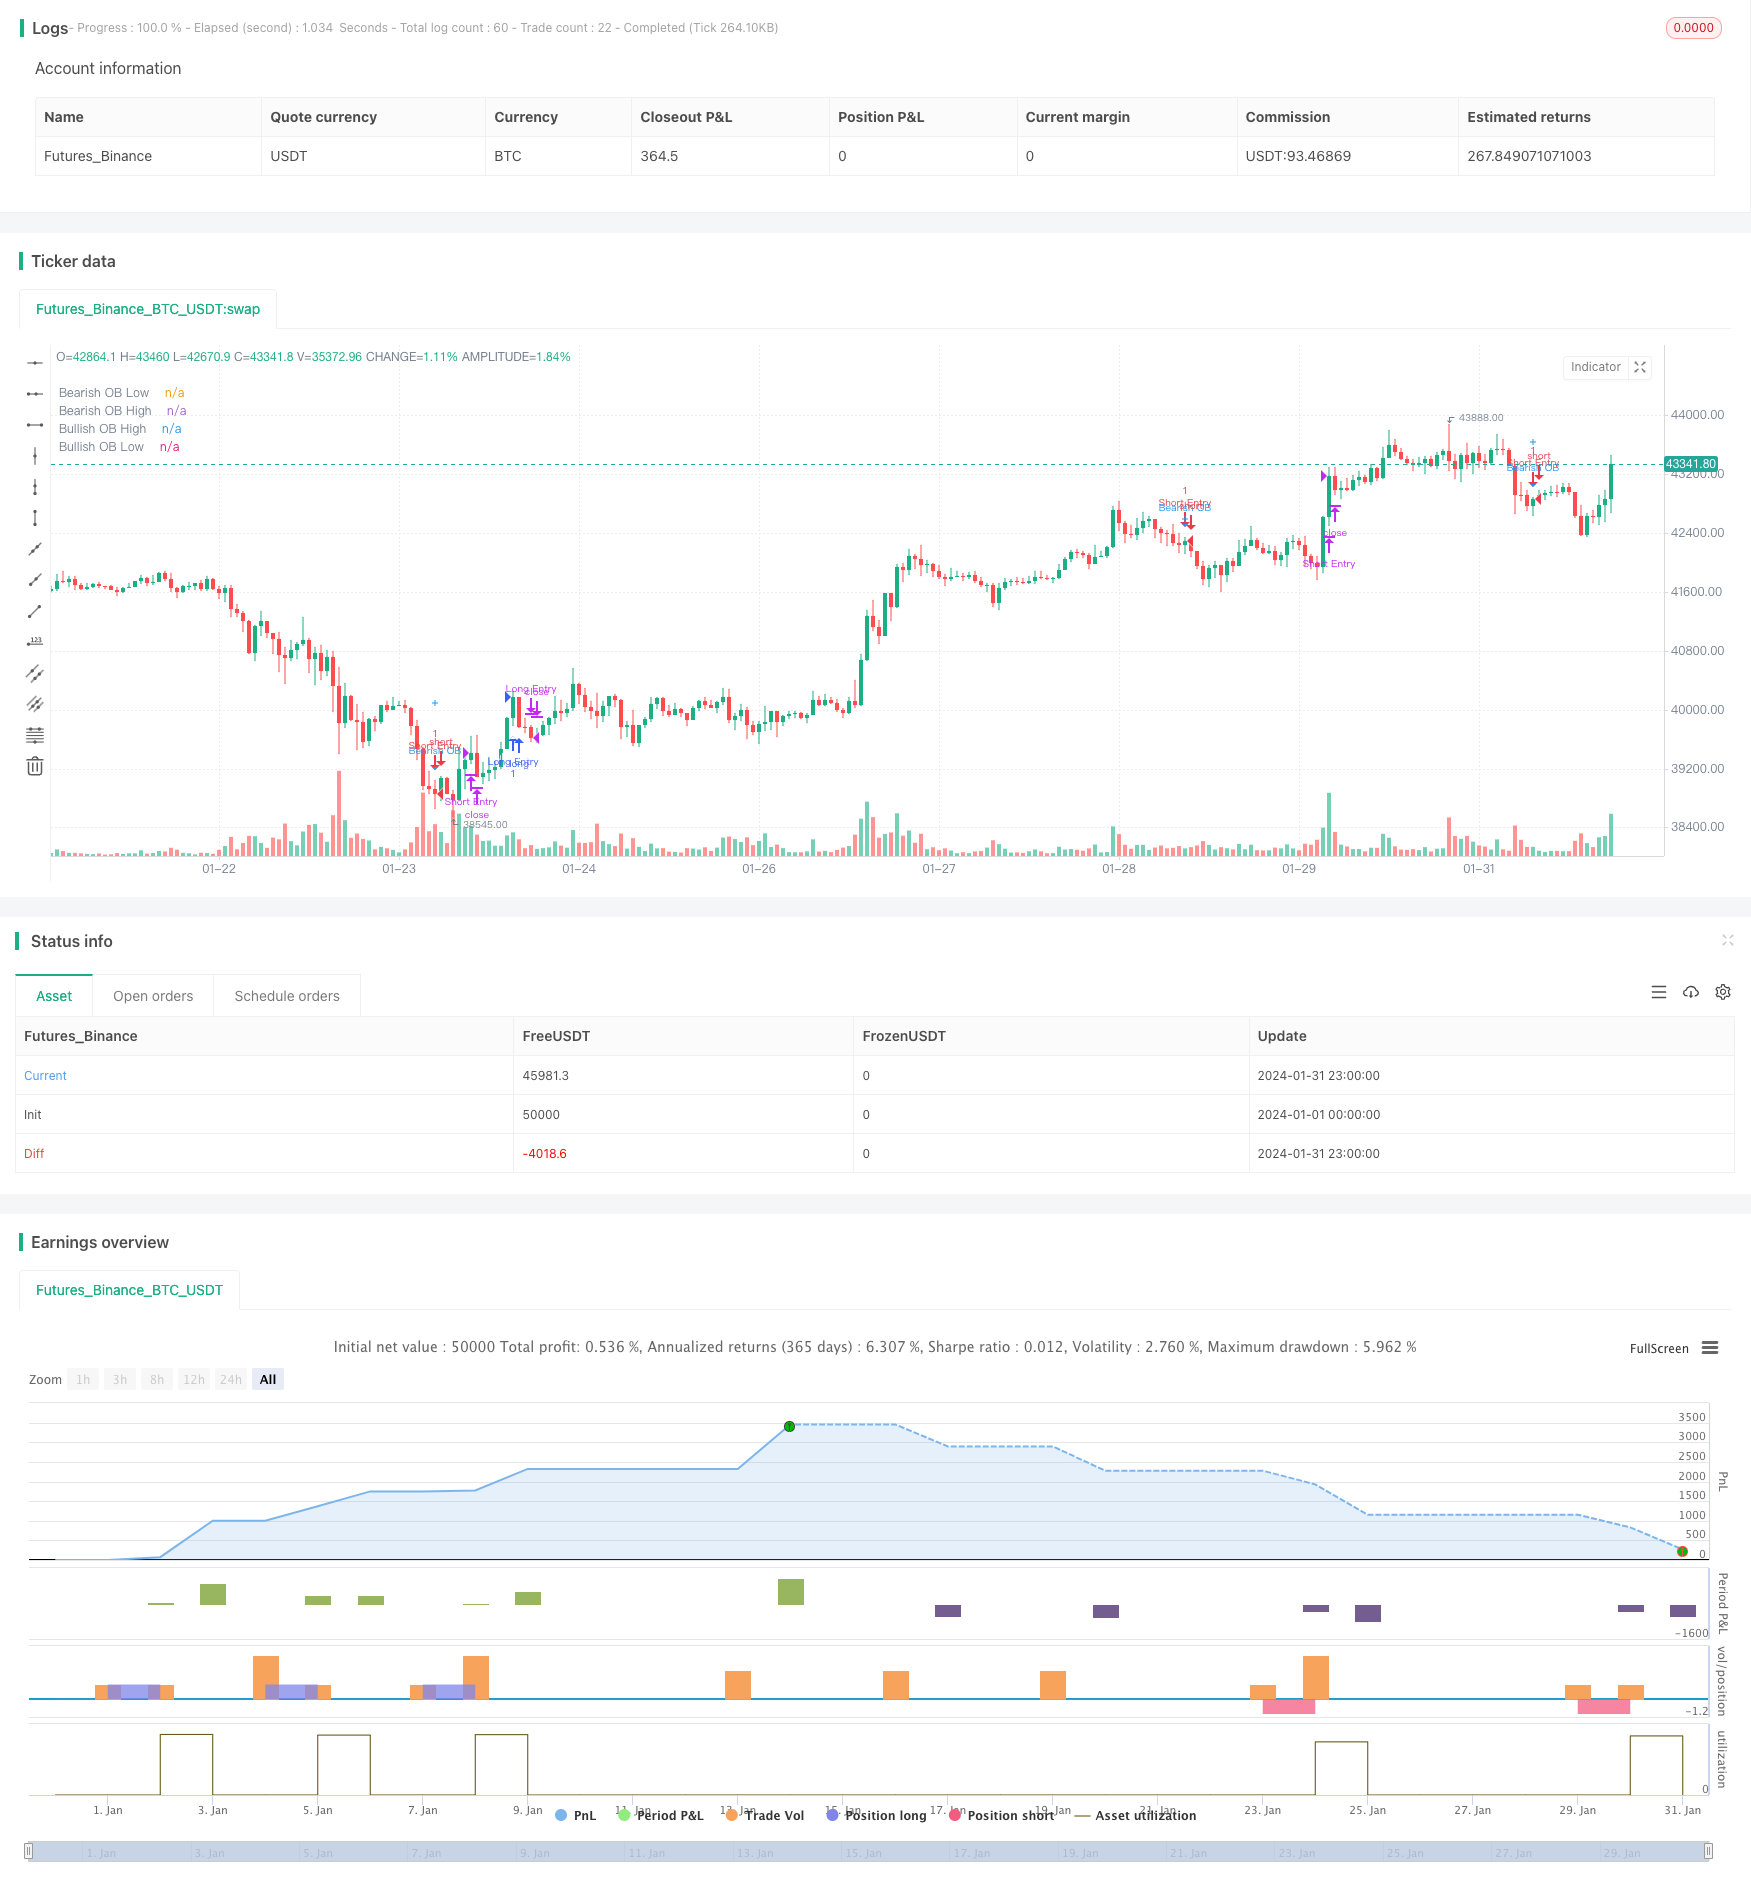
/*backtest
start: 2024-01-01 00:00:00
end: 2024-01-31 23:59:59
period: 1h
basePeriod: 15m
exchanges: [{"eid":"Futures_Binance","currency":"BTC_USDT"}]
*/

// This source code is subject to the terms of the Mozilla Public License 2.0 at https://mozilla.org/MPL/2.0/
// © TradingSecrets and wugamlo


// This experimental Indicator helps identifying instituational Order Blocks.
// Often these blocks signal the beginning of a strong move, but there is a significant probability that these price levels will be revisited at a later point in time again.
// Therefore these are interesting levels to place limit orders (Buy Orders for Bullish OB / Sell Orders for Bearish OB).
//
// A Bullish Order block is defined as the last down candle before a sequence of up candles. (Relevant price range "Open" to "Low" is marked)  / Optionally full range "High" to "Low"
// A Bearish Order Block is defined as the last up candle before a sequence of down candles. (Relevant price range "Open" to "High" is marked) / Optionally full range "High" to "Low"
//
// In the settings the number of required sequential candles can be adjusted.
// Furthermore a %-threshold can be entered. It defines which %-change the sequential move needs to achieve in order to identify a relevant Order Block.
// Channels for the last Bullish/Bearish Block can be shown/hidden.
//
// In addition to the upper/lower limits of each Order Block, also the equlibrium (average value) is marked as this is an interesting area for price interaction.
//
// Alerts added: Alerts fire when an Order Block is detected. The delay is based on the "Relevant Periods" input. Means with the default setting "5" the alert will trigger after the
// number of consecutive candles is reached.


//@version=4
strategy("[Backtest] Order Block Finder", overlay = true)

colors    = input(title = "Color Scheme", defval="DARK", options=["DARK", "BRIGHT"])
periods   = input(5,     "Relevant Periods to identify OB")                // Required number of subsequent candles in the same direction to identify Order Block
threshold = input(0.0,   "Min. Percent move to identify OB", step = 0.1)   // Required minimum % move (from potential OB close to last subsequent candle to identify Order Block)
usewicks  = input(false, "Use whole range [High/Low] for OB marking?" )    // Display High/Low range for each OB instead of Open/Low for Bullish / Open/High for Bearish
showbull  = input(false,  "Show latest Bullish Channel?")                   // Show Channel for latest Bullish OB?
showbear  = input(false,  "Show latest Bearish Channel?")                   // Show Channel for latest Bearish OB?
showdocu  = input(false, "Show Label for documentation tooltip?")          // Show Label which shows documentation as tooltip?
info_pan  = input(false, "Show Latest OB Panel?")                          // Show Info Panel with latest OB Stats
//strategy inputs
plot_offset = input( type=input.bool,defval = false, title = 'Plot Offset?')
stoploss_percent = input(type=input.float, defval = 1, title = 'Stop Loss [%]')
takeprofit_percent = input(type=input.float, defval = 2, title = 'Take Profit [%]')
pyramiding = input( type=input.bool,defval = true, title = 'Pyramiding')

ob_period = periods + 1                                                    // Identify location of relevant Order Block candle
absmove   = ((abs(close[ob_period] - close[1]))/close[ob_period]) * 100    // Calculate absolute percent move from potential OB to last candle of subsequent candles
relmove   = absmove >= threshold                                           // Identify "Relevant move" by comparing the absolute move to the threshold

// Color Scheme
bullcolor = colors == "DARK"? color.white : color.green
bearcolor = colors == "DARK"? color.blue : color.red

// Bullish Order Block Identification
bullishOB = close[ob_period] < open[ob_period]                             // Determine potential Bullish OB candle (red candle)

int upcandles  = 0
for i = 1 to periods
    upcandles := upcandles + (close[i] > open[i]? 1 : 0)                   // Determine color of subsequent candles (must all be green to identify a valid Bearish OB)

OB_bull      = bullishOB and (upcandles == (periods)) and relmove          // Identification logic (red OB candle & subsequent green candles)
OB_bull_high = OB_bull? usewicks? high[ob_period] : open[ob_period] : na   // Determine OB upper limit (Open or High depending on input)
OB_bull_low  = OB_bull? low[ob_period]  : na                               // Determine OB lower limit (Low)
OB_bull_avg  = (OB_bull_high + OB_bull_low)/2                              // Determine OB middle line


// Bearish Order Block Identification
bearishOB = close[ob_period] > open[ob_period]                             // Determine potential Bearish OB candle (green candle)

int downcandles  = 0
for i = 1 to periods
    downcandles := downcandles + (close[i] < open[i]? 1 : 0)               // Determine color of subsequent candles (must all be red to identify a valid Bearish OB)

OB_bear      = bearishOB and (downcandles == (periods)) and relmove        // Identification logic (green OB candle & subsequent green candles)
OB_bear_high = OB_bear? high[ob_period] : na                               // Determine OB upper limit (High)
OB_bear_low  = OB_bear? usewicks? low[ob_period] : open[ob_period] : na    // Determine OB lower limit (Open or Low depending on input)
OB_bear_avg  = (OB_bear_low + OB_bear_high)/2                              // Determine OB middle line

//@TradingSecrets: Option to disable the offset in order to allign signals with Backtest
if not plot_offset
    ob_period := 0
// Plotting
plotshape(OB_bull, title="Bullish OB", style = shape.triangleup,   color = bullcolor, textcolor = bullcolor, size = size.tiny, location = location.belowbar, offset = -ob_period, text = "Bullish OB")     // Bullish OB Indicator
bull1 = plot(OB_bull_high, title="Bullish OB High", style = plot.style_linebr, color = bullcolor, offset = -ob_period, linewidth = 3)                                               // Bullish OB Upper Limit
bull2 = plot(OB_bull_low,  title="Bullish OB Low",  style = plot.style_linebr, color = bullcolor, offset = -ob_period, linewidth = 3)                                               // Bullish OB Lower Limit
fill(bull1, bull2, color=bullcolor, transp = 0, title = "Bullish OB fill")                                                                                                          // Fill Bullish OB
plotshape(OB_bull_avg, title="Bullish OB Average", style = shape.cross,   color = bullcolor, size = size.normal, location = location.absolute, offset = -ob_period)                 // Bullish OB Average


plotshape(OB_bear, title="Bearish OB", style = shape.triangledown, color = bearcolor, textcolor = bearcolor,  size = size.tiny, location = location.abovebar, offset = -ob_period, text = "Bearish OB")     // Bearish OB Indicator
bear1 = plot(OB_bear_low,  title="Bearish OB Low",  style = plot.style_linebr, color = bearcolor, offset = -ob_period, linewidth = 3)                                                // Bearish OB Lower Limit
bear2 = plot(OB_bear_high, title="Bearish OB High", style = plot.style_linebr, color = bearcolor, offset = -ob_period, linewidth = 3)                                                // Bearish OB Upper Limit
fill(bear1, bear2, color=bearcolor, transp = 0, title = "Bearish OB fill")                                                                                                           // Fill Bearish OB
plotshape(OB_bear_avg, title="Bearish OB Average", style = shape.cross,   color = bearcolor, size = size.normal, location = location.absolute, offset = -ob_period)                  // Bullish OB Average

var line linebull1 = na       // Bullish OB average
var line linebull2 = na       // Bullish OB open
var line linebull3 = na       // Bullish OB low
var line linebear1 = na       // Bearish OB average
var line linebear2 = na       // Bearish OB high
var line linebear3 = na       // Bearish OB open


if OB_bull and showbull
    line.delete(linebull1)
    linebull1 := line.new(x1 = bar_index, y1 = OB_bull_avg, x2 = bar_index - 1, y2 = OB_bull_avg, extend = extend.left, color = bullcolor, style = line.style_solid, width = 1)

    line.delete(linebull2)
    linebull2 := line.new(x1 = bar_index, y1 = OB_bull_high, x2 = bar_index - 1, y2 = OB_bull_high, extend = extend.left, color = bullcolor, style = line.style_dashed, width = 1)

    line.delete(linebull3)
    linebull3 := line.new(x1 = bar_index, y1 = OB_bull_low, x2 = bar_index - 1, y2 = OB_bull_low, extend = extend.left, color = bullcolor, style = line.style_dashed, width = 1)

if OB_bear and showbear
    line.delete(linebear1)
    linebear1 := line.new(x1 = bar_index, y1 = OB_bear_avg, x2 = bar_index - 1, y2 = OB_bear_avg, extend = extend.left, color = bearcolor,  style = line.style_solid, width = 1)

    line.delete(linebear2)
    linebear2 := line.new(x1 = bar_index, y1 = OB_bear_high, x2 = bar_index - 1, y2 = OB_bear_high, extend = extend.left, color = bearcolor,  style = line.style_dashed, width = 1)

    line.delete(linebear3)
    linebear3 := line.new(x1 = bar_index, y1 = OB_bear_low, x2 = bar_index - 1, y2 = OB_bear_low, extend = extend.left, color = bearcolor,  style = line.style_dashed, width = 1)


// Alerts for Order Blocks Detection

alertcondition(OB_bull, title='New Bullish OB detected', message='New Bullish OB detected - This is NOT a BUY signal!')
alertcondition(OB_bear, title='New Bearish OB detected', message='New Bearish OB detected - This is NOT a SELL signal!')

// Print latest Order Blocks in Data Window

var latest_bull_high = 0.0         // Variable to keep latest Bull OB high
var latest_bull_avg  = 0.0         // Variable to keep latest Bull OB average
var latest_bull_low  = 0.0         // Variable to keep latest Bull OB low
var latest_bear_high = 0.0         // Variable to keep latest Bear OB high
var latest_bear_avg  = 0.0         // Variable to keep latest Bear OB average
var latest_bear_low  = 0.0         // Variable to keep latest Bear OB low

// Assign latest values to variables
if OB_bull_high > 0
    latest_bull_high := OB_bull_high

if OB_bull_avg > 0
    latest_bull_avg := OB_bull_avg

if OB_bull_low > 0
    latest_bull_low := OB_bull_low

if OB_bear_high > 0
    latest_bear_high := OB_bear_high

if OB_bear_avg > 0
    latest_bear_avg := OB_bear_avg

if OB_bear_low > 0
    latest_bear_low := OB_bear_low

// Plot invisible characters to be able to show the values in the Data Window
plotchar(latest_bull_high, char = ' ', location = location.abovebar, color = #777777, transp = 100, size = size.tiny, title = "Latest Bull High")
plotchar(latest_bull_avg,  char = ' ', location = location.abovebar, color = #777777, transp = 100, size = size.tiny, title = "Latest Bull Avg")
plotchar(latest_bull_low,  char = ' ', location = location.abovebar, color = #777777, transp = 100, size = size.tiny, title = "Latest Bull Low")
plotchar(latest_bear_high, char = ' ', location = location.abovebar, color = #777777, transp = 100, size = size.tiny, title = "Latest Bear High")
plotchar(latest_bear_avg,  char = ' ', location = location.abovebar, color = #777777, transp = 100, size = size.tiny, title = "Latest Bear Avg")
plotchar(latest_bear_low,  char = ' ', location = location.abovebar, color = #777777, transp = 100, size = size.tiny, title = "Latest Bear Low")


//InfoPanel for latest Order Blocks

draw_InfoPanel(_text, _x, _y, font_size)=>
    var label la_panel = na
    label.delete(la_panel)
    la_panel := label.new(
         x=_x, y=_y,
         text=_text, xloc=xloc.bar_time, yloc=yloc.price,
         color=color.new(#383838, 5), style=label.style_label_left, textcolor=color.white, size=font_size)

info_panel_x = time_close + round(change(time) * 100)
info_panel_y = close

title = "LATEST ORDER BLOCKS"
row0 = "-----------------------------------------------------"
row1 = ' Bullish - High: ' + tostring(latest_bull_high, '#.##')
row2 = ' Bullish - Avg: ' + tostring(latest_bull_avg, '#.##')
row3 = ' Bullish - Low: ' + tostring(latest_bull_low, '#.##')
row4 = "-----------------------------------------------------"
row5 = ' Bearish - High: ' + tostring(latest_bear_high, '#.##')
row6 = ' Bearish - Avg: ' + tostring(latest_bear_avg, '#.##')
row7 = ' Bearish - Low: ' + tostring(latest_bear_low, '#.##')

panel_text = '\n' + title + '\n' + row0 + '\n' + row1 + '\n' + row2 + '\n' + row3 + '\n' + row4 + '\n\n' + row5 + '\n' + row6 + '\n' + row7 + '\n'

if info_pan
    draw_InfoPanel(panel_text, info_panel_x, info_panel_y, size.normal)


// === Label for Documentation/Tooltip ===
chper = time - time[1]
chper := change(chper) > 0 ? chper[1] : chper

// === Tooltip text ===

var vartooltip = "Indicator to help identifying instituational Order Blocks. Often these blocks signal the beginning of a strong move, but there is a high probability, that these prices will be revisited at a later point in time again and therefore are interesting levels to place limit orders. \nBullish Order block is the last down candle before a sequence of up candles. \nBearish Order Block is the last up candle before a sequence of down candles. \nIn the settings the number of required sequential candles can be adjusted. \nFurthermore a %-threshold can be entered which the sequential move needs to achieve in order to validate a relevant Order Block. \nChannels for the last Bullish/Bearish Block can be shown/hidden."

// === Print Label ===
var label l_docu = na
label.delete(l_docu)

if showdocu
    l_docu := label.new(x = time + chper * 35, y = close, text = "DOCU OB", color=color.gray, textcolor=color.white, style=label.style_label_center, xloc = xloc.bar_time, yloc=yloc.price, size=size.tiny, textalign = text.align_left, tooltip = vartooltip)

// @TradingSecrets: Generate entry and exit orders based on the signals
entryLongSignal = OB_bull
entryShortSignal = OB_bear

if not pyramiding
    entryLongSignal := entryLongSignal and not strategy.position_size
    entryShortSignal := entryShortSignal and not strategy.position_size
if entryLongSignal
    strategy.entry("Long Entry", strategy.long)
    //strategy.exit("Long Exit Loss", "Long Entry", stop = close * (1 - stoploss_percent*0.01))

if entryShortSignal
    strategy.entry("Short Entry", strategy.short)
    //strategy.exit("Short Exit Loss", "Short Entry", stop = close * (1 + stoploss_percent*0.01))
strategy.initial_capital = 50000
//Close Position by market order
if strategy.position_size > 0 and strategy.openprofit/nz(strategy.initial_capital + strategy.netprofit) >= takeprofit_percent*0.01
    //If I m in a long position and my take profit got hit close it by market order
    strategy.close("Long Entry", comment = "Long Exit Profit")
if strategy.position_size < 0 and strategy.openprofit/nz(strategy.initial_capital + strategy.netprofit) >= takeprofit_percent*0.01
    strategy.close("Short Entry", comment = "Short Exit Profit")

if strategy.position_size > 0 and strategy.openprofit/nz(strategy.initial_capital + strategy.netprofit) <= -stoploss_percent*0.01
    //If I m in a long position and my take profit got hit close it by market order
    strategy.close("Long Entry", comment = "Long Exit Loss")
if strategy.position_size < 0 and strategy.openprofit/nz(strategy.initial_capital + strategy.netprofit) <= -stoploss_percent*0.01
    strategy.close("Short Entry", comment = "Short Exit Loss")
Detail
https://www.fmz.com/strategy/442822
Last Modified
2024-02-26 11:54:02