Name
基于超级趋势通道的突破交易策略Supertrend-Breakout-Trading-Strategy
Author
ChaoZhang
Strategy Description
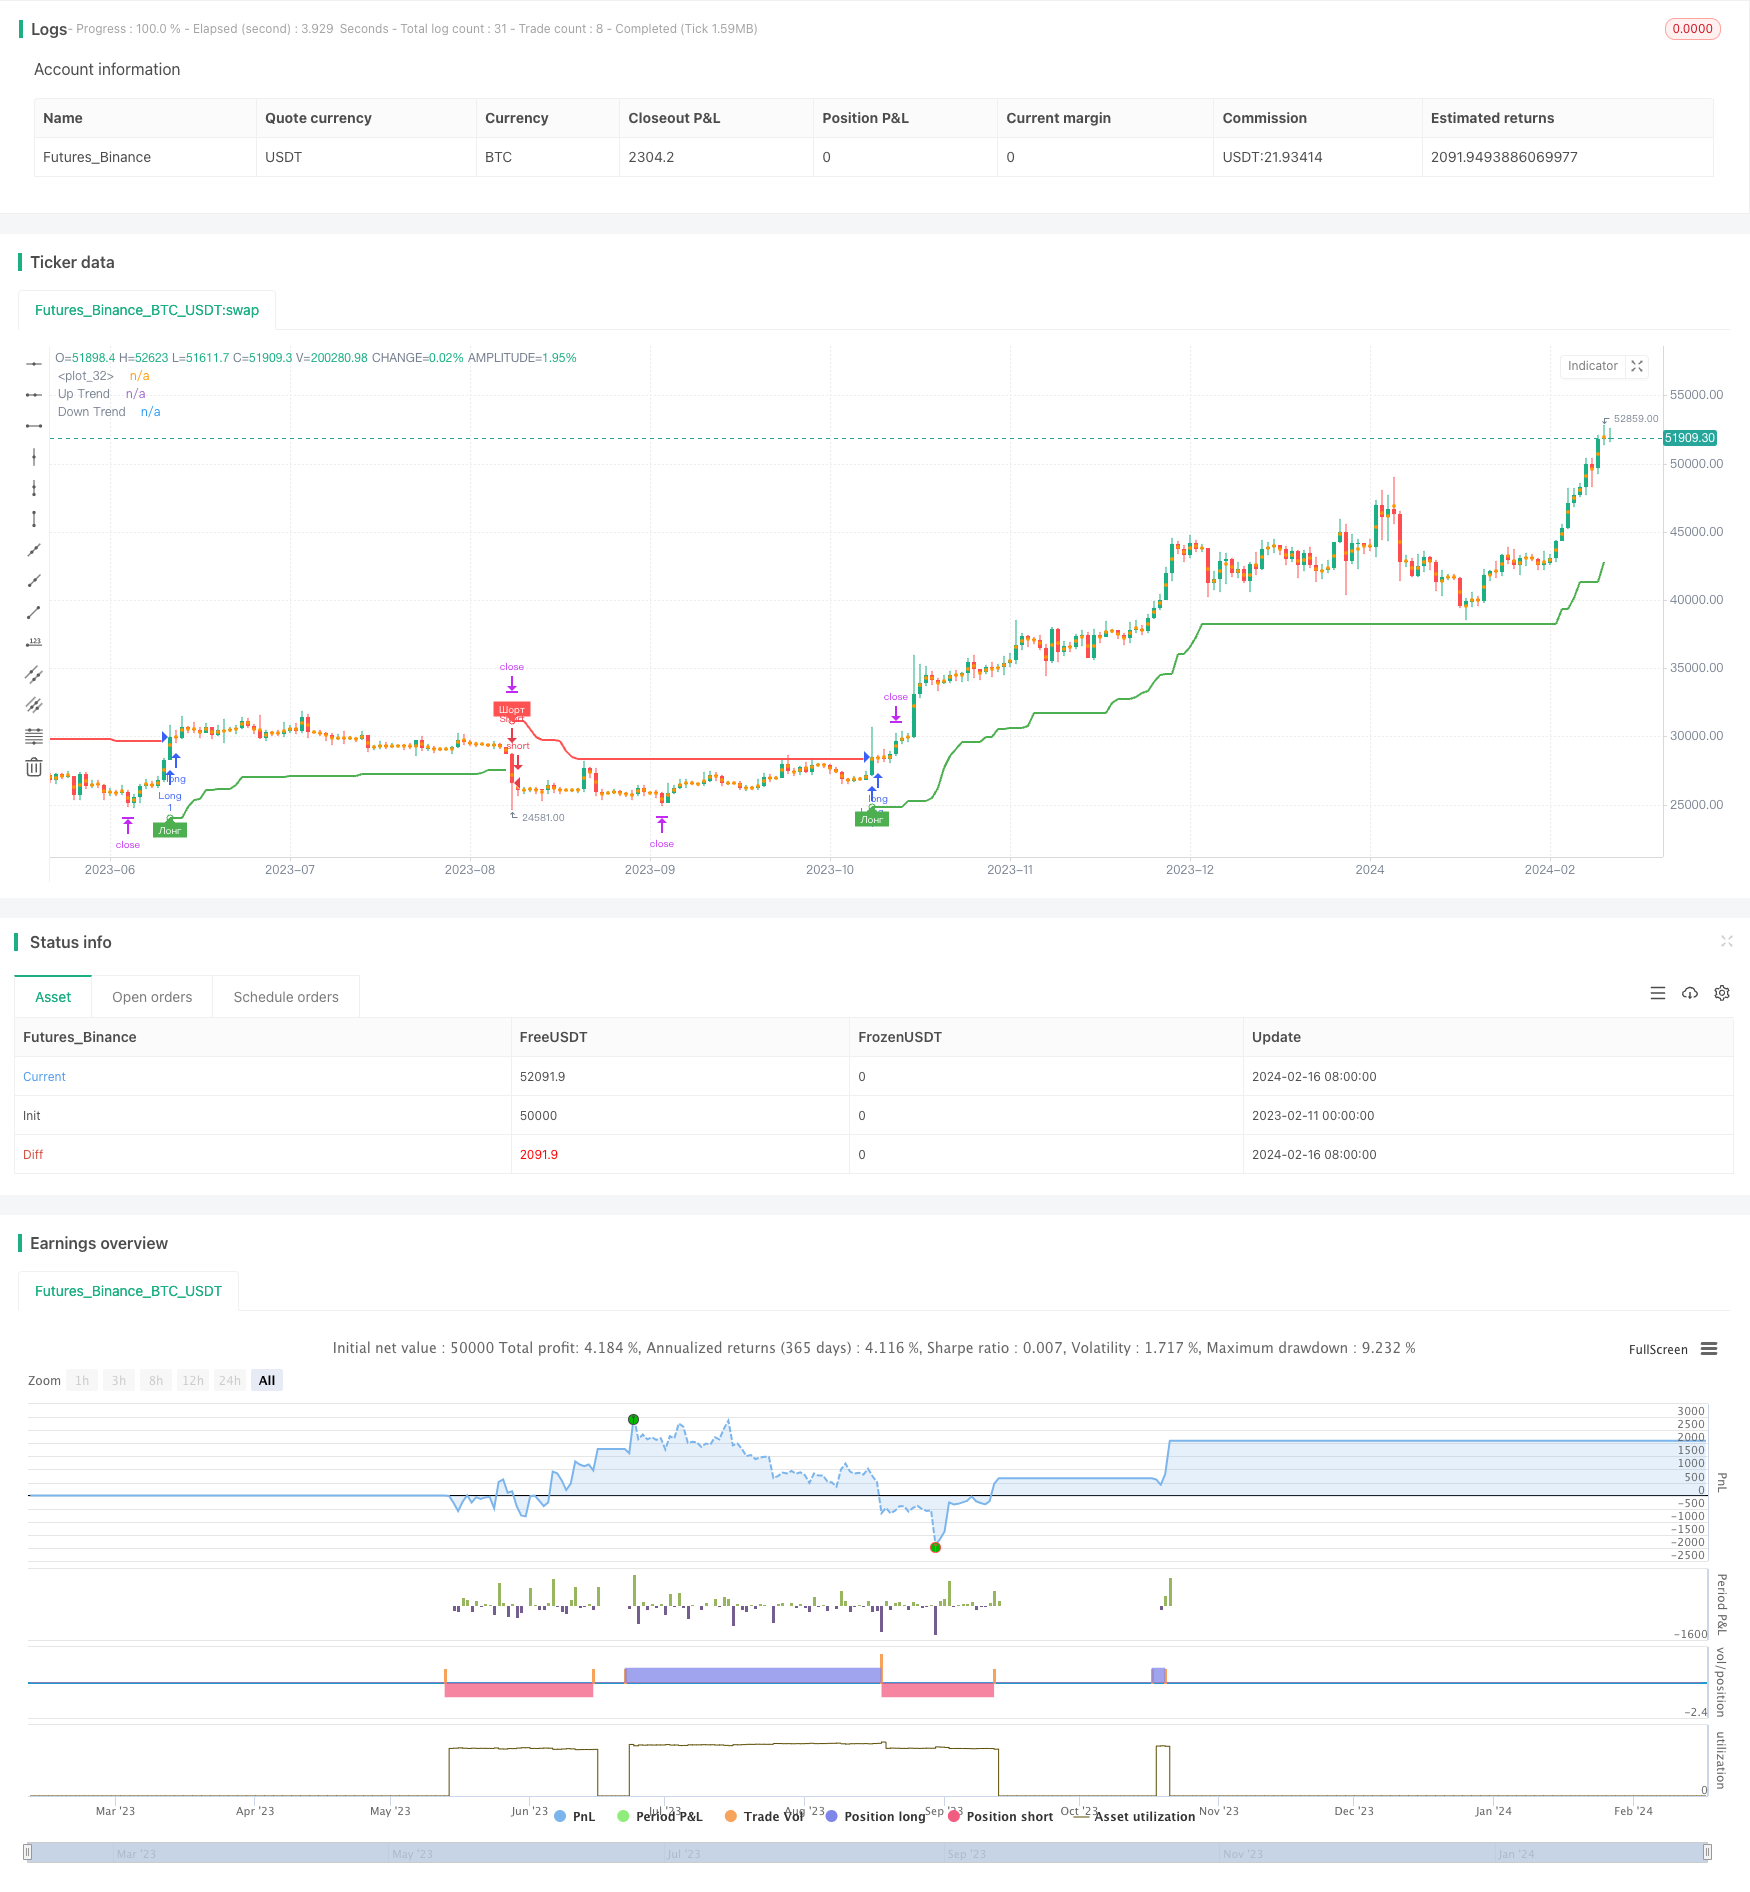
该策略基于超级趋势通道指标开发。它结合价格行情以及超级趋势通道的方向,判断行情趋势,并在通道方向转折时发出交易信号。
当价格突破超级趋势通道时,买入做多;当价格跌破超级趋势下通道时,卖出做空。同时,它具有趋势跟踪止损机制。
超级趋势通道由一上轨、一下轨组成。通道内部为盘整区域,通道外部为趋势区域。它利用平均真实波动范围乘以一个倍数,来确定通道的宽度。
当价格从下方突破上轨时,为买入信号。这意味着新的上涨趋势启动。当价格从上方跌破下轨时,为卖出信号。这意味着新的下跌趋势开始。
该策略运用超级趋势通道指标判断主要趋势的方向。当通道方向发生转折时,即价格突破通道轨时,发出交易信号;然后利用趋势跟踪止损方式,锁定盈利。
这是一个较为简单直观的突破策略。它具有以下优势:
-
利用超级趋势通道判断主要趋势方向,避免被噪音iB赚钱。
-
顺势而为,根据价格与通道的关系判断做多做空时机。
-
具有清晰的止损机制,可以有效控制风险。
-
止损方式为趋势跟踪止损,可最大程度锁定盈利。
该策略也存在一些风险,主要包括:
-
超级趋势通道参数设置不当,可能导致虚假信号。
-
突破信号可能是短期的反转信号,从而产生亏损。
-
止损方式仅为趋势跟踪止损,可能会过早止损。
对应改进措施包括:
-
测试不同市场的数据,优化参数。
-
结合其他指标过滤信号。
-
结合价格 Structure,判断突破信号的可靠性。
-
增加后台止损,进一步控制风险。
该策略整体而言是一个较为简单直观的趋势跟踪策略。它利用超级趋势通道清晰判断趋势方向,在通道发生转折时产生信号;然后利用趋势跟踪止损方式锁定盈利。
相比其他指标,超级趋势通道对价格波动的包容性较好。但该策略也存在一定盈利空间,可以从信号过滤及止损方式等方面进行优化,以进一步提高稳定性。
||
This strategy is developed based on the Supertrend indicator. It combines price action and the direction of the Supertrend channel to judge market trends and generate trading signals when the channel direction changes.
When the price breaks through the Supertrend channel, go long; when the price breaks below the lower channel of Supertrend, go short. At the same time, it has a trend tracking stop loss mechanism.
The Supertrend channel consists of an upper rail and a lower rail. The area inside the channel is the consolidation area and the area outside is the trending area. It uses the average true range multiplied by a factor to determine the width of the channel.
When the price breaks through the upper rail from the bottom, it is a buy signal. This means that a new uptrend is starting. When the price breaks through the lower rail from the top, it is a sell signal. This means that a new downtrend is beginning.
The strategy uses the Supertrend indicator to judge the main trend direction. When the channel direction changes, that is when the price breaks through the channel rails, trading signals are generated. Then use a trend tracking stop loss to lock in profits.
This is a relatively simple and intuitive breakout strategy. It has the following advantages:
-
Use Supertrend channels to determine the main trend direction and avoid noise trading.
-
Go with the trend, judge long and short opportunities based on the price’s relationship with the channel.
-
It has a clear stop loss mechanism to effectively control risks.
-
The stop loss method is trend tracking stop loss, which can maximize profit locking.
There are also some risks to this strategy, mainly including:
-
Improper parameter settings of the Supertrend may lead to false signals.
-
Breakout signals may be short-term reversal signals, resulting in losses.
-
The stop loss method is only trend tracking stop loss, which may stop loss prematurely.
The corresponding improvement measures include:
-
Test data from different markets and optimize parameters.
-
Filter signals in combination with other indicators.
-
Judge the reliability of breakout signals combined with price structure.
-
Increase background stop loss to further control risks.
In general, this strategy is a relatively simple and intuitive trend following strategy. It uses Supertrend channels to clearly determine the trend direction and generates signals when the channel changes direction. Then use trend tracking stop loss to lock in profits.
Compared with other indicators, the Supertrend channel has better tolerance for price fluctuations. But there is still room for profit for this strategy. It can be optimized in terms of signal filtering and stop loss methods to further improve stability.
[/trans]
Strategy Arguments
| Argument | Default | Description |
|---|---|---|
| v_input_1 | 4 | ATR Period |
| v_input_2_hlc3 | 0 | Source: hlc3 |
| v_input_3 | 4.7 | ATR Multiplier |
| v_input_4 | true | Change ATR Calculation Method ? |
| v_input_5 | true | Show Buy/Sell Signals ? |
| v_input_6 | true | Highlighter On/Off ? |
Source (PineScript)
/*backtest
start: 2023-02-11 00:00:00
end: 2024-02-17 00:00:00
period: 1d
basePeriod: 1h
exchanges: [{"eid":"Futures_Binance","currency":"BTC_USDT"}]
*/

//@version=4
strategy("Supertrend TEST Strategy", overlay = true, format=format.price, precision=2)

Periods = input(title="ATR Period", type=input.integer, defval=4)
src = input(hlc3, title="Source")
Multiplier = input(title="ATR Multiplier", type=input.float, step=0.1, defval=4.7)
changeATR= input(title="Change ATR Calculation Method ?", type=input.bool, defval=true)
showsignals = input(title="Show Buy/Sell Signals ?", type=input.bool, defval=true)
highlighting = input(title="Highlighter On/Off ?", type=input.bool, defval=true)
tp=close
sl=close

atr2 = sma(tr, Periods)
atr= changeATR ? atr(Periods) : atr2
up=src-(Multiplier*atr)
up1 = nz(up[1],up)
up := close[1] > up1 ? max(up,up1) : up
dn=src+(Multiplier*atr)
dn1 = nz(dn[1], dn)
dn := close[1] < dn1 ? min(dn, dn1) : dn
trend = 1
trend := nz(trend[1], trend)
trend := trend == -1 and close > dn1 ? 1 : trend == 1 and close < up1 ? -1 : trend
upPlot = plot(trend == 1 ? up : na, title="Up Trend", style=plot.style_linebr, linewidth=2, color=color.green)
buySignal = trend == 1 and trend[1] == -1
plotshape(buySignal ? up : na, title="UpTrend Begins", location=location.absolute, style=shape.circle, size=size.tiny, color=color.green )
plotshape(buySignal and showsignals ? up : na, title="Лонг", text="Лонг", location=location.absolute, style=shape.labelup, size=size.tiny, color=color.green, textcolor=color.white )
dnPlot = plot(trend == 1 ? na : dn, title="Down Trend", style=plot.style_linebr, linewidth=2, color=color.red)
sellSignal = trend == -1 and trend[1] == 1
plotshape(sellSignal ? dn : na, title="DownTrend Begins", location=location.absolute, style=shape.circle, size=size.tiny, color=color.red )
plotshape(sellSignal and showsignals ? dn : na, title="Шорт", text="Шорт", location=location.absolute, style=shape.labeldown, size=size.tiny, color=color.red, textcolor=color.white )
mPlot = plot(ohlc4, title="", style=plot.style_circles, linewidth=0)
longFillColor = highlighting ? (trend == 1 ? color.green : color.white) : color.white
shortFillColor = highlighting ? (trend == -1 ? color.red : color.white) : color.white


if (strategy.position_size > 0)
	tp:=tp[1]
	sl:=up
	strategy.exit("Long_TP/SL","Long",limit=tp, stop=sl)

if (strategy.position_size < 0)
	tp:=tp[1]
	sl:=dn
	strategy.exit("Short_TP/SL","Short",limit=tp, stop=sl)


if buySignal
	tp:=close+(close-up)*0.382
    strategy.entry("Long", strategy.long,  limit=tp, comment=tostring(round(tp)))
if sellSignal
	tp:=close-(dn-close)*0.382
    strategy.entry("Short", strategy.short, limit=tp, comment=tostring(round(tp)))
Detail
https://www.fmz.com/strategy/441987
Last Modified
2024-02-18 14:19:58