Name
基于超趋势指标的多空自动交易策略Supertrend-Tracking-Strategy
Author
ChaoZhang
Strategy Description
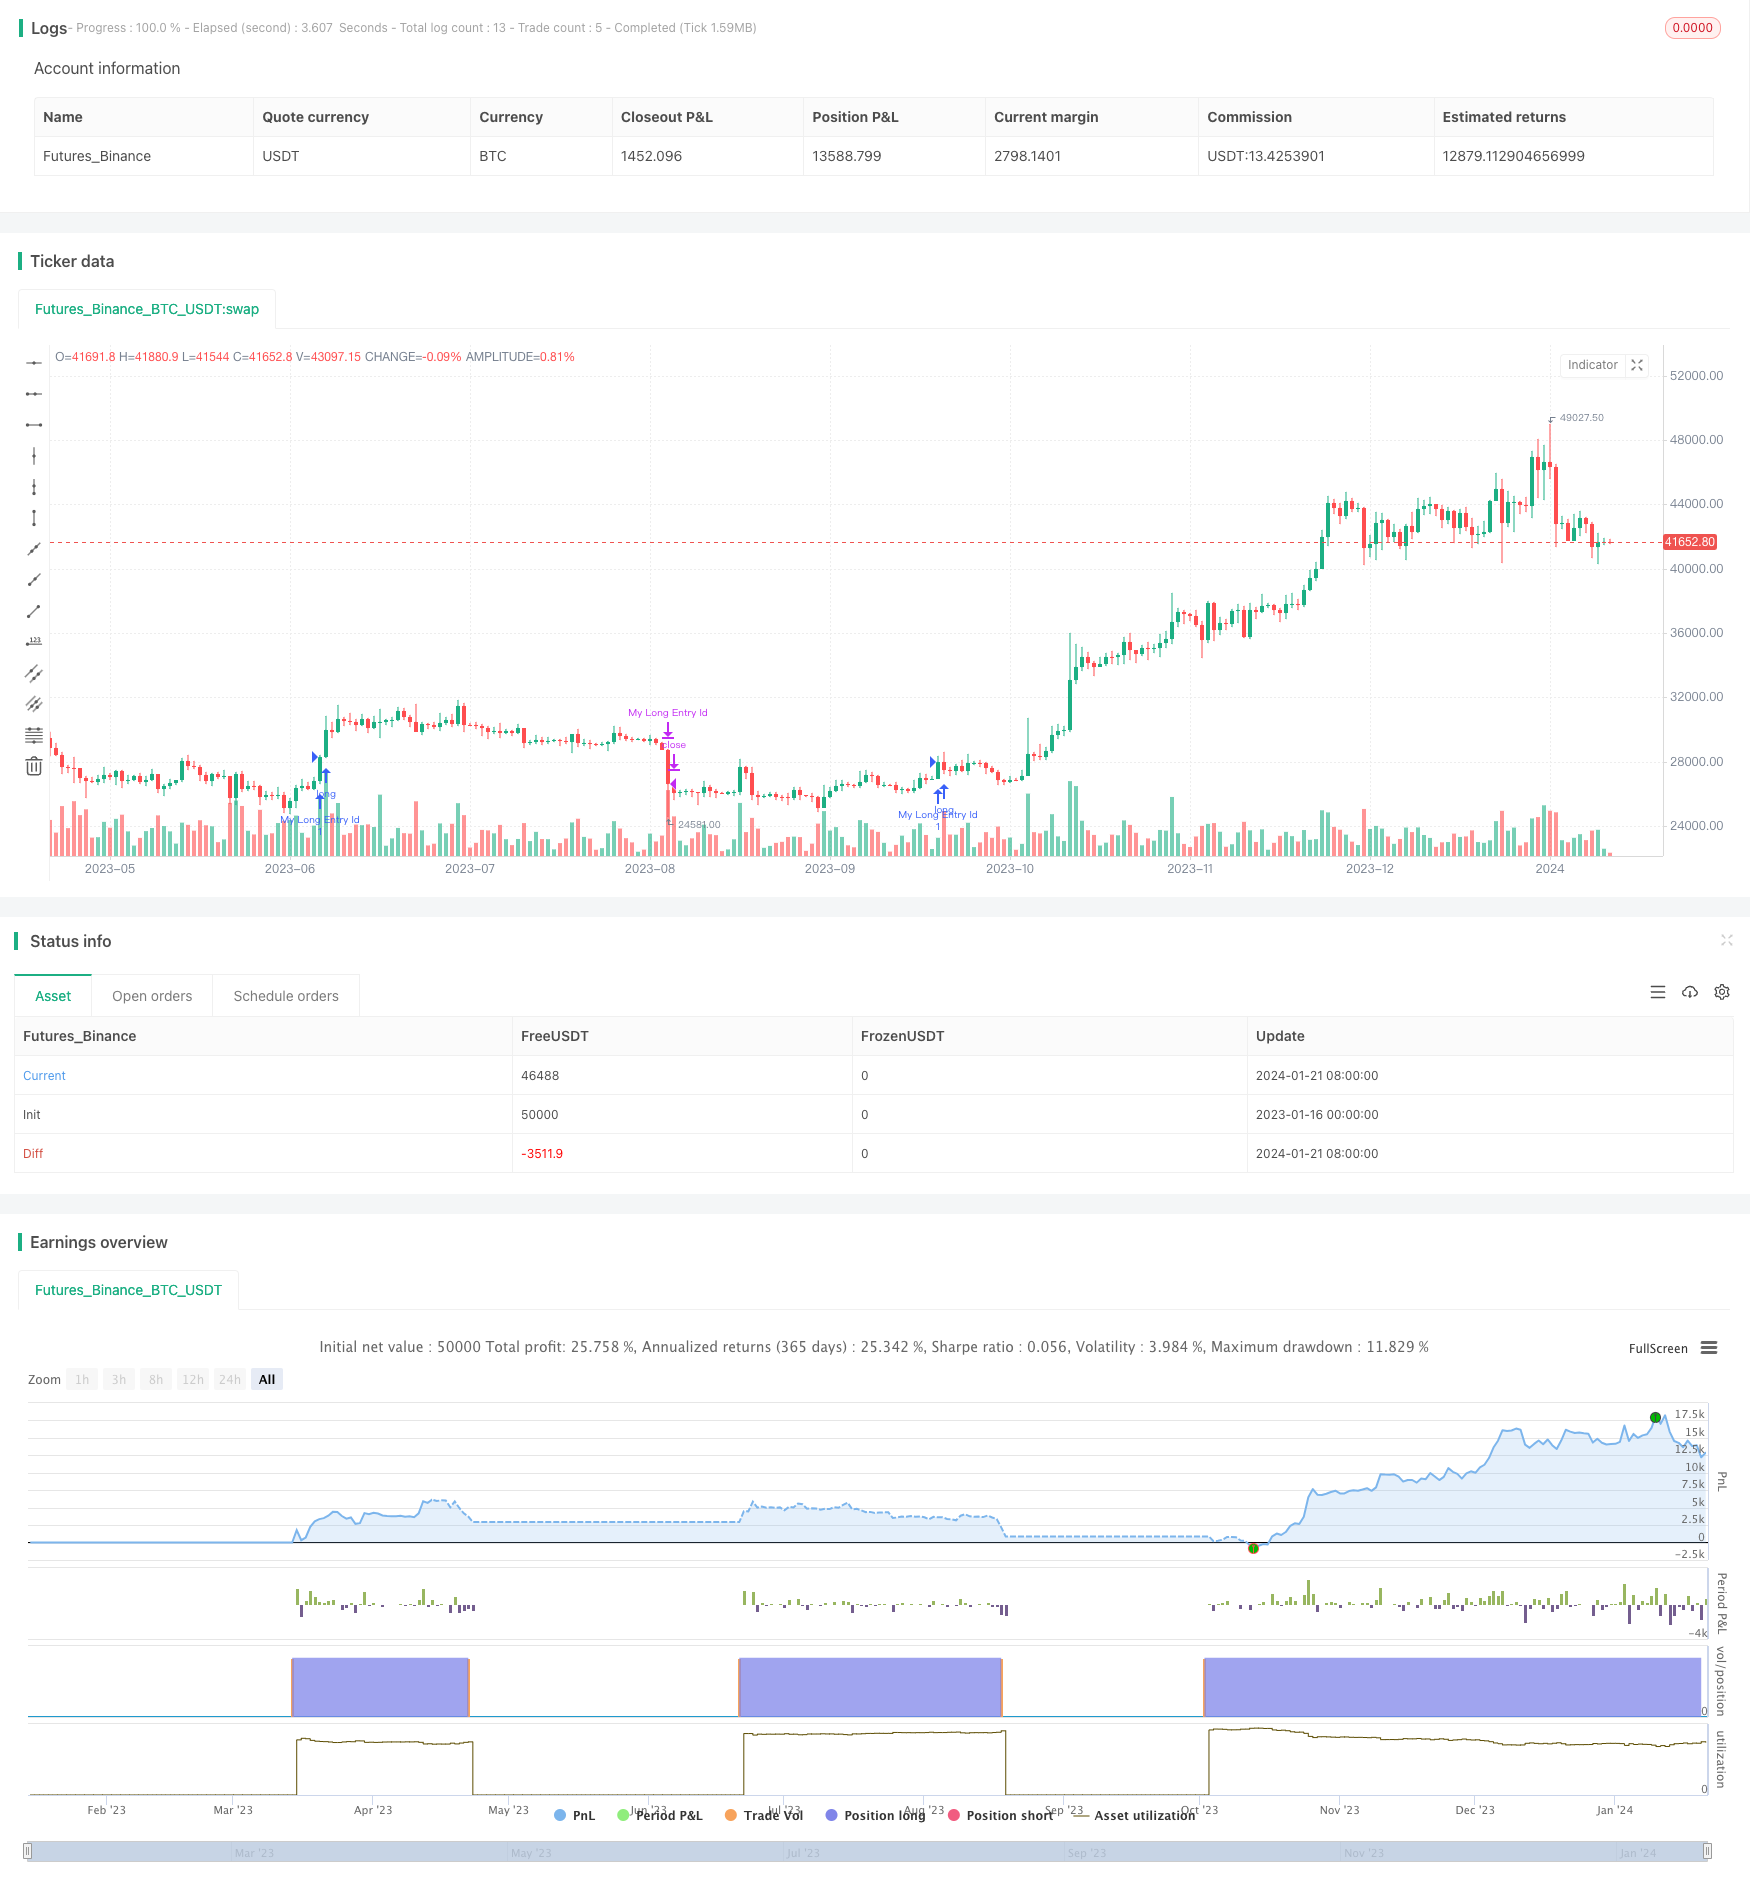
本策略名为“超趋势跟踪策略”。该策略基于超趋势指标开发了一个多空自动交易系统,可以自动识别趋势方向,并结合RSI指标和ADX指标进行入场和出场。
该策略主要基于超趋势指标判断当前价格趋势。超趋势指标结合了移动平均线和ATR,可以有效判断价格趋势方向。当超趋势指标方向发生转折时,表示价格趋势发生转变。
具体来说,该策略首先计算超趋势指标方向,以及RSI指标和ADX指标。在超趋势指标方向向下转折,并且RSI指标显示多头强势消退的条件下,进行做空入场。当超趋势指标再次向上转折时,执行做空平仓。
该策略最大的优势在于可以自动识别价格趋势,并基于趋势进行入场和出场,无需人工判断。此外,结合RSI指标和ADX指标进行过滤,可以有效过滤假突破,提高盈利概率。
该策略最大的风险在于超趋势指标本身判断价格趋势的准确性并不高,可能出现错误信号。此外,没有设置止损机制,单笔亏损可能较大。
可以通过调整超趋势指标参数以及加入移动止损来优化,降低风险。
该策略可以从以下几个方面进行优化:
-
优化超趋势指标参数,提高判断准确性
-
加入移动止损机制,控制单笔亏损
-
结合更多指标进行过滤,如布林带,KDJ等,提高盈利概率
-
开发类似的多头入场和出场策略,使策略全面
本策略总体来说是一个基于超趋势指标判断趋势的自动化交易策略。优点是自动化程度高,可以自动判断趋势进入场。缺点是超趋势指标本身准确性一般,没有设置止损。通过参数优化和增加其他指标可以提高盈利概率,增加止损可以控制风险,使该策略更加强大。
||
This strategy is named "Supertrend Tracking Strategy". It develops an automated trading system for both long and short positions based on the Supertrend indicator, which can automatically identify the trend direction and make entries and exits combined with the RSI and ADX indicators.
The core of this strategy is using the Supertrend indicator to determine the current price trend. The Supertrend combines moving averages and ATR, which is effective in judging the direction of price trends. When the direction of the Supertrend makes a reversal, it signals that the price trend is changing.
Specifically, this strategy first calculates the Supertrend direction, RSI and ADX. When the Supertrend turns down, and the RSI shows that the uptrend is fading, it makes short entry. When the Supertrend turns up again, it closes the short position.
The biggest advantage of this strategy is that it can automatically identify price trends and make entries and exits based on the trends, without manual judgment. In addition, using RSI and ADX as filters can effectively avoid false breakouts and improve profitability.
The biggest risk is that the Supertrend itself is not highly accurate in judging price trends, which may generate incorrect signals. Also, no stop loss is set, so the loss per trade can be significant.
Optimization can be made by adjusting Supertrend parameters and adding trailing stop loss to reduce risks.
Several aspects of this strategy can be optimized:
-
Optimize Supertrend parameters to improve accuracy
-
Add trailing stop loss to control per trade loss
-
Add more filters like Bollinger Bands, KDJ to improve profitability
-
Develop similar long entry and exit rules to make the strategy complete
In conclusion, this is an automated trading strategy that judges trends based on the Supertrend. The advantage is high degree of automatization and auto trend detection. The disadvantage is the low accuracy of Supertrend itself and no stop loss. Parameter tuning, adding filters, and stop loss can enhance profitability and risk control.
[/trans]
Strategy Arguments
| Argument | Default | Description |
|---|---|---|
| v_input_1 | 10 | ATR Length |
| v_input_float_1 | 3 | Factor |
| v_input_2 | 7 | ADX Smoothing |
| v_input_3 | 7 | DI Length |
Source (PineScript)
/*backtest
start: 2023-01-16 00:00:00
end: 2024-01-22 00:00:00
period: 1d
basePeriod: 1h
exchanges: [{"eid":"Futures_Binance","currency":"BTC_USDT"}]
*/

//@version=5
strategy("Supertrend Strategy", overlay=true)

atrPeriod = input(10, "ATR Length")
factor = input.float(3.0, "Factor", step = 0.01)

[_, direction] = ta.supertrend(factor, atrPeriod)

adxlen = input(7, title="ADX Smoothing")
dilen = input(7, title="DI Length")
dirmov(len) =>
    up = ta.change(high)
    down = -ta.change(low)
    plusDM = na(up) ? na : (up > down and up > 0 ? up : 0)
    minusDM = na(down) ? na : (down > up and down > 0 ? down : 0)
    truerange = ta.rma(ta.tr, len)
    plus = fixnan(100 * ta.rma(plusDM, len) / truerange)
    minus = fixnan(100 * ta.rma(minusDM, len) / truerange)
    [plus, minus]

adx(dilen, adxlen) =>
    [plus, minus] = dirmov(dilen)
    sum = plus + minus
    adx = 100 * ta.rma(math.abs(plus - minus) / (sum == 0 ? 1 : sum), adxlen)
    adx

sig = adx(dilen, adxlen)

if ta.change(direction) < 0 and ta.rsi(close, 21) < 66 and ta.rsi(close, 3) > 80 and ta.rsi(close, 28) > 49 and sig > 20
    strategy.entry("My Long Entry Id", strategy.long)

if ta.change(direction) > 0
    strategy.close("My Long Entry Id")

//plot(strategy.equity, title="equity", color=color.red, linewidth=2, style=plot.style_areabr)
Detail
https://www.fmz.com/strategy/439762
Last Modified
2024-01-23 15:36:27