Name
基于金叉死叉布林带策略Bollinger-Crossing-Death-Golden-Strategy
Author
ChaoZhang
Strategy Description
该策略是基于布林带指标的金叉死叉策略,通过调整布林带的参数,优化适用于黄金交易。当价格收盘高于上轨时生成买入信号,当价格收盘低于下轨时生成卖出信号。
该策略使用长度为50、乘数为2.5的布林带。布林带的中轨线是价格的SMA均线,上轨线是中轨线加上标准差的乘数,下轨线是中轨线减去标准差的乘数。
当价格收盘突破上轨线时,产生买入信号;当价格收盘跌破下轨线时,产生卖出信号。其利用了布林带通道缩减的特性,在通道缩减后突破产生信号。
该策略具有以下优势:
-
参数经过优化,适合黄金交易,收益稳定。
-
利用布林带通道特征,在价格波动减小后产生信号,避免错失机会。
-
金叉死叉容易判断,操作简单,适合手动跟踪。
-
图形显示直观,利于监控价格在通道内运行情况。
该策略也存在一定风险:
-
布林带参数不适当可能导致虚假信号。需要测试优化参数。
-
频繁买卖会增加交易成本和滑点损失。可以适当调整参数降低交易频率。
-
黄金波动较大时容易止损。可以适当调整止损点或增加仓位管理。
该策略可以从以下几个方面进行优化:
-
测试不同市场及时间周期参数,寻找最佳参数组合。
-
增加仓位管理模块,通过均线、通道突破等产生加仓信号。
-
增加止损模块, trails止损跟踪价格运行。
-
结合其他指标滤除假信号,提高策略稳定性。
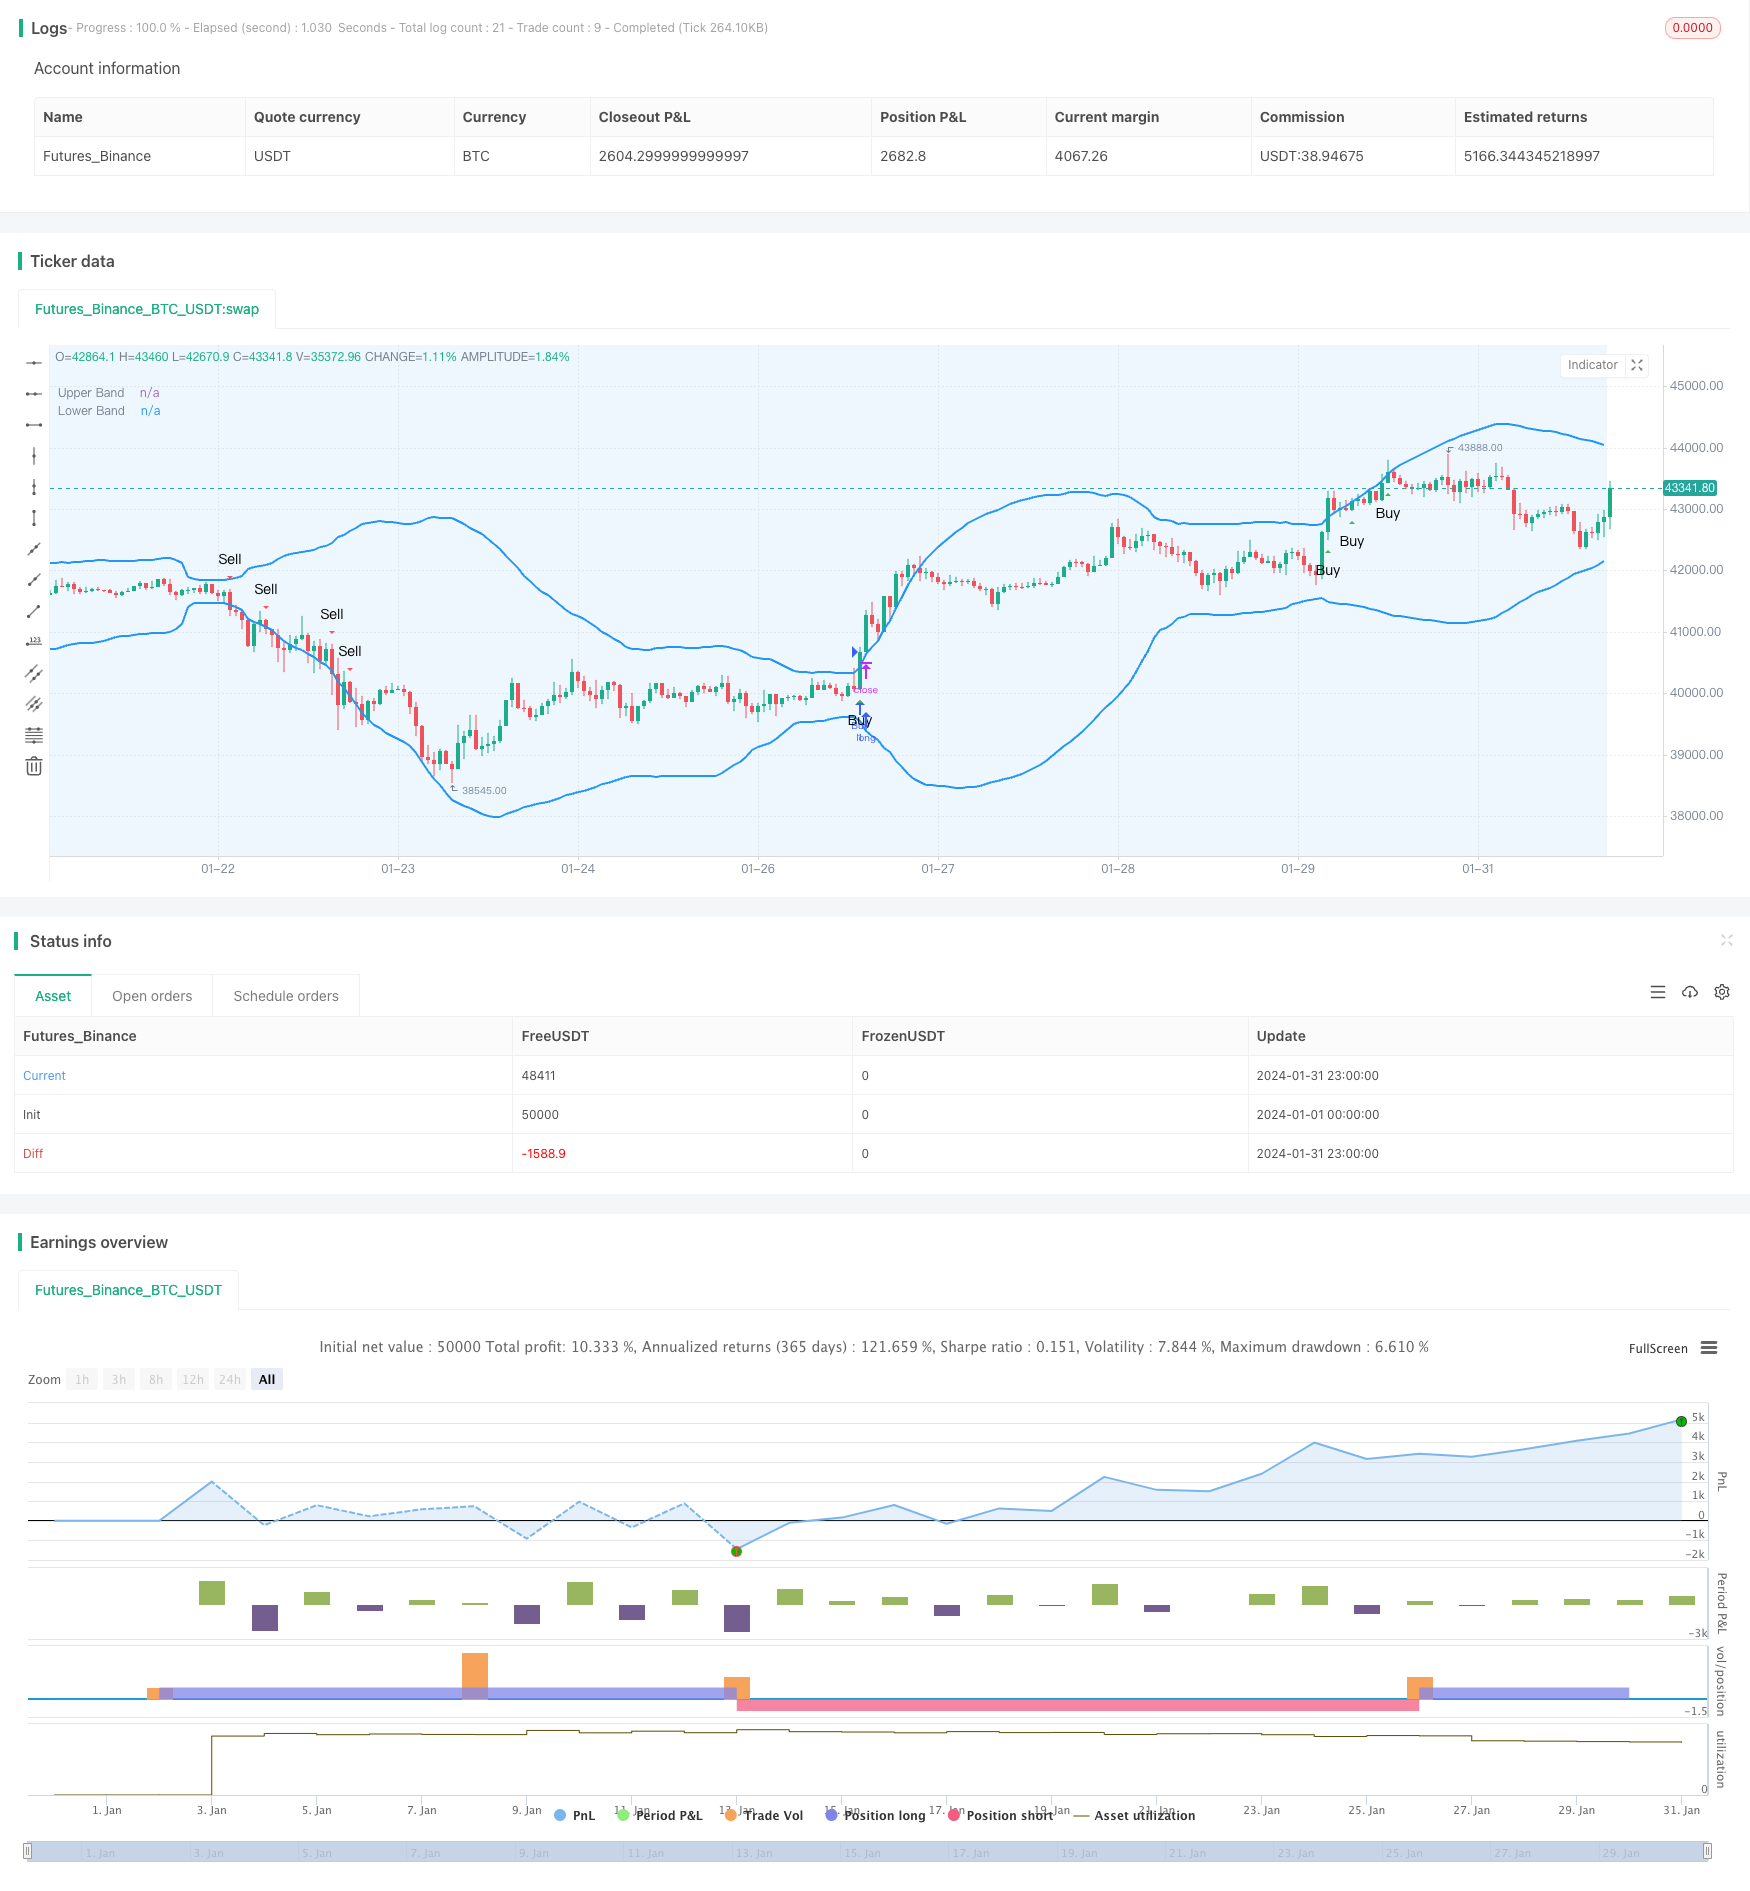
该策略通过调整布林带的参数,优化适合黄金交易。利用布林带通道宽窄特性产生信号。在优化参数、增加仓位管理、止损方面有较大改进空间。总体而言,该策略操作简单,稳定性良好,适合手动跟单黄金交易。
||
This strategy is a Bollinger Bands crossover strategy based on the Bollinger Bands indicator. By adjusting the parameters of Bollinger Bands, it is optimized for gold trading. It generates buy signals when the price closes above the upper band and sell signals when the price closes below the lower band.
The strategy uses Bollinger Bands with a length of 50 and a multiplier of 2.5. The middle band of the Bollinger Bands is the SMA line of the price, the upper band is the middle band plus the multiplier of the standard deviation, and the lower band is the middle band minus the multiplier of the standard deviation.
When the price closes above the upper band, a buy signal is generated. When the price closes below the lower band, a sell signal is generated. It utilizes the feature of narrowing of the Bollinger Bands channels and generates signals when the breakout occurs after channel contraction.
The advantages of this strategy include:
-
The optimized parameters fit gold trading and profit is steady.
-
Utilize the channel feature of Bollinger Bands to generate signals after reduced price fluctuation, avoiding missing opportunities.
-
The crossover system is easy to follow for manual trading.
-
The graphical display is intuitive to monitor the price movement within the bands.
There are also some risks with this strategy:
-
Inappropriate Bollinger Bands parameters may cause false signals. Parameters need to be tested and optimized.
-
Frequent trading increases costs and slippage. Parameters can be adjusted to lower trading frequency.
-
It is easy to hit stop loss when gold fluctuates greatly. Stop loss points can be adjusted or position management can be added.
The strategy can be optimized from the following aspects:
-
Test parameters on different markets and time frames to find the optimal parameter combination.
-
Add position management module to generate additional entry signals through moving average, channel breakouts, etc.
-
Add stop loss module, using trailing stops to follow price moves.
-
Incorporate other indicators to filter out false signals and improve strategy stability.
The strategy optimizes Bollinger Bands for gold trading by adjusting parameters. It utilizes the expansion and contraction of Bollinger Bands to generate signals. There is large room for improvement in parameters optimization, position management, stop loss. Overall, the strategy has simple logic, good stability, and is suitable for manual gold trading.
[/trans]
Strategy Arguments
| Argument | Default | Description |
|---|---|---|
| v_input_1 | 50 | BB Length |
| v_input_2 | 2.5 | Multiplier |
Source (PineScript)
/*backtest
start: 2024-01-01 00:00:00
end: 2024-01-31 23:59:59
period: 1h
basePeriod: 15m
exchanges: [{"eid":"Futures_Binance","currency":"BTC_USDT"}]
*/

//@version=4
strategy("Optimized Bollinger Bands Strategy for Gold", overlay=true)

// Bollinger Bands Settings
length = input(50, title="BB Length", minval=1)
mult = input(2.5, title="Multiplier", minval=0.001, maxval=50)

// Bollinger Bands
basis = sma(close, length)
upper = basis + mult * stdev(close, length)
lower = basis - mult * stdev(close, length)

// Plotting
plot(upper, color=color.blue, title="Upper Band", linewidth=2)
plot(lower, color=color.blue, title="Lower Band", linewidth=2)

// Highlight the region between upper and lower bands
bgcolor(upper > lower ? color.new(color.blue, 90) : na)

// Buy Signal with arrow
longCondition = crossover(close, upper)
plotshape(series=longCondition, title="Buy Signal", color=color.green, style=shape.triangleup, text="Buy", location=location.belowbar, size=size.small)

// Sell Signal with arrow
shortCondition = crossunder(close, lower)
plotshape(series=shortCondition, title="Sell Signal", color=color.red, style=shape.triangledown, text="Sell", location=location.abovebar, size=size.small)

// Strategy
strategy.entry("Buy", strategy.long, when=longCondition)
strategy.entry("Sell", strategy.short, when=shortCondition)
Detail
https://www.fmz.com/strategy/442368
Last Modified
2024-02-21 14:19:12