Name
基于阿隆震荡器的股票交易策略Aroon-Oscillator-Based-Stock-Trading-Strategy
Author
ChaoZhang
Strategy Description
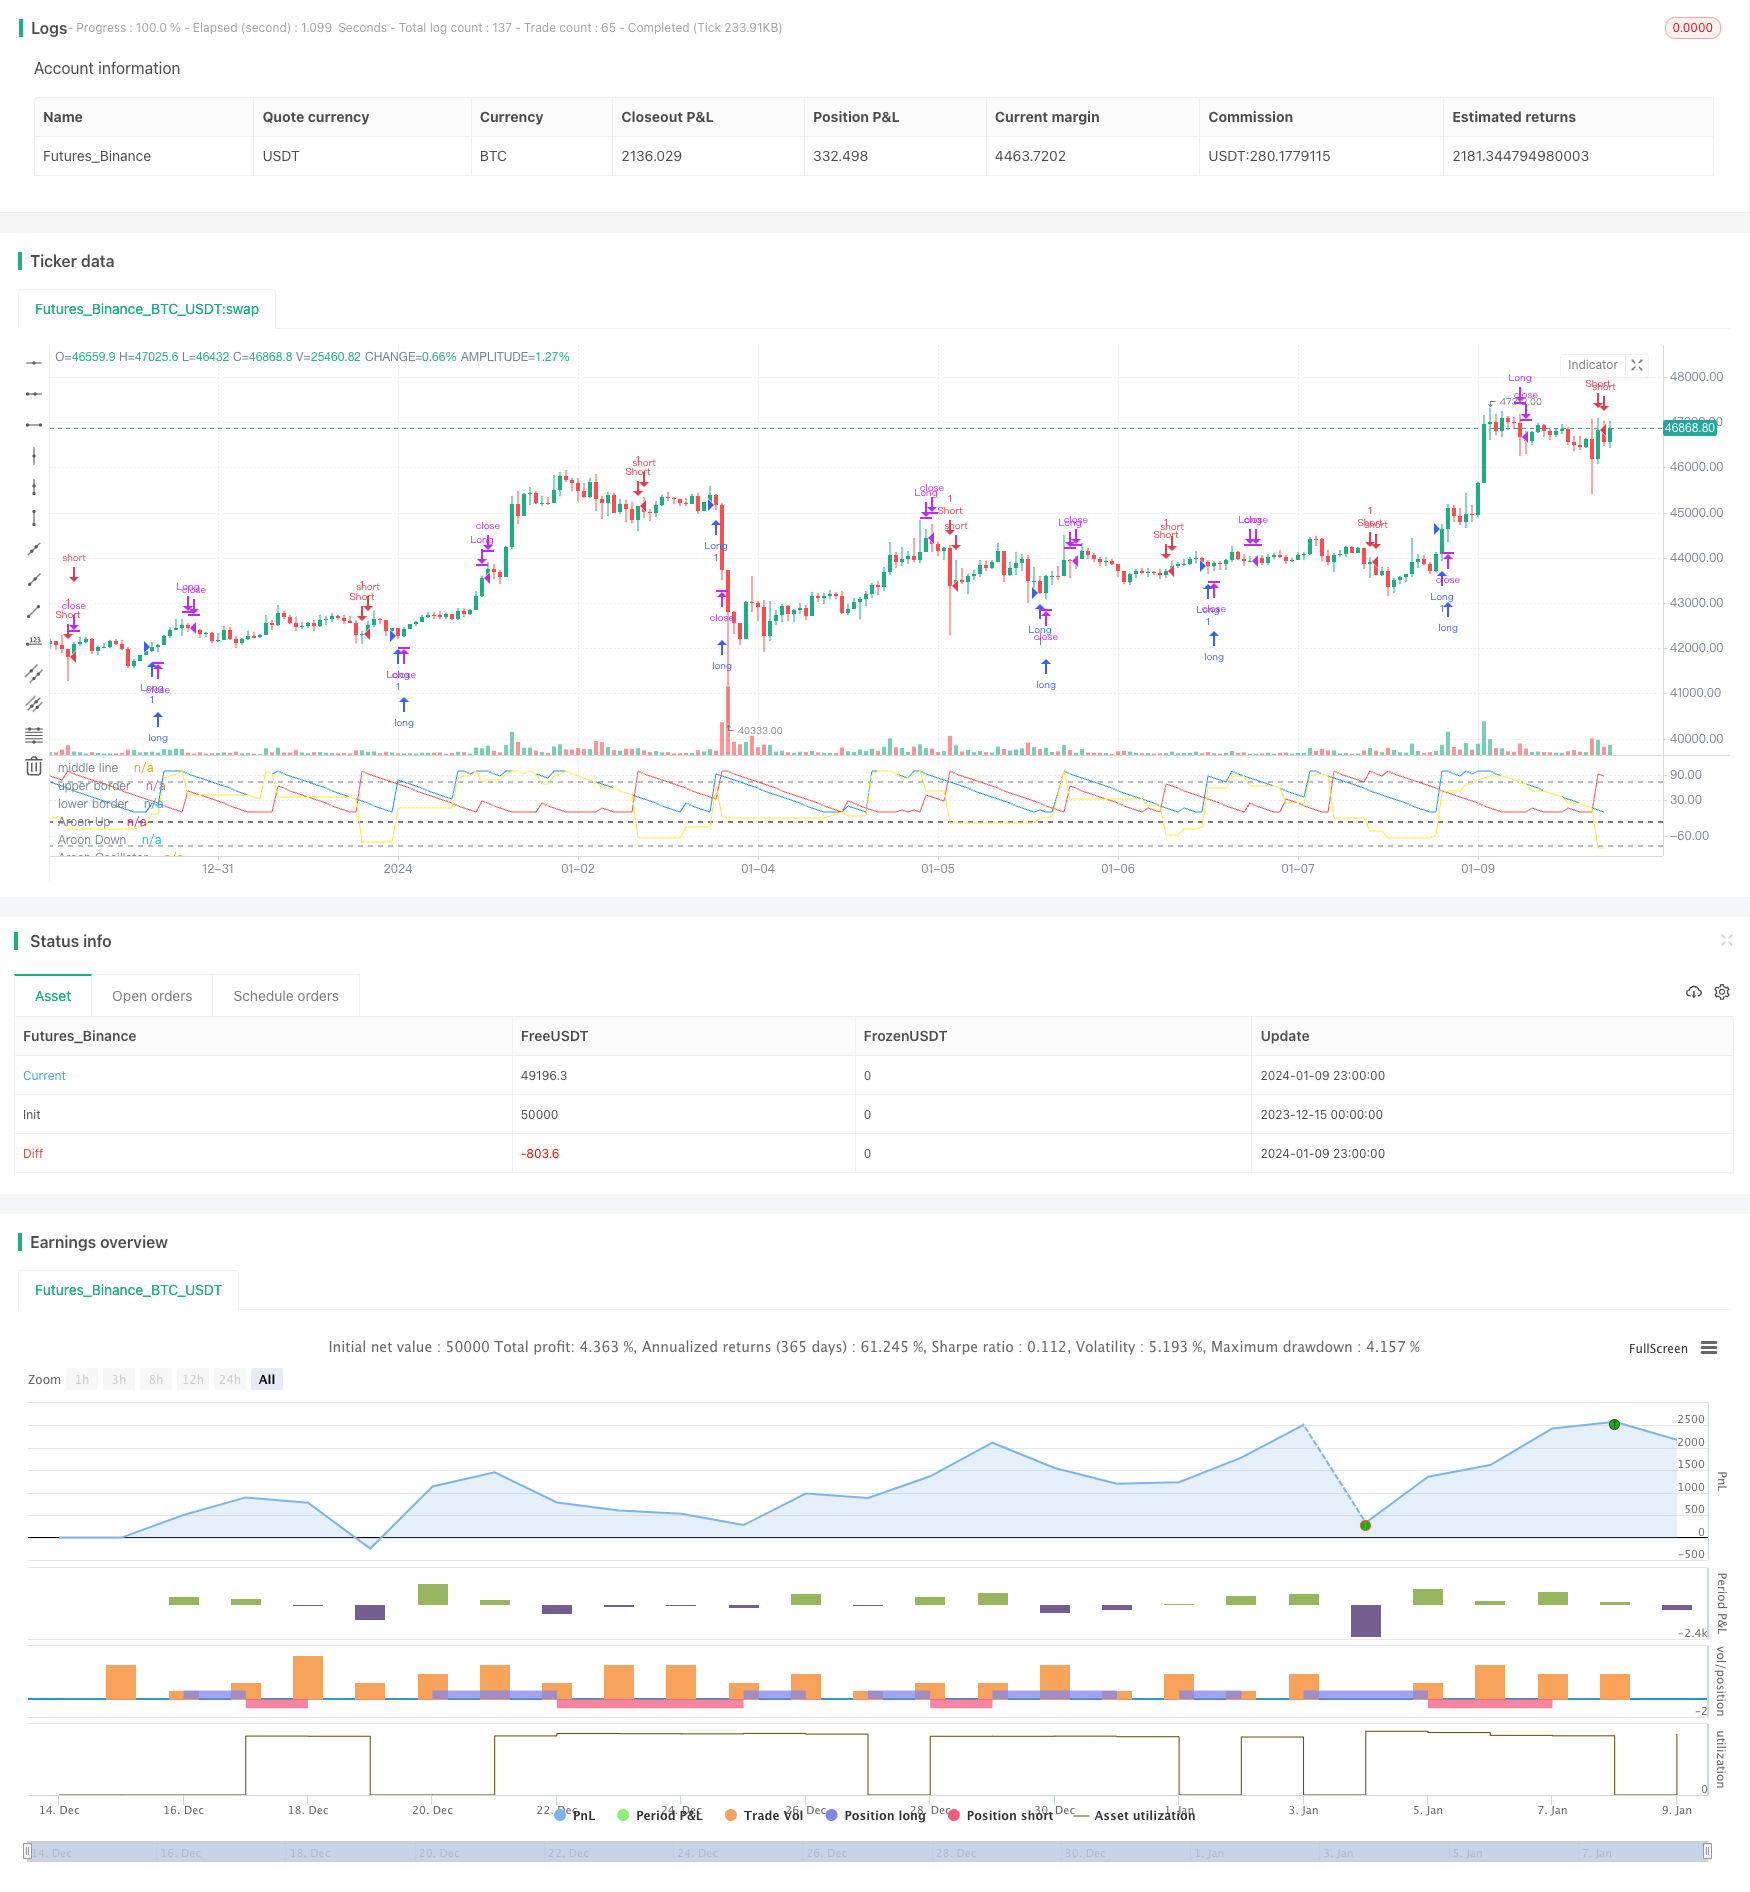
本策略名为“Saucius 阿隆震荡器策略”,它适用于价格波动性较大、趋势不明显的股票、指数和大宗商品。策略使用阿隆震荡器指标识别价格趋势,结合多个参数设定入场和出场条件,实现对这类风险资产的自动交易。
该策略源自阿隆线创始人Tushar Chande的思路。Chande认为,当阿隆震荡器高于或低于50时,可以识别出多头和空头趋势。这有助于弥补简单阿隆线和阿隆交叉在非趋势市场中的不足。
具体来说,策略首先计算长度为19周期的阿隆上线、阿隆下线和阿隆震荡器。震荡器由上线减去下线计算得到。然后设定中线为-25,上轨为75,下轨为-85。当天震荡器上穿中线时做多,下穿中线时做空。平仓条件为上穿上轨平多仓,下穿下轨平空仓。
这样,中线用于判断趋势方向进入场内,上下轨用于趋势反转退出场外,实现了基于阿隆震荡器指标的自动化交易。
与传统趋势跟踪策略相比,本策略具有以下优势:
- 适用于波动较大、趋势不明显的品种,比简单趋势策略效果更好
- 使用阿隆震荡器判断趋势更可靠
- 多参数设定条件严谨,避免错误交易
- 获利快速,有效控制亏损风险
总的来说,该策略结合阿隆震荡器指标的优势,实现了对特定品种的自动化交易,胜率和盈利能力良好。
本策略也存在一定的风险:
- 参数设置需要根据不同品种调整优化,否则会影响效果
- 交易频率可能较高,会增加交易成本和滑点成本
- 依赖技术指标,在指标失效时可能产生损失
这些风险点是可以通过调整参数、优化代码来改进和减小的。此外,合理的位置和资金管理也能有效控制潜在风险。
为进一步提高策略效果,可以从以下几个方面进行优化:
- 调整参数,针对不同品种和市场环境进行测试
- 增加其他技术指标的组合,形成更强大的交易信号
- 增加止损策略,有效控制单笔亏损大小
- 结合量能指标,避免虚拟突破产生错误交易
- 优化入场条件,减少不必要的交易次数
通过多方位测试和优化,策略的稳定性、胜率和盈利能力还可以得到大幅提升。
本策略基于阿隆震荡器指标创造性地实现了对波动性较大、趋势不明显品种的自动化交易。相比传统趋势策略,其在这类品种上效果更好,通过参数设定也实现了严谨的交易条件。策略优势显著,但也存在一定改进空间。通过针对性优化,效果还可得到进一步提高。该策略为量化交易实践提供了一个可参考的思路。
||
This strategy is named "Saucius Aroon Oscillator Strategy". It suits stocks, indexes and commodities with high volatility but unclear trend, where the prospects of future prices are uncertain. The strategy identifies price trends using the Aroon Oscillator indicator and sets entry and exit conditions based on multiple parameters to implement automated trading of these risky assets.
The idea behind this strategy originated from Aroon lines creator Tushar Chande. Chande suggested that uptrends and downtrends can be identified when the Aroon Oscillator is above or below 50. This helps to mitigate the shortcomings of simple Aroon lines and crosses in non-trending periods.
Specifically, the strategy first calculates the 19-period Aroon Up, Aroon Down lines and Aroon Oscillator. The oscillator is calculated by subtracting the Down line from the Up line. The middle line is then set at -25, upper rail at 75 and lower rail at -85. When the oscillator goes above the middle line, long position is opened. When it goes below, short position is opened. Exit conditions are closing long when the oscillator goes above the upper rail and closing short when it goes below the lower rail.
Thus, the middle line is used to determine the trend direction to entry, the upper and lower rails are used to exit when trend reversal, realizing automated trading based on the Aroon Oscillator indicator.
Compared with traditional trend following strategies, this strategy has the following advantages:
- Suits assets with high volatility and unclear trends, works better than simple trend strategies
- Identifying trends via Aroon Oscillator is more reliable
- Multiple parameter settings make the trading conditions rigorous, avoiding wrong trades
- Fast profit taking and effective loss risk control
In summary, by combining the strengths of the Aroon Oscillator indicator, the strategy achieves automated trading of specific assets with good win rate and profitability.
There are also some risks with this strategy:
- Parameter tuning is needed for different assets, otherwise it may affect performance
- High trading frequency may increase transaction and slippage costs
- Relying on technical indicators, losses may occur when indicators fail
These risks can be reduced and improved by adjusting parameters and optimizing the code. In addition, proper position sizing and money management can also effectively control potential risks.
To further improve strategy performance, optimizations can be made in the following aspects:
- Adjust parameters and test under different assets and market environments
- Add combinations of other technical indicators for stronger trading signals
- Add stop loss strategies to effectively limit per trade loss size
- Incorporate volume indicators to avoid false breakouts
- Optimize entry conditions to reduce unnecessary trades
Through comprehensive testing and optimization, the stability, win rate and profitability of the strategy can be greatly improved.
This strategy creatively achieved automated trading of assets with high volatility and unclear trends based on the Aroon Oscillator indicator. Compared with traditional trend strategies, it performs better on these types of assets, and its rigorous trading conditions are also achieved through parameter settings. The advantages of the strategy are remarkable, but there is still room for improvement. Further enhancement can be obtained through targeted optimizations. The strategy provides a reference for quantitative trading practices.
[/trans]
Strategy Arguments
| Argument | Default | Description |
|---|---|---|
| v_input_1 | 19 | length |
| v_input_2 | -25 | level_middle |
| v_input_3 | 75 | levelhigh |
| v_input_4 | -85 | levellow |
Source (PineScript)
/*backtest
start: 2023-12-15 00:00:00
end: 2024-01-10 00:00:00
period: 1h
basePeriod: 15m
exchanges: [{"eid":"Futures_Binance","currency":"BTC_USDT"}]
*/

//@version=2
// by Saucius Finance https://saucius-finance.blogspot.com/
// copyrights reserved :)
// This strategy derives form the consideration of the author, Tushar Chande, that, in "more patterns" paragraph,
// long and short trends are identified by oscillator < or > line 50.
// This helps because simple Aroon and Aroon crosses suffer in not trending periods.
// original article avabile in:" Stocks & Commodities, V. 13:9 (369-374) : A Time Price Oscillator by Tushar Chande, Ph.D.""
strategy("Aroon Oscillator strategy by Saucius", overlay=false)
//building aroon lines, Embodying both Aroon line (Up and Down) and Aroon Oscillator
length = input(19, minval=1)
level_middle = input(-25, minval=-90, maxval=90, step = 5)
levelhigh = input(75,  minval=-100, maxval=100, step = 5)
levellow = input(-85,  minval=-100, maxval=100, step = 5)
upper = 100 * (highestbars(high, length+1) + length)/length
lower = 100 * (lowestbars(low, length+1) + length)/length
oscillator = upper - lower
plot(upper, title="Aroon Up", color=blue)
plot(lower, title="Aroon Down", color=red)
plot(oscillator, title="Aroon Oscillator", color = yellow)
hline(level_middle, title="middle line", color=gray,  linewidth=2)
hline(levelhigh, title ="upper border", color=gray,  linewidth=1)
hline(levellow, title ="lower border", color=gray, linewidth=1)

// Entry //
entryl = oscillator[1] < level_middle[1] and oscillator > level_middle
entrys = oscillator[1] > level_middle[1] and oscillator < level_middle
strategy.entry("Long", true, when = entryl)
strategy.entry("Short", false, when = crossunder (oscillator, level_middle))


// === EXIT===
exitL1 = oscillator[1] > levelhigh[1] and oscillator < levelhigh
exitS1 =  oscillator[1] < levellow[1] and oscillator > levellow
strategy.close("Long", when=entrys)
strategy.close("Short", when=entryl)
strategy.close("Long", when= exitL1)
strategy.close("Short", when= exitS1)
Detail
https://www.fmz.com/strategy/438795
Last Modified
2024-01-15 14:08:33