Name
基于20日EMA通道的交易策略All-about-EMA-Channel-Trading-Strategy
Author
ChaoZhang
Strategy Description
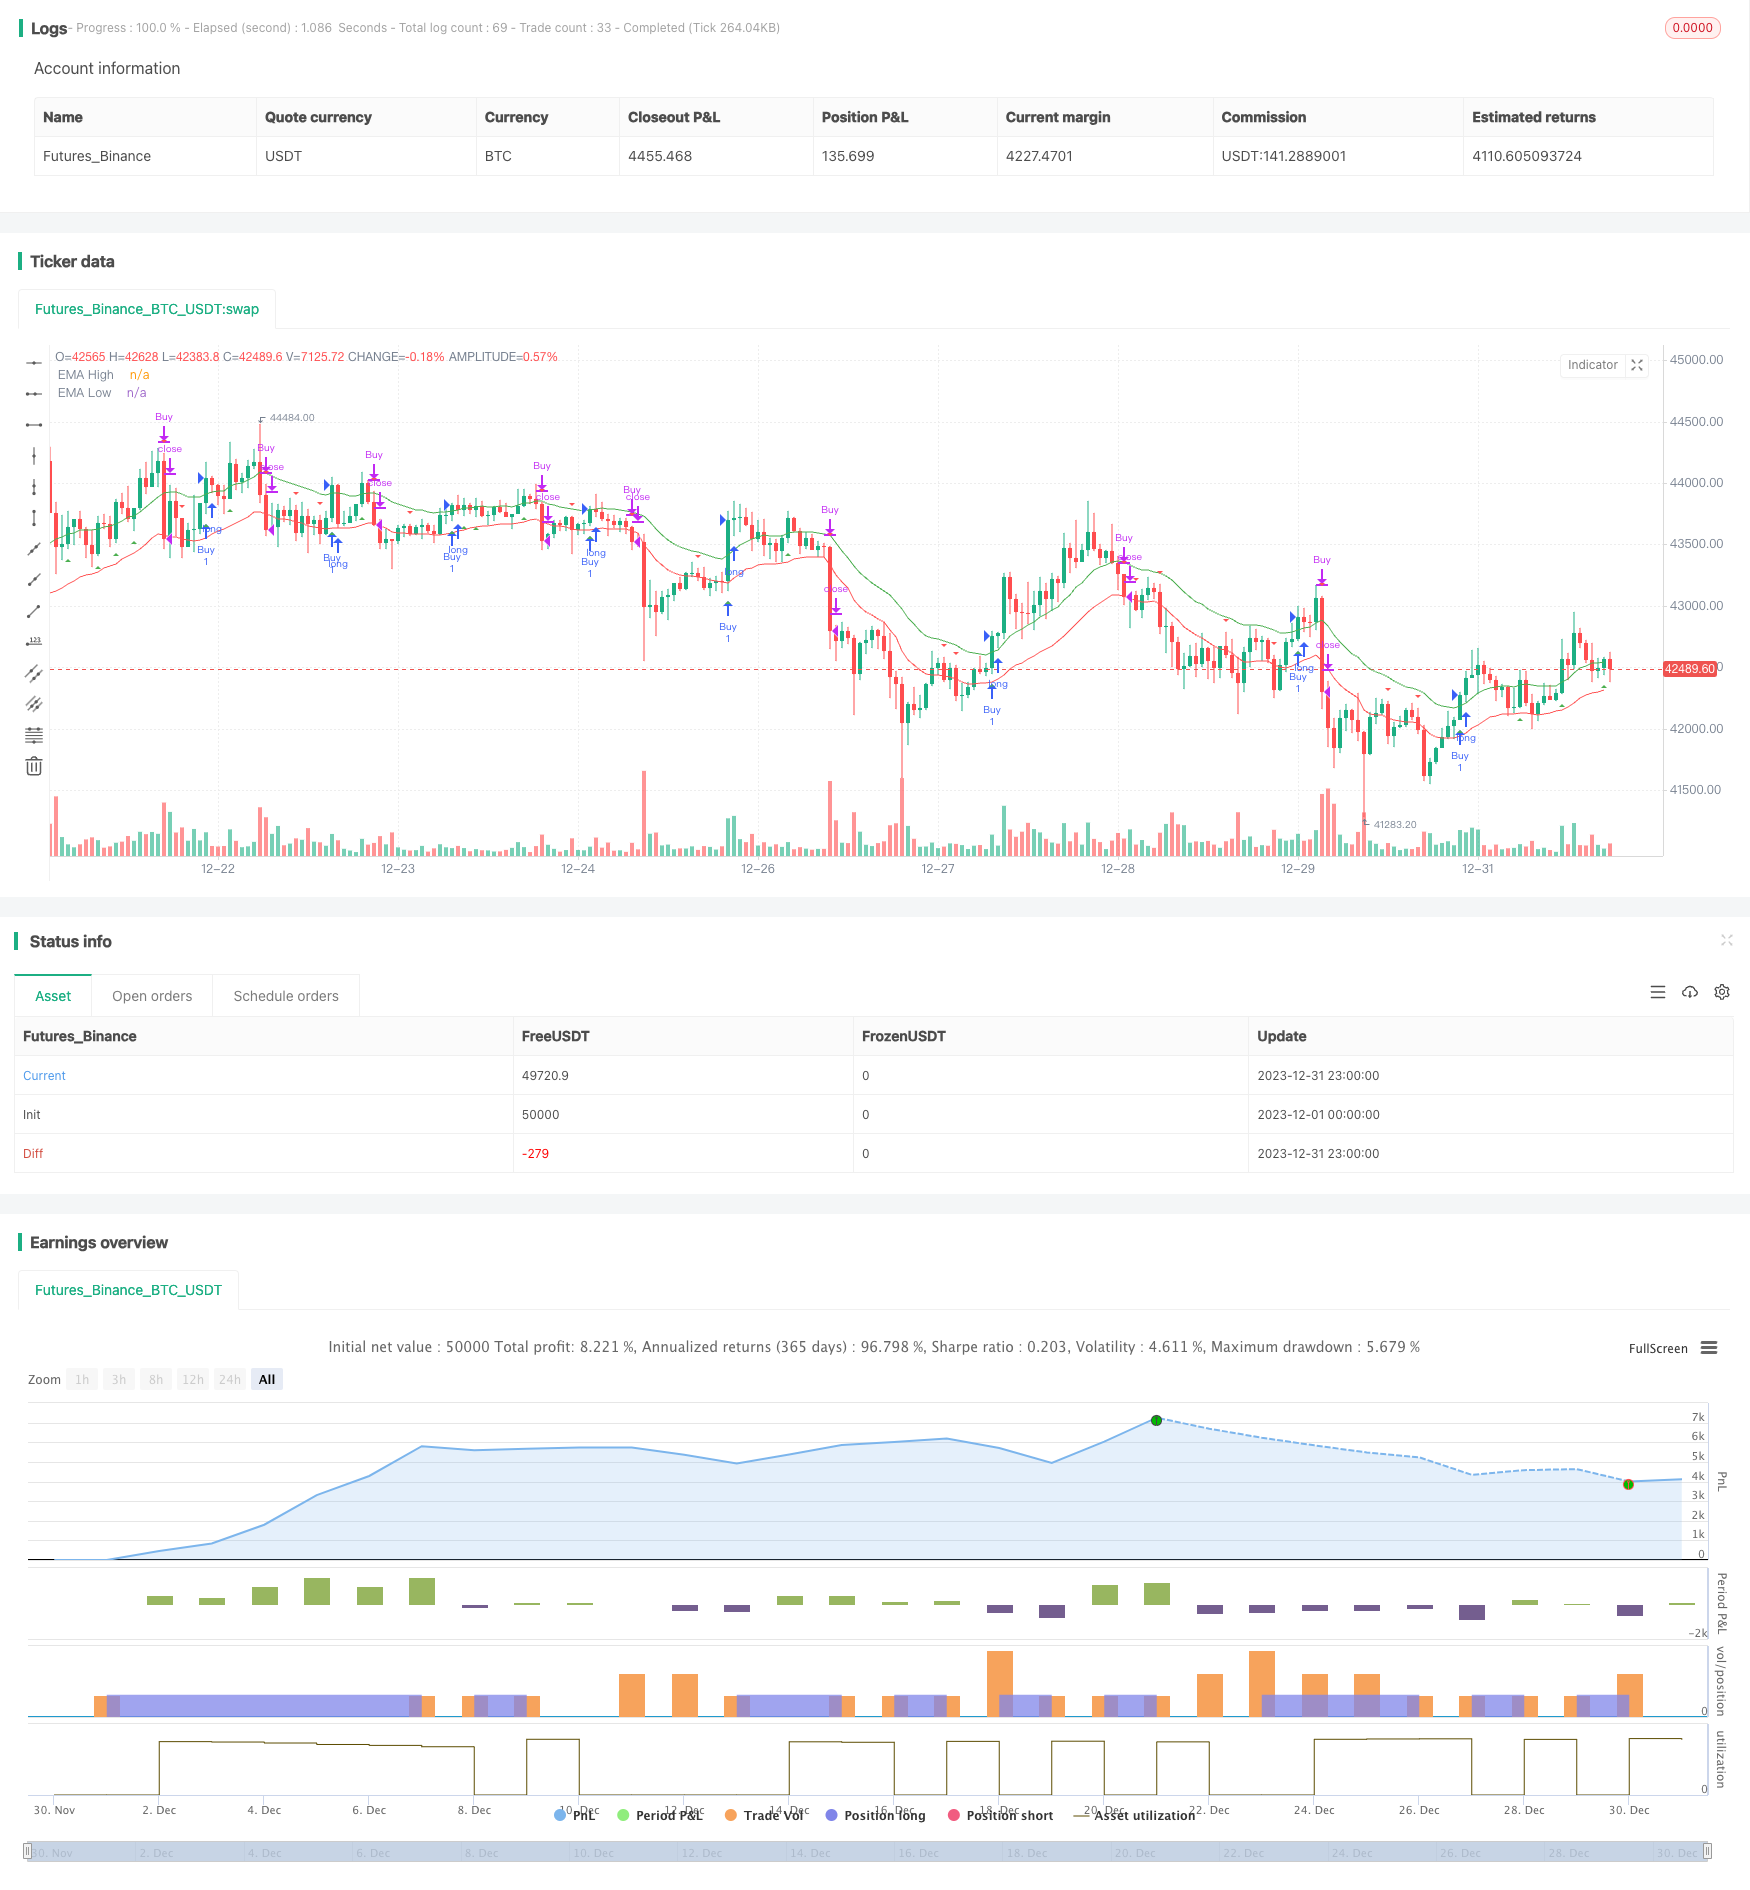
该策略基于20日指数移动平均线(EMA)构建通道,当价格突破通道上沿时做多,当价格跌破通道下沿时做空,属于趋势跟踪策略。
- 计算20日EMA的高点和低点,构建通道。
- 当收盘价大于20日EMA高点时,做多。
- 当收盘价小于20日EMA低点时,做空。
- 止损点为通道的另一端,如做多止损为20日EMA低点。
- 使用EMA构建通道,可以有效跟踪趋势。
- 20日EMA参数简单实用。
- 采用突破做信号,可以减少错误交易。
- 止损点设置合理,最大程度控制风险。
- 突破信号可能出现误报。
- 震荡行情中容易止损。
- 参数不当可能导致过于灵敏或迟钝。
风险解决方法:
- 结合其他指标过滤信号。
- 优化参数,适应不同周期。
- 谨慎操作,注意资金管理。
- 结合量价指标过滤错误信号。
- 测试不同EMA周期参数的效果。
- 增加移动止损来锁定盈利。
- 结合波动率指标判断趋势强弱。
该策略整体简单实用,基于EMA通道构建,属于典型的趋势跟踪策略。有突破做信号的特点,但也存在一定的误报风险。可以通过优化参数、增加过滤器等方式提高策略效果,值得进一步测试与优化。
||
This strategy builds a channel based on 20-day Exponential Moving Average (EMA) lines, goes long when price breaks through the upper band and goes short when price breaks through the lower band. It belongs to trend following strategies.
- Calculate 20-day EMA high and low to build the channel.
- Go long when close price is above 20-day EMA high.
- Go short when close price is below 20-day EMA low.
- Set stop loss to the other side of the channel, e.g. 20-day EMA low for long trade.
- EMA channel effectively tracks the trend.
- 20-day EMA parameter is simple and practical.
- Breakout signals help reduce wrong trades.
- Stop loss setting reasonably controls risks.
- Breakout signals may have false positives.
- Prone to be stopped out in range-bound market.
- Improper parameters lead to oversensitivity or sluggishness.
Risk Management:
- Add filters with other indicators.
- Optimize parameters for different cycles.
- Trade cautiously and manage capital carefully.
- Add filters with volume or momentum indicators.
- Test effectiveness of different EMA periods.
- Add trailing stop to lock in profits.
- Combine volatility measures for trend strength.
This is a simple and practical strategy building EMA channel for trend following. It has breakout signals but also risks of false signals. The strategy can be improved by optimizing parameters and adding filters. Worth further testing and enhancement.
[/trans]
Source (PineScript)
/*backtest
start: 2023-12-01 00:00:00
end: 2023-12-31 23:59:59
period: 1h
basePeriod: 15m
exchanges: [{"eid":"Futures_Binance","currency":"BTC_USDT"}]
*/

//@version=4
strategy("EMA Channel Strategy with Alerts", shorttitle="EMA Channel", overlay=true)

// Define EMA length
emaLength = 20

// Calculate EMA values
emaHigh = ema(high, emaLength)
emaLow = ema(low, emaLength)

// Define the condition for a buy signal
buyCondition = crossover(close, emaHigh)

// Define the condition for a sell signal
sellCondition = crossunder(close, emaLow)

// Plot the EMA lines
plot(emaHigh, color=color.green, title="EMA High")
plot(emaLow, color=color.red, title="EMA Low")

// Plot buy and sell signals
plotshape(buyCondition, style=shape.triangleup, location=location.belowbar, color=color.green, title="Buy Signal")
plotshape(sellCondition, style=shape.triangledown, location=location.abovebar, color=color.red, title="Sell Signal")

// Strategy
strategy.entry("Buy", strategy.long, when=buyCondition)
strategy.close("Buy", when=sellCondition)

// Define and trigger alerts
alertcondition(buyCondition, title="Buy Alert", message="Buy signal - Price crossed above EMA High")
alertcondition(sellCondition, title="Sell Alert", message="Sell signal - Price crossed below EMA Low")
Detail
https://www.fmz.com/strategy/440429
Last Modified
2024-01-30 15:24:07