Name
基于AO指标和均线的趋势跟踪策略AO-Indicator-Based-Trend-Following-Strategy
Author
ChaoZhang
Strategy Description
本策略通过Awesome Oscillator(AO)指标判断趋势方向,并结合移动平均线进行趋势确认,属于趋势跟踪策略。当AO指标上穿0轴线并且快速线上穿慢速线时做多,当AO指标下穿0轴线并且快速线下穿慢速线时做空,利用趋势的方向性来获利。
本策略主要基于AO指标来判断趋势方向。AO指标是根据}-{线的中点和5周期、34周期的简单移动平均线的差计算得到的,属于 Momentum 类别指标。当 AO 指标为正时,代表着短期移动平均线高于长期移动平均线,Should be interpreted as a bullish sign. 反之当 AO 为负时,代表着短期移动平均线低于长期移动平均线,Should be interpreted as a bearish sign。
所以,AO 指标可以有效地判断趋势的方向。当 AO 上穿 0 轴线时,代表着市场趋势转为看涨,应该做多;当 AO 下穿 0 轴线时,代表着市场趋势转为看跌,应该做空。
另外,本策略还加入了 20 周期和 200 周期的移动平均线。这两个均线的角度代表着中长期趋势的方向。仅仅依靠 AO 指标来判断短期趋势方向还不够,还需要中长期趋势的确认,所以加入了移动平均线的判断。
当快速均线上穿慢速均线,中长期趋势转为看涨时,我们在 AO 上穿 0 轴线的时候做多,随着趋势走高来获利;当快速均线下穿慢速均线,中长期趋势转为看跌时,我们在 AO 下穿 0 轴线的时候做空,随着趋势走低获利。
- 利用 AO 指标判断短期趋势方向,准确率较高
- 加入移动平均线判断中长期趋势,可以有效过滤假突破
- 获利快,适合短线操作
- AO 指标下穿 0 轴线和移动平均线发出做空信号时,价格可能继续上涨一段时间才转头向下,存在antry的风险
- AO 指标上穿 0 轴线和移动平均线发出做多信号时,价格可能继续下跌一段时间才转头向上,存在antry的风险
- 大级别边际效应的风险。在市场突破重要的技术位置后,AO 指标可能发生错乱,从而产生错误信号
- 可以测试不同参数的移动平均线组合,如 10 周期和 50 周期,寻找更匹配的均线
- 可以加入其他指标进行组合,如 RSI 指标,使信号更加可靠
- 可以优化固定止损比例,让策略的风险收益比更好
本策略属于简单的趋势跟踪策略,通过 AO 指标判断短期趋势且中长期趋势确认的思路是正确的。AO 指标和移动平均线的组合使用广泛,较为成熟,本策略也具有很强的可靠性。通过进一步参数优化和组合指标优化,可以使本策略的效果更加出色。
||
This strategy uses the Awesome Oscillator (AO) indicator to determine the trend direction and moving averages to confirm the trend. It belongs to the trend following strategy. It goes long when the AO indicator crosses above the 0 level and the fast MA crosses above the slow MA, and goes short when the AO crosses below the 0 level and the fast MA crosses below the slow MA, taking advantage of the directionality of trends to profit.
This strategy mainly relies on the AO indicator to determine the short-term trend direction. The AO indicator is calculated based on the difference between the 5-period and 34-period simple moving averages of the mid-price. It belongs to the Momentum category of indicators. When the AO is positive, it means the short-term MA is above the long-term MA, which should be interpreted as a bullish sign. When the AO is negative, it means the short-term MA is below the long-term MA, which should be interpreted as a bearish sign.
Therefore, the AO indicator can effectively determine the direction of the trend. When the AO crosses above the 0 level, it signals that the market trend has turned bullish and we should go long. When the AO crosses below the 0 level, it signals that the market trend has turned bearish and we should go short.
In addition, this strategy also incorporates the 20-period and 200-period moving averages. The slope of these two MAs represents the direction of the medium to long-term trend. Judging only by the AO indicator for the short-term trend direction is not enough, confirmation from the mid-long term trend is also needed, hence the addition of the MA crossover rules.
When the fast MA crosses above the slow MA, the mid-long term trend turns bullish, we go long when the AO crosses above 0 to ride the uptrend. When the fast MA crosses below the slow MA, the mid-long term trend turns bearish, we go short when the AO crosses below 0 to ride the downtrend.
- Accurately determining short-term trend direction using the AO indicator
- Adding MA filters to confirm mid-long term trend, effectively avoiding false breakouts
- Fast profits, suitable for short-term trading
- Risk of failed entry when going short. Price may continue going up for some time after AO crosses below 0 and MA signals sell before turning down.
- Risk of failed entry when going long. Price may continue going down for some time after AO crosses above 0 and MA signals buy before turning up.
- Risk of distorted AO signals at major technical levels.
- Test different MA combinations to find better settings, e.g. 10- and 50-period MAs
- Add other indicators like RSI for signal confirmation
- Optimize stop loss percentage for better risk/reward ratio
This is a simple trend following strategy. Using the AO to determine short-term trend direction confirmed by mid-long term MAs is logically sound. The combination of AO and MAs sees widespread usage and is relatively mature. This strategy is also very reliable. Further optimization of parameters and other indicators can improve strategy performance.
[/trans]
Strategy Arguments
| Argument | Default | Description |
|---|---|---|
| v_input_bool_1 | true | long |
| v_input_bool_2 | true | short |
| v_input_float_1 | 10 | profit |
| v_input_float_2 | 5 | stop |
Source (PineScript)
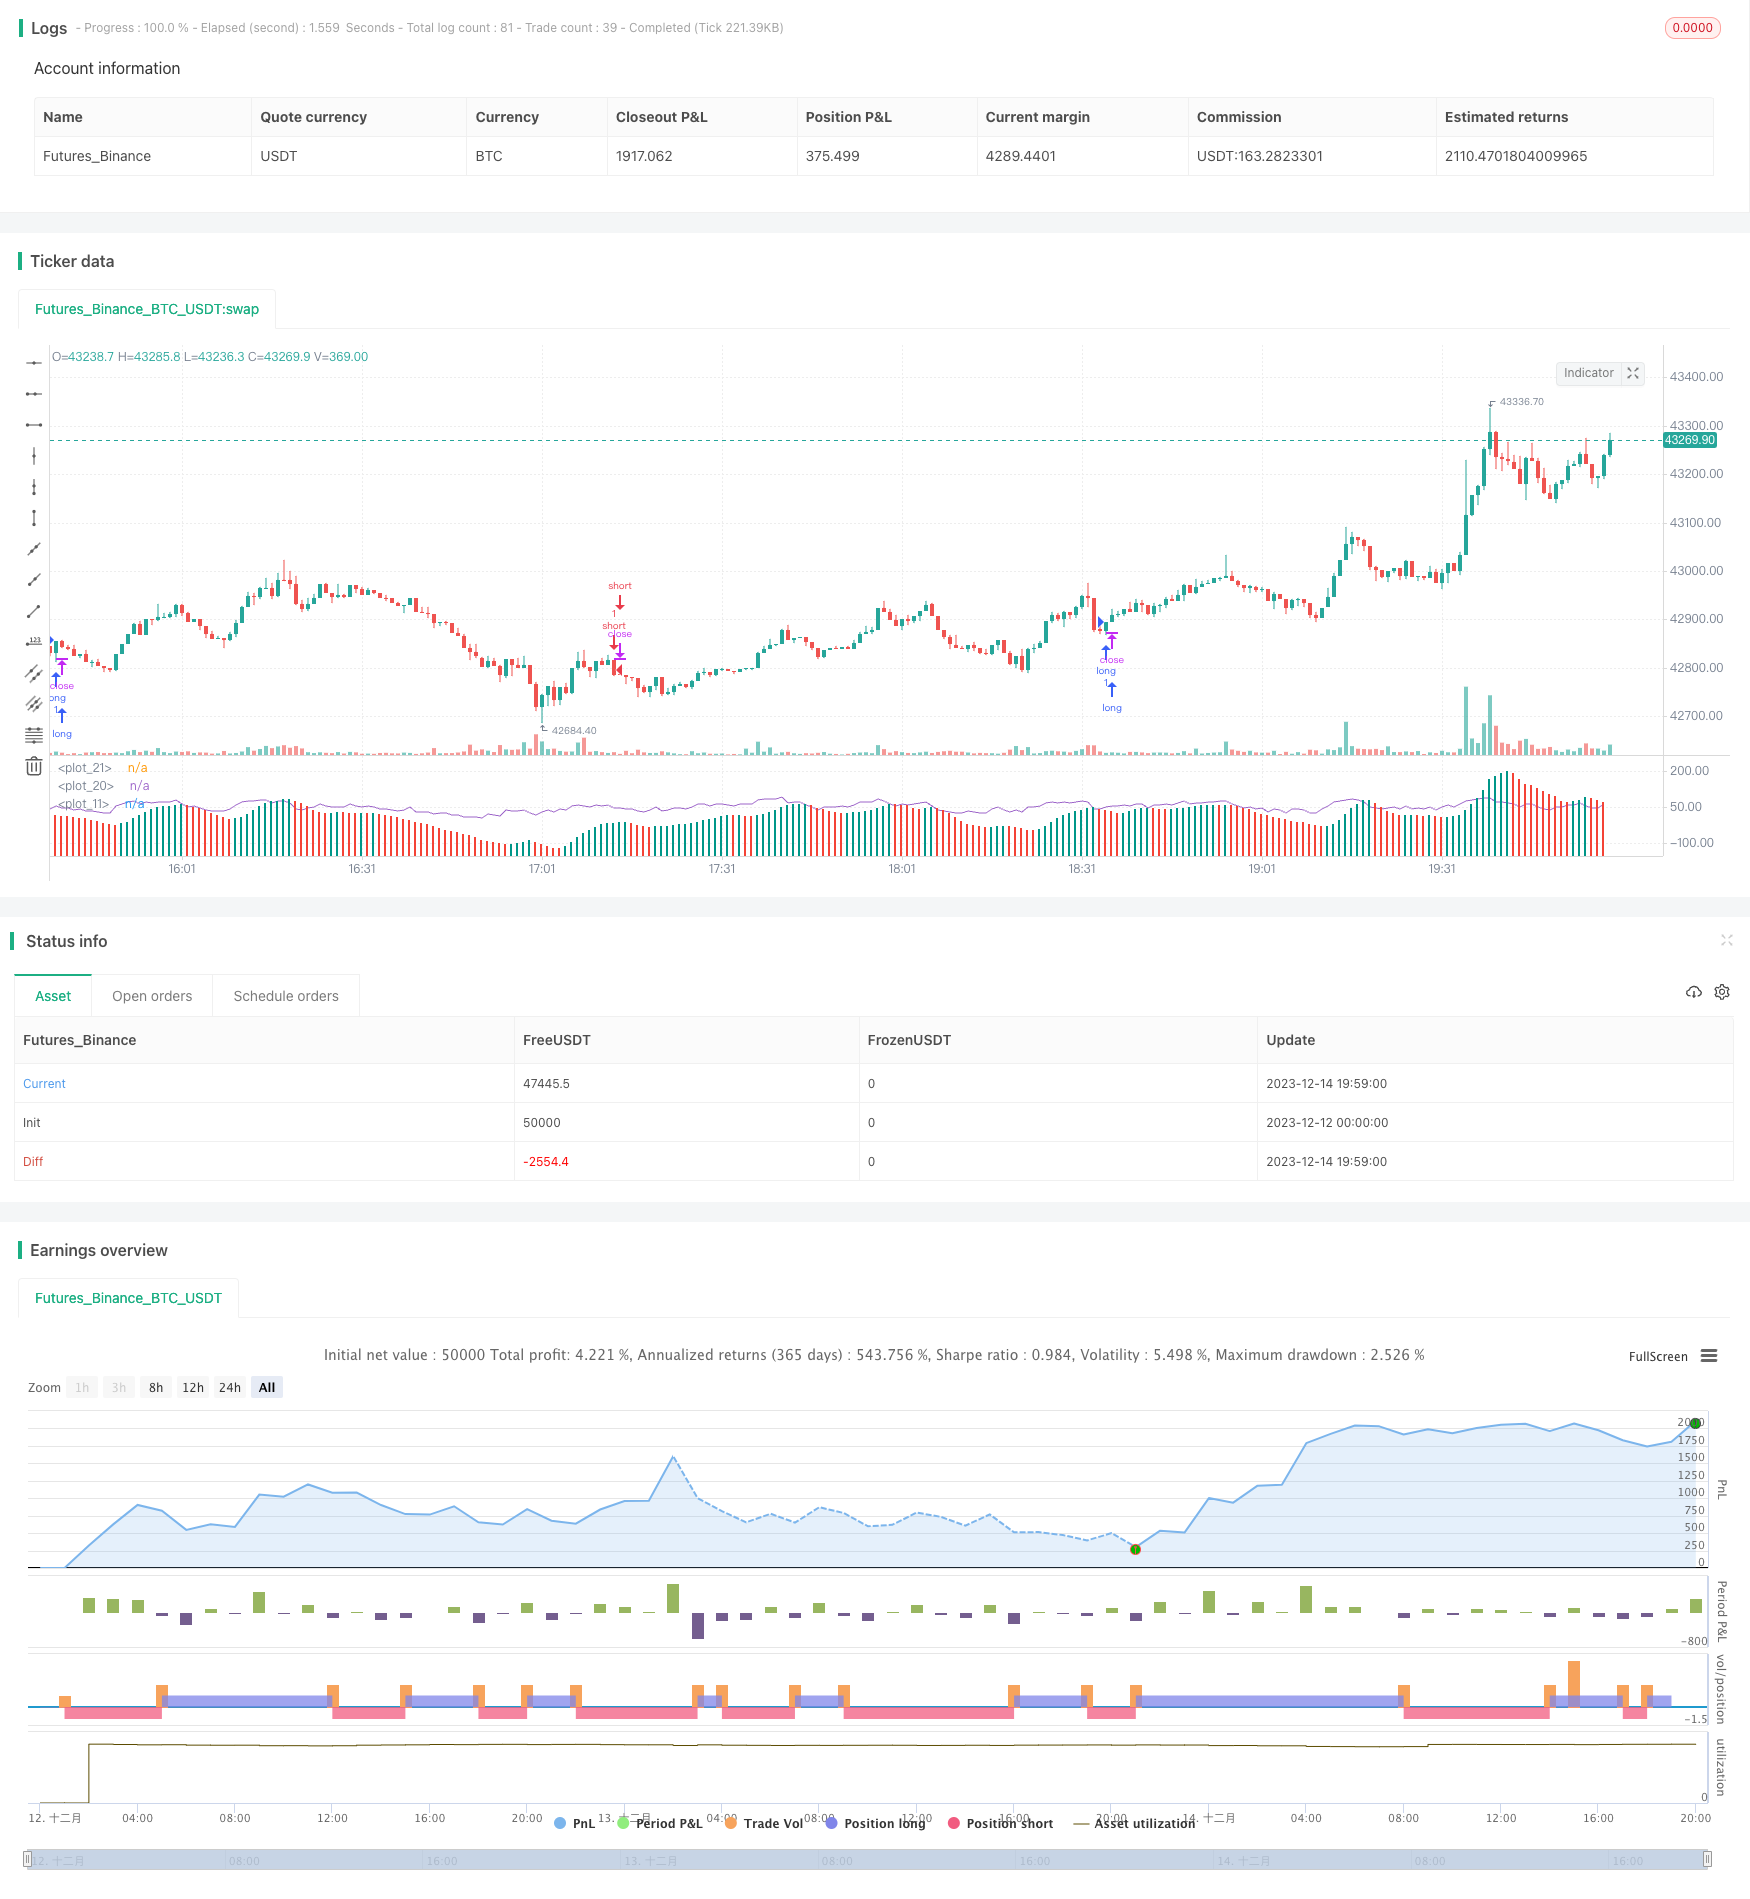
/*backtest
start: 2023-12-12 00:00:00
end: 2023-12-14 20:00:00
period: 1m
basePeriod: 1m
exchanges: [{"eid":"Futures_Binance","currency":"BTC_USDT"}]
*/

// https://www.youtube.com/watch?v=zr3AVwjCtDA

//@version=5
strategy(title="Bingx ESTRATEGIA de Trading en 1 minuto ", shorttitle="AO")
long = input.bool(true, "long")
short = input.bool(true, "short")
profit = (input.float(10, "profit") / 100) + 1
stop = (input.float(5, "stop") / 100) + 1
ao = ta.sma(hl2,5) - ta.sma(hl2,34)
diff = ao - ao[1]
plot(ao, color = diff <= 0 ? #F44336 : #009688, style=plot.style_columns)
changeToGreen = ta.crossover(diff, 0)
changeToRed = ta.crossunder(diff, 0)
alertcondition(changeToGreen, title = "AO color changed to green", message = "Awesome Oscillator's color has changed to green")
alertcondition(changeToRed, title = "AO color changed to red", message = "Awesome Oscillator's color has changed to red")

ema20 = ta.ema(close, 20)
ema200 = ta.ema(close, 200)
rsi = ta.rsi(close, 7)
plot(rsi)
plot(0, color=color.white)
var float pentry = 0.0
var float lentry = 0.0
var bool oab = false
// oab := ta.crossover(ao, 0) ? true : ta.crossover(0, ao) ? false : oab[1]

if long and close > open and ta.crossover(close, ema20) and ema20 > ema200 and ao > 0 and rsi > 50
    strategy.entry("long", strategy.long)
    pentry := close
strategy.exit("exit long", "long", limit=pentry * profit, stop=pentry / stop)

if short and close < open and ta.crossunder(close, ema20) and ema20 < ema200 and ao < 0 and rsi < 50
    strategy.entry("short", strategy.short)
    lentry := close
strategy.exit("exit short", "short", limit=lentry / profit, stop=lentry * stop)
Detail
https://www.fmz.com/strategy/435945
Last Modified
2023-12-20 11:59:48