Name
基于CMO和WMA的双均线交易策略CMO-and-WMA-Based-Dual-Moving-Average-Trading-Strategy
Author
ChaoZhang
Strategy Description
该策略是一个基于价格动量指标Chandre动量震荡器(CMO)以及其加权移动平均线(WMA)的双均线交易策略。它Attempts to identify trend reversals and continuation Using CMO crossover 其WMA。
该策略首先计算CMO,该指标度量价格的网上动量变化。正值表示上涨势头,负值表示下跌势头。 然后计算CMO的WMA。 当CMO上穿其WMA时,采取看涨立场;当CMO下穿其WMA时,采取看跌立场。 该策略Attempts to capture turning points in the trend Using CMO和WMA的交叉。
计算CMO的关键步骤是:
- 计算每日价格变化(xMom)
- 对价格变化求n日SMA,作为“真实的”价格动量(xSMA_mom)
- 计算n日net price change (xMomLength)
- 将net price change标准化(nRes),方法是除以SMA
- 对标准化net price change求m日WMA,得到CMO(xWMACMO)
该策略的优点是捕捉价格中期趋势的转折点。CMO的绝对值大小反映价格运行趋势的力度,WMA有利于滤波假突破。
该策略最大的优势是利用CMO指标的绝对值判断市场群众情绪,WMA滤波来识别中期趋势的转折点。相比单一移动平均线策略,更能捕捉弹性空间较大的中期趋势。
CMO标准化了价格变化,将其映射到-100到100区间,便于判断市场群众情绪;绝对值大小代表当前趋势的力度。WMA对CMO进行额外滤波,避免出现过多假信号。
该策略可能存在的主要风险有:
- CMO和WMA参数设置不当,导致产生过多假信号
- 无法有效应对趋势震荡市,将产生过高的交易频率和滑点成本
- 无法识别真正的长期趋势,在长期持仓中可能存在亏损风险
对应优化方法有:
- 调整CMO和WMA的参数,找到最优参数组合
- 增加附加过滤条件,例如交易量能量指标,避免在震荡行情中交易
- 结合更长周期的指标,例如90日线,避免在长线趋势中的错失机会
该策略的优化方向主要集中在参数优化,信号过滤以及止损方面:
-
CMO和WMA的参数优化:通过遍历找到最优参数组合
-
结合交易量,强弱指标等辅助指标进行信号过滤,避免假突破
-
增加动态止损机制,当价格重新跌破CMO和WMA时止损出场
-
可以考虑Breakout Failure模式作为入场信号,即CMO和WMA先突破关键位,但很快重新跌破的情况
-
可以结合更长线周期指标判断大趋势,避免逆势交易
该策略整体采用CMO指标判断趋势力度和转折点,结合WMA进行滤波生成交易信号,属于典型的双均线系统。相比单一MA策略,具有更强的捕捉弹性中期趋势的优势。但参数设置和滤波方面还有优化空间,适当控制交易频率和引入动态止损,能够进一步提高系统稳定性。
||
This strategy is a dual moving average trading strategy based on the price momentum indicator Chandre Momentum Oscillator (CMO) and its Weighted Moving Average (WMA). It attempts to identify trend reversals and continuation using CMO crossover its WMA.
The strategy first calculates CMO, which measures the net change in price momentum. Positive values indicate upside momentum while negative values indicate downside momentum. It then calculates the WMA of CMO. When CMO crosses above its WMA, a long position is taken; when CMO crosses below its WMA, a short position is taken. The strategy attempts to capture turning points in the trend using CMO and WMA crossovers.
The key steps in calculating CMO are:
- Calculate the daily price change (xMom)
- Take n-day SMA of price change as the "true" price momentum (xSMA_mom)
- Calculate n-day net price change (xMomLength)
- Standardize the net price change (nRes) by dividing by the SMA
- Take m-day WMA of the standardized net price change to get CMO (xWMACMO)
The advantage of this strategy is capturing medium-term trend reversals in price. The absolute magnitude of CMO reflects the strength of the price run, while the WMA helps filter out false breakouts.
The biggest advantage of this strategy is using the absolute value of CMO to gauge market crowd sentiment and using the WMA filter to identify turning points in the medium-term trend. Compared to single moving average strategies, it is better able to capture medium-term trends with higher elasticity.
CMO standardizes price changes and maps them into a -100 to 100 range for easier judgment of market crowd sentiment; absolute magnitude represents strength of current trend. The WMA provides additional filtering on CMO to avoid excessive false signals.
The main risks that may exist in this strategy are:
- Improper CMO and WMA parameter settings leading to excessive false signals
- Inability to effectively handle trending oscillations, resulting in high trading frequency and slippage costs
- Failure to identify true long term trends, leading to losses in long term positions
Corresponding optimization methods:
- Adjust CMO and WMA parameters to find optimal combination
- Add supplementary filters like volume energy to avoid trading in oscillating markets
- Incorporate longer term indicators like 90-day MA to avoid missing opportunities in long term trends
The main optimization directions for this strategy are around parameter tuning, signal filtering and stop losses:
- CMO and WMA parameter optimization through brute force testing
- Supplementary signal filtering using volume, strength indicators etc. to avoid false breakouts
- Incorporating dynamic stop losses to exit when price breaks back below CMO and WMA
- Considering Breakout Failure patterns as entry signals when CMO and WMA first break key levels but quickly fall back
- Judging the major trend using longer term indicators to avoid counter-trend trading
Overall this strategy uses CMO to judge trend strength and turning points, combined with the WMA filter to generate trading signals, a typical dual moving average system. Compared to single MA strategies, it has a stronger advantage in capturing elastic medium-term trends. But there is still room for optimization around parameters, filtering and stop losses. Controlling trade frequency and incorporating dynamic stops can further improve system stability.
[/trans]
Strategy Arguments
| Argument | Default | Description |
|---|---|---|
| v_input_1 | 9 | Length |
| v_input_2 | 9 | LengthWMA |
| v_input_3 | 60 | BuyZone |
| v_input_4 | -60 | SellZone |
| v_input_5 | false | Trade reverse |
Source (PineScript)
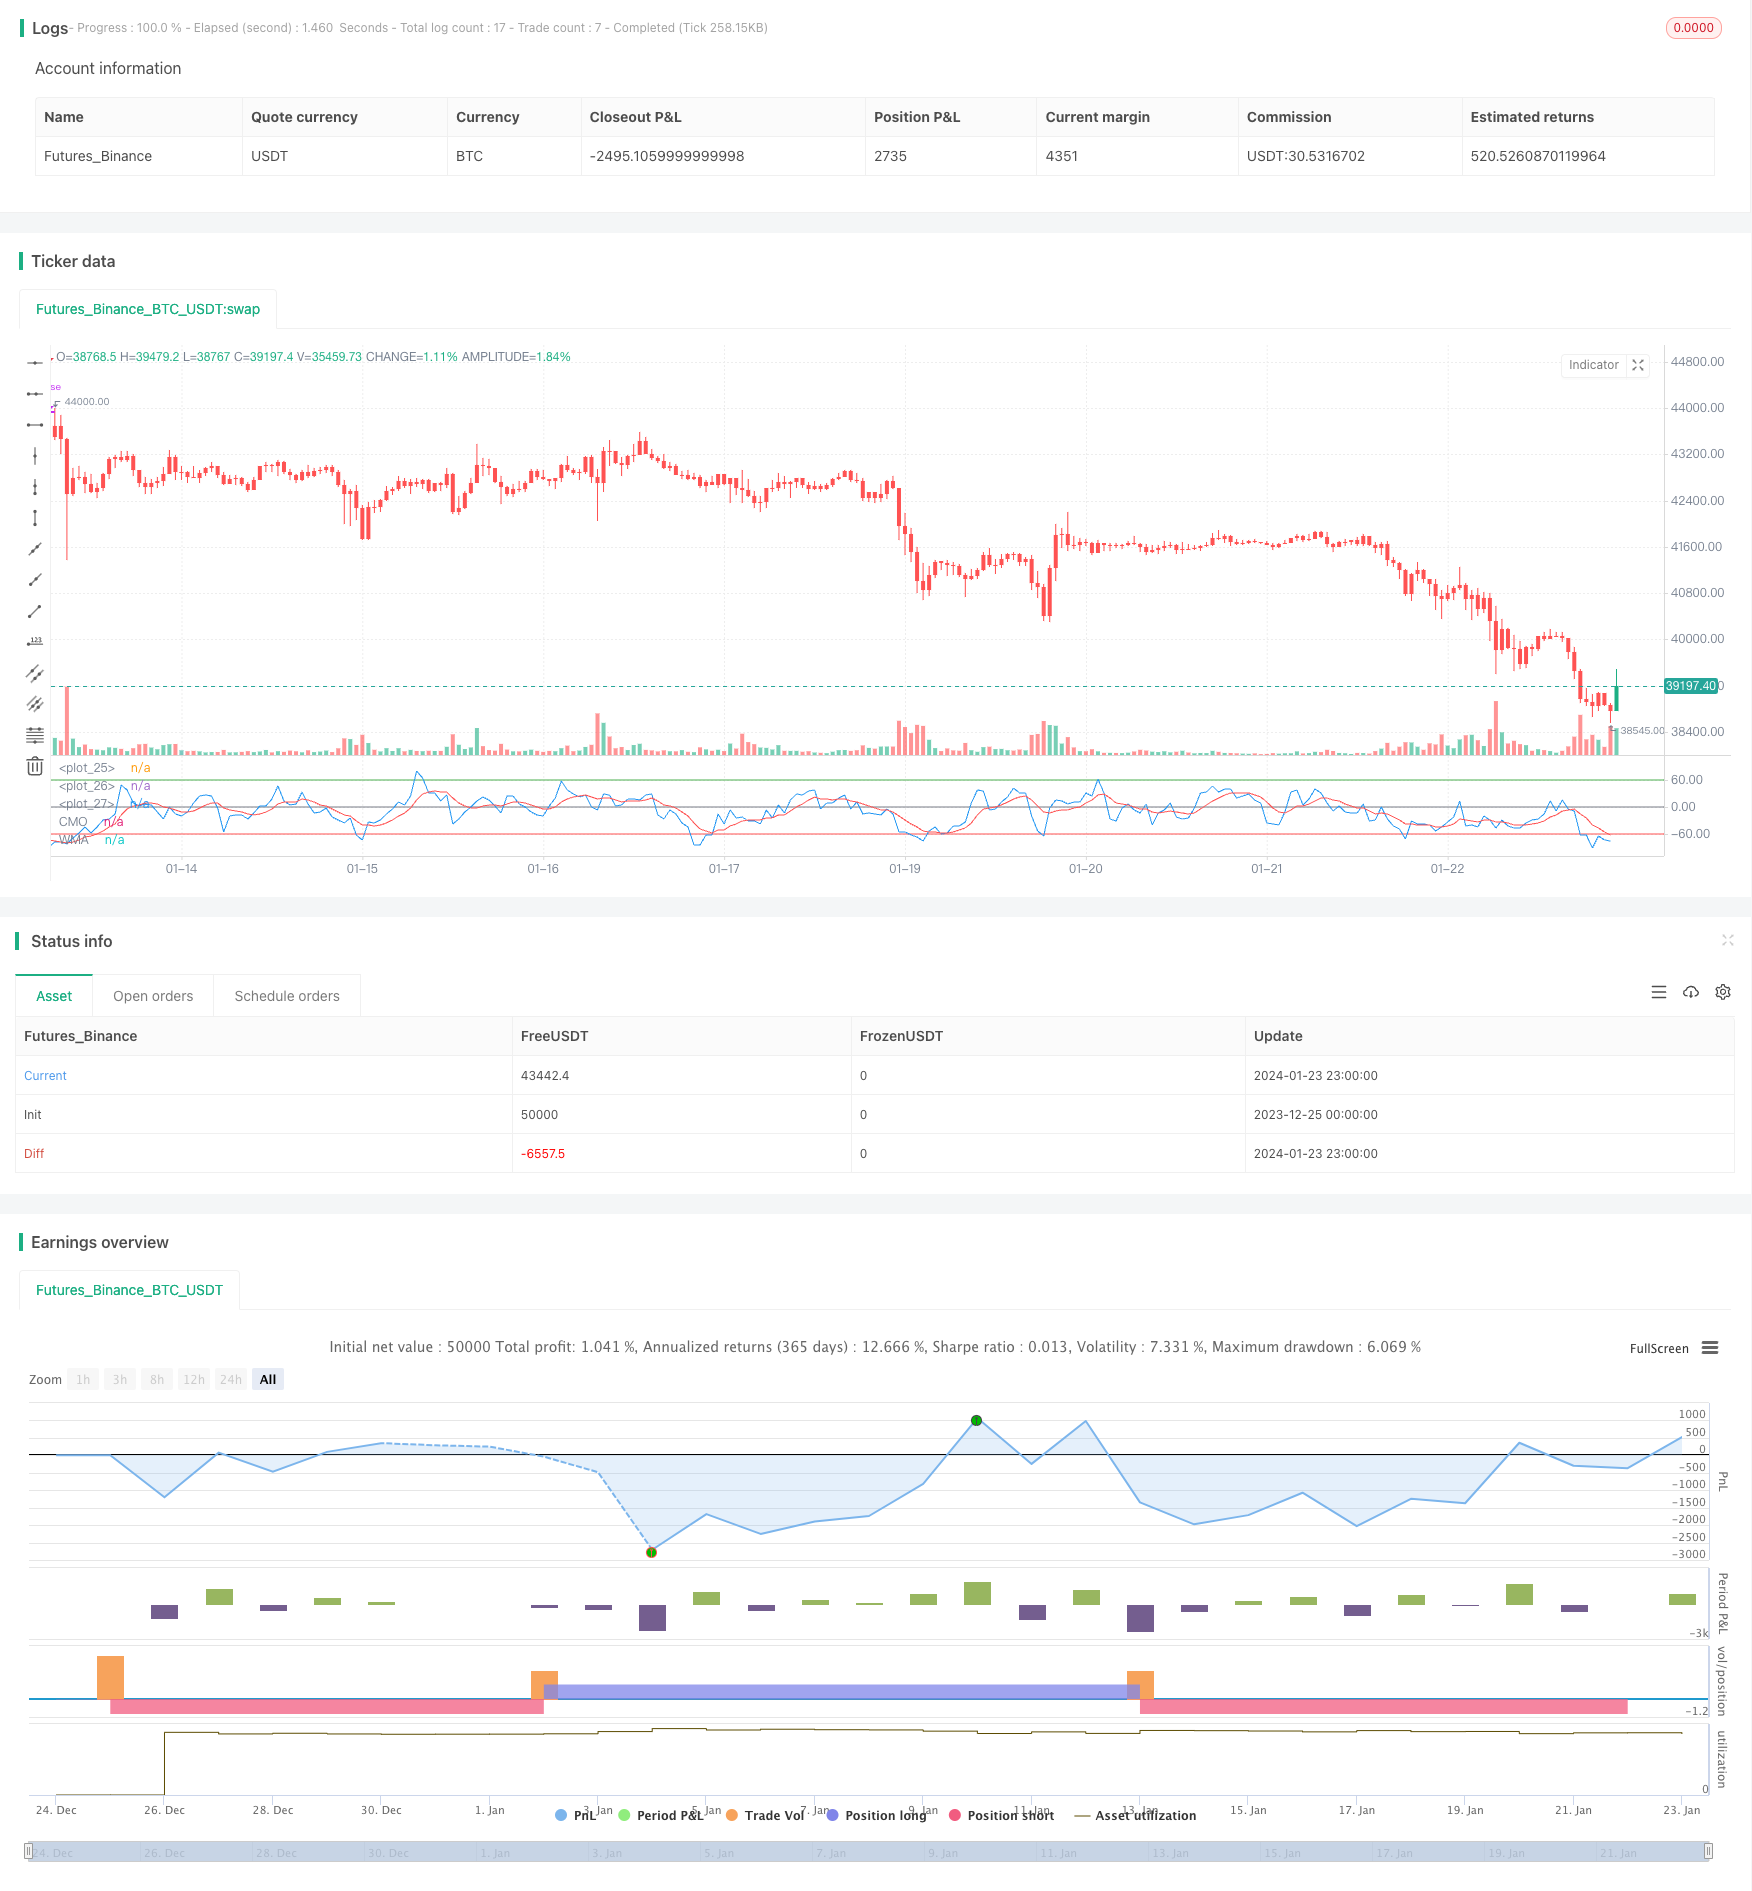
/*backtest
start: 2023-12-25 00:00:00
end: 2024-01-24 00:00:00
period: 1h
basePeriod: 15m
exchanges: [{"eid":"Futures_Binance","currency":"BTC_USDT"}]
*/

//@version=3
////////////////////////////////////////////////////////////
//  Copyright by HPotter v1.0 18/10/2018
//    This indicator plots Chandre Momentum Oscillator and its WMA on the
//    same chart. This indicator plots the absolute value of CMO.
//    The CMO is closely related to, yet unique from, other momentum oriented
//    indicators such as Relative Strength Index, Stochastic, Rate-of-Change,
//    etc. It is most closely related to Welles Wilder?s RSI, yet it differs
//    in several ways:
//    - It uses data for both up days and down days in the numerator, thereby
//        directly measuring momentum;
//    - The calculations are applied on unsmoothed data. Therefore, short-term
//        extreme movements in price are not hidden. Once calculated, smoothing
//        can be applied to the CMO, if desired;
//    - The scale is bounded between +100 and -100, thereby allowing you to clearly
//        see changes in net momentum using the 0 level. The bounded scale also allows
//        you to conveniently compare values across different securities.
////////////////////////////////////////////////////////////
strategy(title="CMO & WMA Backtest ver 2.0", shorttitle="CMO & WMA")
Length = input(9, minval=1)
LengthWMA = input(9, minval=1)
BuyZone = input(60, step = 0.01)
SellZone = input(-60, step = 0.01)
reverse = input(false, title="Trade reverse")
hline(BuyZone, color=green, linestyle=line)
hline(SellZone, color=red, linestyle=line)
hline(0, color=gray, linestyle=line)
xMom = abs(close - close[1])
xSMA_mom = sma(xMom, Length)
xMomLength = close - close[Length]
nRes = 100 * (xMomLength / (xSMA_mom * Length))
xWMACMO = wma(nRes, LengthWMA)
pos = 0.0
pos := iff(xWMACMO > BuyZone, 1,
	   iff(xWMACMO < SellZone, -1, nz(pos[1], 0)))
possig = iff(reverse and pos == 1, -1,
          iff(reverse and pos == -1, 1, pos))
if (possig == 1)
    strategy.entry("Long", strategy.long)
if (possig == -1)
    strategy.entry("Short", strategy.short)
barcolor(possig == -1 ? red: possig == 1 ? green : blue )
plot(nRes, color=blue, title="CMO")
plot(xWMACMO, color=red, title="WMA")
Detail
https://www.fmz.com/strategy/440005
Last Modified
2024-01-25 17:44:49