Name
基于Doji星形态的止损止盈策略Stop-Loss-and-Take-Profit-Strategy-Based-on-Doji-Pattern
Author
ChaoZhang
Strategy Description
本策略基于Doji星形态,当出现Doji星形态时,在Doji星高点和前一根K线高点之间放置买入停止单,在Doji星低点和前一根K线低点之间放置卖出停止单。当价格触发停止单后,可选择以固定止损止盈出场,或以Doji星形态的最高价和最低价作为止损止盈出场。该策略适合在高时间框架如日线和周线运行,可有效过滤噪音。
当出现Doji星形态时,说明当前的供求关系发生变化,买卖双方力量趋于平衡,价格可能出现反转。该策略正是利用Doji星形态预示的价格反转信号,通过放置停止单捕捉反转机会。具体来说,判断Doji星形态的条件是:
body=close-open
range=high-low
abody=abs(body)
ratio=abody/range
data=(abs(open - close) <= (high - low) * Doji)
如果abs(open-close) <= (high-low)*Doji参数,则判定为Doji星形态,此时放置停止单。停止单的位置如下:
longDist= longcandle[1] and range[1]>range? high: max(high,high[1])
shortDist= longcandle[1] and range[1]>range? low: min(low,low[1])
如果前一根K线实体较大,则买入停止单位于Doji星高点和前一根K线高点之间。如果前一根K线实体较小,则买入停止单为Doji星高点。卖出停止单同理。
出场规则有两种可选:
- 以固定止盈止损出场
strategy.exit("exit buy","buy stop",loss=SL, profit=TP, when=Use_SL_TP)
- 以Doji星最高价最低价作为止盈止损出场
strategy.close("buy stop",when=not Use_SL_TP and close<dojilow)
该策略具有以下优势:
- 操作简单,容易实施。
- 利用Doji星高效的价格反转信号,捕捉反转机会。
- 可配置止损止盈参数,控制风险。
- 适合高时间框架运行,可过滤噪音。
该策略也存在一定的风险:
- Doji星形态不一定会带来价格反转,可能出现止损。解决方法是合理设置止损距离,控制单笔损失。
- 在低时间框架上运行时,Doji信号可能存在过多噪音。解决方法是只在高时间框架如日线周线运行。
- 如果不设置止损止盈,存在无限亏损的风险。解决方法是正确使用止损止盈功能。
该策略可以从以下几个方向进行优化:
- 优化Doji参数,找到不同交易品种最佳参数组合。
- 测试不同的止损止盈参数,找到最佳参数组合。
- 基于ATR动态计算止损距离。
- 结合其他指标确定最佳入场时机。
该策略整体运行效果良好,通过捕捉Doji价格反转机会,可以获得不错的交易信号。同时策略操作简单,容易实施,适合多种交易品种,是一款实用的量化交易策略。通过持续测试和优化,可望获得更好的策略效果。
||
This strategy is based on the Doji pattern. When a Doji pattern appears, a buy stop order is placed between the high of the Doji and the high of the previous candle, and a sell stop order is placed between the low of the Doji and the low of the previous candle. When the price triggers the stop orders, you can choose to exit with fixed stop loss and take profit, or use the highest and lowest price of the Doji pattern as stop loss and take profit. This strategy works well on higher timeframes like daily and weekly to filter out noise.
When a Doji pattern appears, it indicates a change in the supply and demand relationship, with forces becoming more balanced, which may lead to a price reversal. This strategy takes advantage of the price reversal signal indicated by Doji to capture opportunities through stop orders. Specifically, the criteria for determining a Doji pattern is:
body=close-open
range=high-low
abody=abs(body)
ratio=abody/range
data=(abs(open - close) <= (high - low) * Doji)
If abs(open-close) <= (high-low)*Doji parameter, it is considered a Doji pattern, and stop orders will be placed. The position of the stop orders is:
longDist= longcandle[1] and range[1]>range? high: max(high,high[1])
shortDist= longcandle[1] and range[1]>range? low: min(low,low[1])
If the body of the previous candle is large, the buy stop order is placed between the high of the Doji and the high of the previous candle. If the previous candle has a small body, the buy stop order is placed at the high of the Doji. The sell stop order follows the same logic.
There are two options for exits:
- Fixed stop loss and take profit
strategy.exit("exit buy","buy stop",loss=SL, profit=TP, when=Use_SL_TP)
- Use highest and lowest price of Doji as stop loss and take profit
strategy.close("buy stop",when=not Use_SL_TP and close<dojilow)
The advantages of this strategy are:
- Simple to implement.
- Takes advantage of efficient price reversal signals from Doji pattern.
- Customizable stop loss and take profit parameters to control risk.
- Works well on higher timeframes to filter out noise.
There are some risks with this strategy:
- Doji pattern does not always lead to price reversal, may face stop loss. Solution is to reasonably set stop loss distance to limit loss per trade.
- Too much noise in Doji signals on lower timeframes. Should only run on higher timeframes like daily and weekly.
- Risk of unlimited losses without stop loss and take profit. Must use them properly.
Some ways to optimize the strategy:
- Optimize Doji parameter for different trading instruments.
- Test different combinations of stop loss and take profit.
- Dynamic stop loss based on ATR.
- Combine with other indicators to determine optimal entry.
The overall performance of this strategy is good. By capturing Doji price reversal opportunities, it can generate decent trading signals. Also simple to implement and applicable across multiple instruments. With continuous testing and optimizations, better results can be expected.
[/trans]
Strategy Arguments
| Argument | Default | Description |
|---|---|---|
| v_input_1 | true | Use stop loss and take profit? |
| v_input_2 | 200 | Take Profit in ticks |
| v_input_3 | 200 | Stop Loss in tiks |
| v_input_4 | 0.05 | Doji size |
Source (PineScript)
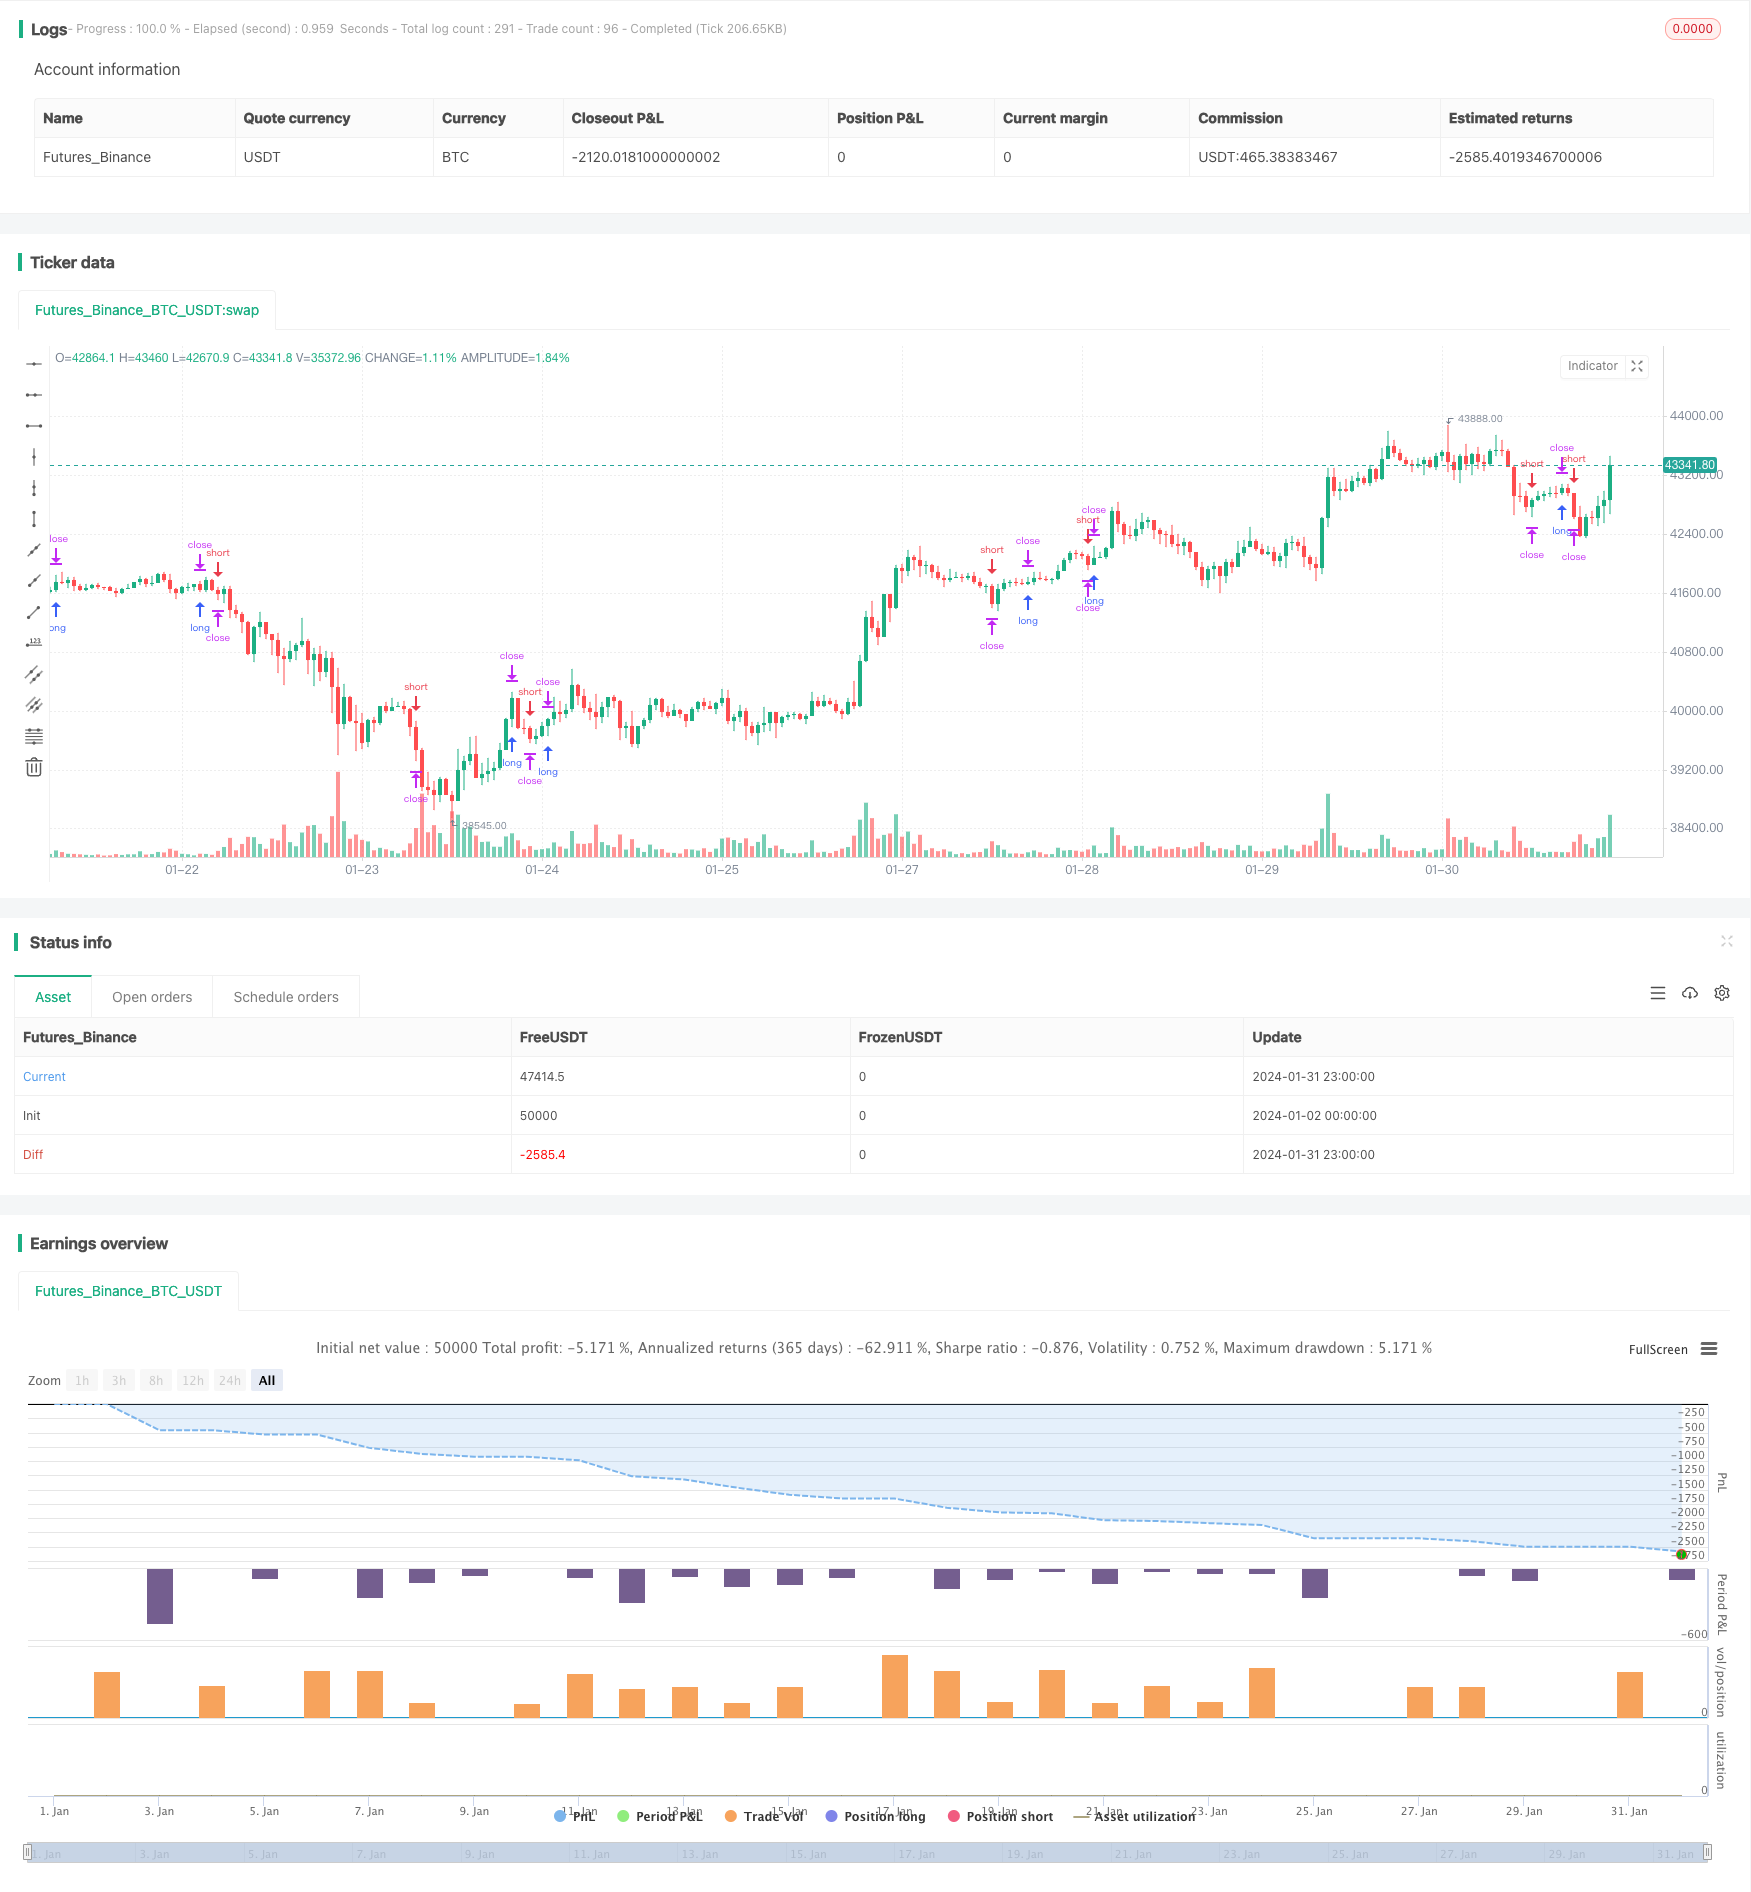
/*backtest
start: 2024-01-02 00:00:00
end: 2024-02-01 00:00:00
period: 1h
basePeriod: 15m
exchanges: [{"eid":"Futures_Binance","currency":"BTC_USDT"}]
*/

//@version=3
//This is a simple strategy based on Doji star candlestick
//It places two orders: buy stop at doji star high or previous candle high and sell stop at doji star low or previous candle low.
//This strategy works very well with high time frames like Weekly TF because it eliminates the noise in doji formation.
//

strategy("Doji strategy W", overlay=true, calc_on_every_tick=true, pyramiding=0,default_qty_type=strategy.percent_of_equity,default_qty_value=100,currency=currency.USD)

//INPUTS
//MinDistance=input(100,'Minimum distance in ticks')
Use_SL_TP=input(true,'Use stop loss and take profit?')
TP=input(200,'Take Profit in ticks')
SL=input(200,'Stop Loss in tiks')
Doji = input(0.05, minval=0.01, title="Doji size", step=0.01)

//VARIABILI
body=close-open
range=high-low
abody=abs(body)
ratio=abody/range
longcandle= (ratio>0.6)

//Doji
data=(abs(open - close) <= (high - low) * Doji)
plotchar(data, title="Doji", text='Doji', color=black)
longDist= longcandle[1] and range[1]>range? high: max(high,high[1])
shortDist= longcandle[1] and range[1]>range? low: min(low,low[1])
dojilow=data==1?low:na
dojihigh=data==1?high:na

goStar=data==1?true:false
//////////////////////////////////////////////////////////////////

//STRATEGY

strategy.order("buy stop",true,stop=longDist,  oca_name="Dojy Entry",when=goStar)
strategy.order("sell stop",false,stop=shortDist, oca_name="Dojy Entry",when=goStar)

strategy.exit("exit buy","buy stop",loss=SL, profit=TP, when=Use_SL_TP)
strategy.exit("exit sell","sell stop",loss=SL,profit=TP, when=Use_SL_TP)

strategy.close("buy stop",when=not Use_SL_TP and close<dojilow)
strategy.exit("exit buy","buy stop",profit=TP, when=not Use_SL_TP)
strategy.close("sell stop",when=not Use_SL_TP and close>dojihigh)
strategy.exit("exit sell","sell stop",profit=TP, when=not Use_SL_TP)
Detail
https://www.fmz.com/strategy/440857
Last Modified
2024-02-02 17:17:38