Name
基于EMA交叉的趋势转向交易策略Trend-Reversal-Trading-Strategy-Based-on-EMA-Crossover
Author
ChaoZhang
Strategy Description
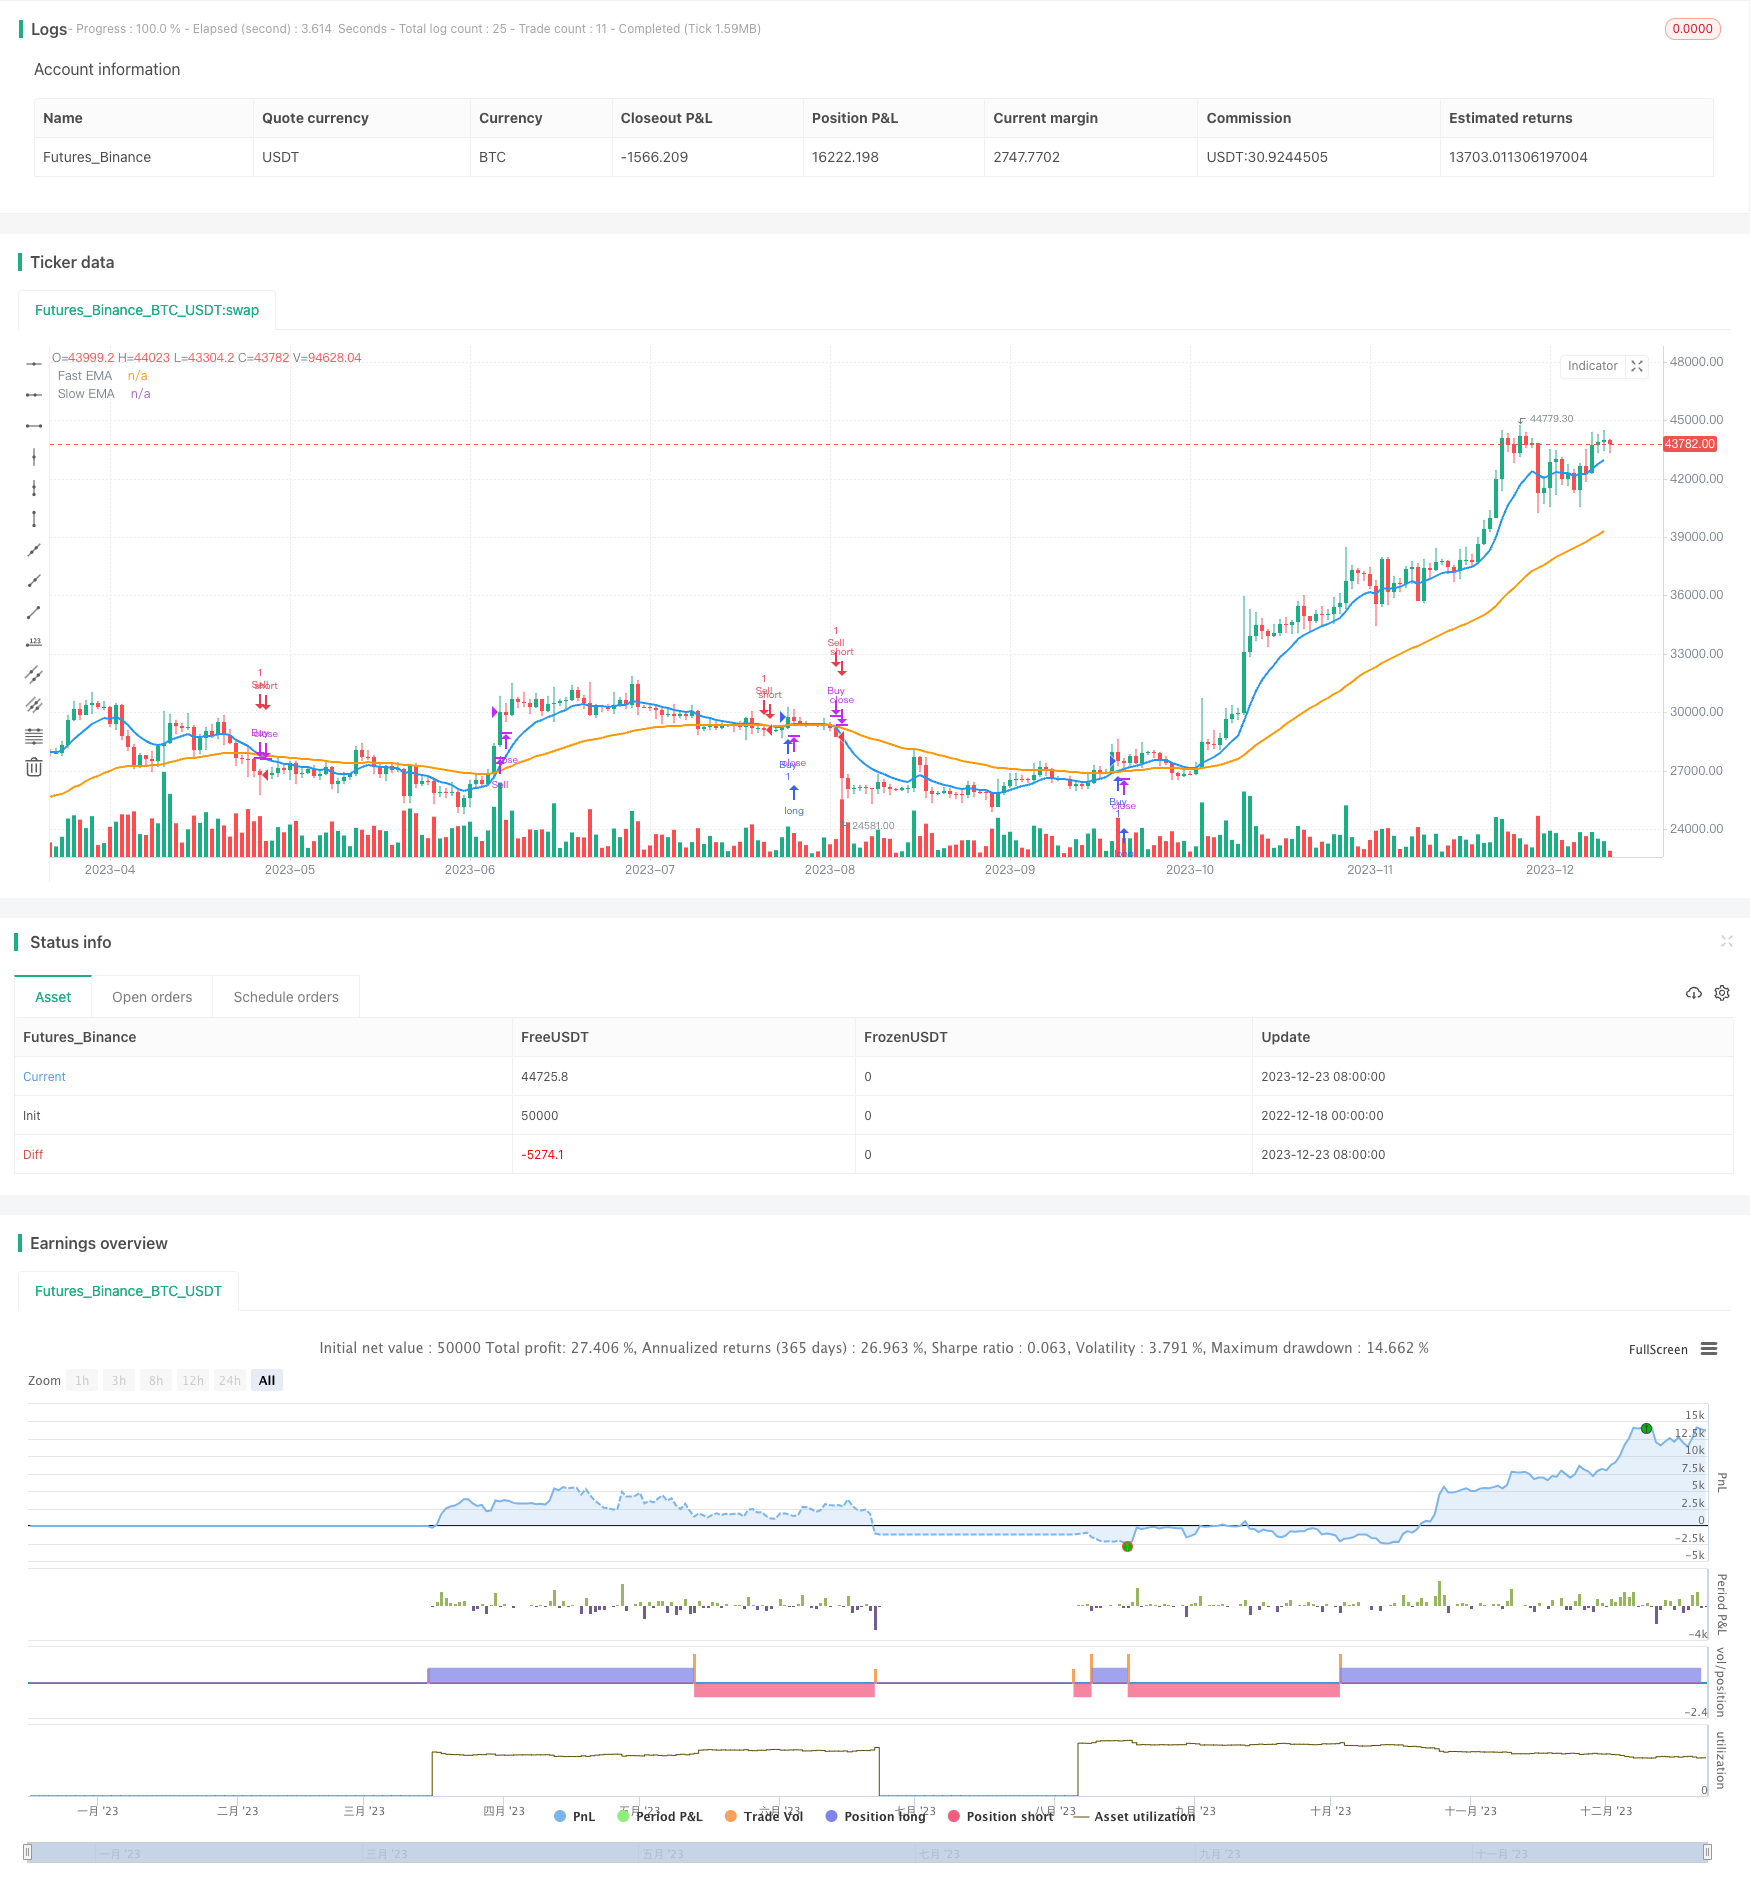
该策略通过计算快速EMA周期和慢速EMA周期的指数移动平均线,并绘制在图表上,实时监控其交叉情况,判断价格趋势的转向。结合RSI超买超卖指标避免虚假信号,形成交易信号。当快速EMA向上突破慢速EMA时产生买入信号;当快速EMA向下跌破慢速EMA时产生卖出信号。
- 计算快速EMA周期和慢速EMA周期的指数移动平均线
- 绘制在图表上,实时监控交叉情况
- 快速EMA向上突破慢速EMA时判断为上升趋势,形成买入信号
- 快速EMA向下跌破慢速EMA时判断为下降趋势,形成卖出信号
- 结合RSI指标避免虚假信号
- 设置趋势过滤条件,只在趋势变化时交易
- 使用EMA判断趋势转向,对小范围波动不敏感
- RSI指标过滤可避免反转虚假信号
- 可自定义EMA周期和RSI参数,适应不同市场
- 代码直观简洁,容易理解实现
- EMA具有滞后性,可能错过转折点
- 大幅震荡市场中EMA判断失效
- 需要适当调整EMA参数和RSI参数
- 可结合其他指标验证信号
- 结合其他指标验证信号确定度
- 增加止损策略控制风险
- 测试不同周期参数的稳定性
- 增加货币强度指标避免货币风险
- 考虑交易成本优化获利比
该策略整体思路清晰,使用EMA判断趋势转向,结合RSI指标过滤信号,可以有效捕捉中长线趋势。但EMA和RSI参数的调整及止损策略仍需优化,且面临错过反转点和震荡市的风险。如果参数优化和风险控制到位,该策略可以用于发现中长线趋势转折点,制定投资决策。
||
This strategy calculates the exponential moving average (EMA) of fast and slow periods, plots them on the chart, and monitors crossovers in real-time to determine trend reversals. Trading signals are formed by incorporating the RSI oscillator to avoid false signals. A buy signal is generated when the fast EMA crosses above the slow EMA. A sell signal is generated when the fast EMA crosses below the slow EMA.
- Calculate EMAs of fast and slow periods
- Plot on chart and monitor crossovers in real-time
- Fast EMA crossing above slow EMA indicates uptrend, buy signal
- Fast EMA crossing below slow EMA indicates downtrend, sell signal
- Incorporate RSI to avoid false signals
- Trend filter to trade only on trend change
- EMAs smooth price action, less sensitive to minor fluctuations
- RSI filters out false reversal signals
- Customizable EMA and RSI parameters for different markets
- Simple and intuitive code, easy to understand
- EMAs have lag, may miss turning points
- Fail in ranging, volatile markets
- Need to adjust EMA and RSI parameters
- Should combine other indicators
- Add filters to increase signal reliability
- Implement stop loss to control risk
- Test stability across periods
- Incorporate currency strength meter
- Optimize risk-reward ratio
The strategy has a clear logic using EMA crossovers to determine trend reversal, filtered by RSI to capture mid- to long-term trends. However, optimization of EMA/RSI parameters and stop loss, as well as the risk of missing reversals and failure in volatile markets remain. With tuned parameters and risk controls, it could serve to identify turning points and formulate investment decisions.
[/trans]
Strategy Arguments
| Argument | Default | Description |
|---|---|---|
| v_input_1 | 10 | Fast EMA Period |
| v_input_2 | 50 | Slow EMA Period |
| v_input_3 | 14 | RSI Length |
| v_input_4 | 70 | Overbought Level |
| v_input_5 | 30 | Oversold Level |
Source (PineScript)
/*backtest
start: 2022-12-18 00:00:00
end: 2023-12-24 00:00:00
period: 1d
basePeriod: 1h
exchanges: [{"eid":"Futures_Binance","currency":"BTC_USDT"}]
*/

//@version=5
strategy("Trend Change with EMA Entry/Exit - Intraday", overlay=true)

// Define the fast and slow EMA periods
fast_ema_period = input(10, title="Fast EMA Period")
slow_ema_period = input(50, title="Slow EMA Period")

// Calculate the EMAs
ema_fast = ta.ema(close, fast_ema_period)
ema_slow = ta.ema(close, slow_ema_period)

// Plot the EMAs on the chart
plot(ema_fast, title="Fast EMA", color=color.blue, linewidth=2)
plot(ema_slow, title="Slow EMA", color=color.orange, linewidth=2)

// Detect trend changes (crossovers and crossunders)
is_uptrend = ta.crossover(ema_fast, ema_slow)
is_downtrend = ta.crossunder(ema_fast, ema_slow)

// Relative Strength Index (RSI)
rsi_length = input(14, title="RSI Length")
overbought_level = input(70, title="Overbought Level")
oversold_level = input(30, title="Oversold Level")
rsi_value = ta.rsi(close, rsi_length)

// Trend Filter
is_trending = ta.change(is_uptrend) != 0 or ta.change(is_downtrend) != 0

// Entry and Exit signals
enter_long = is_uptrend and rsi_value < overbought_level and is_trending
exit_long = is_downtrend and is_trending
enter_short = is_downtrend and rsi_value > oversold_level and is_trending
exit_short = is_uptrend and is_trending

strategy.entry("Buy", strategy.long, when=enter_long)
strategy.close("Buy", when=exit_long)
strategy.entry("Sell", strategy.short, when=enter_short)
strategy.close("Sell", when=exit_short)
Detail
https://www.fmz.com/strategy/436527
Last Modified
2023-12-25 15:12:46