Name
基于EMA和ATRRSI过滤器的趋势跟踪策略An-Advanced-EMA-Trend-Following-Strategy-with-Relaxed-RSI-and-ATR-Filters
Author
ChaoZhang
Strategy Description
该策略是基于EMA均线和RSI、ATR指标构建的一个长线趋势跟踪策略。策略利用快慢EMA形成金叉死叉信号,结合长线EMA判断趋势方向,利用RSI和ATR对盘整进行过滤,实现对长线趋势的跟踪。
- 快慢EMA(20日EMA和50日EMA)金叉做多,死叉做空
- 200日EMA判断长线趋势方向,只在趋势方向交易
- RSI低位做多,高位做空
- ATR来判断盘整,过滤假突破
- 使用快慢EMA组合实现对趋势的判断
- 加入长EMA过滤,避免逆势交易
- RSI指标过滤超买超卖区域,避免追高杀跌
- ATR指标判断盘整,过滤震荡盘整的假突破
- 长线看涨期间,存在一定程度的无法跟踪上涨趋势的风险
- EMA指标在盘整时易产生噪音,需要结合ATR指标过滤
- RSI和ATR参数设置需要根据不同品种分别测试优化
- EMA长度的参数可进行优化,找到不同品种更匹配的组合
- RSI和ATR参数也可进行优化,提高对盘整的识别能力
- 可考虑加入移动止损,锁定部分利润,控制风险
该策略整体来说是一个以EMA为核心的长线趋势跟踪策略,同时引入RSI和ATR指标进行辅助,可以较好地识别趋势方向并过滤噪音。通过参数的优化,该策略可以适用于更多品种,在长线看涨环境中可以获得不错的效果。
||
This is an EMA trend following strategy incorporating RSI and ATR filters, aiming to capture long term trends. It utilizes fast and slow EMA crossovers along with a long term EMA trend filter, relaxed RSI oversold/overbought levels, and ATR-based consolidation detection to reduce whipsaws.
- Long when fast EMA (20) crosses above slow EMA (50)
- Short when fast EMA crosses below slow EMA
- Only trade in the direction of long term trend judged by 200 EMA
- Require RSI to be relatively oversold for longs and overbought for shorts
- Use ATR to detect consolidation zones to avoid false breakouts
- EMA crossover system effective for trend following
- Additional long term filter avoids trading counter trend
- Relaxed RSI thresholds reduce missed profitable trends
- ATR filter helps navigate choppy consolidation periods
- Can underperform in strongly trending bull markets
- Whipsaws possible with EMA crossovers during consolidation
- RSI and ATR parameters need individual optimization per instrument
- Optimize EMA lengths for different instruments
- Fine tune RSI and ATR parameters to improve consolidation detection
- Consider adding profit taking via trailing stops
Overall an effective system for long term trend following across various instruments. Optimization of parameters combined with prudent risk management can lead to positive results, especially in persistent bull market environments. The incorporation of auxiliary indicators like RSI and ATR make this an advanced EMA trend system.
[/trans]
Strategy Arguments
| Argument | Default | Description |
|---|---|---|
| v_input_1 | 20 | Short EMA |
| v_input_2 | 50 | Long EMA |
| v_input_3 | 200 | Trend EMA |
| v_input_4 | 14 | RSI Length |
| v_input_5 | 14 | ATR Length |
Source (PineScript)
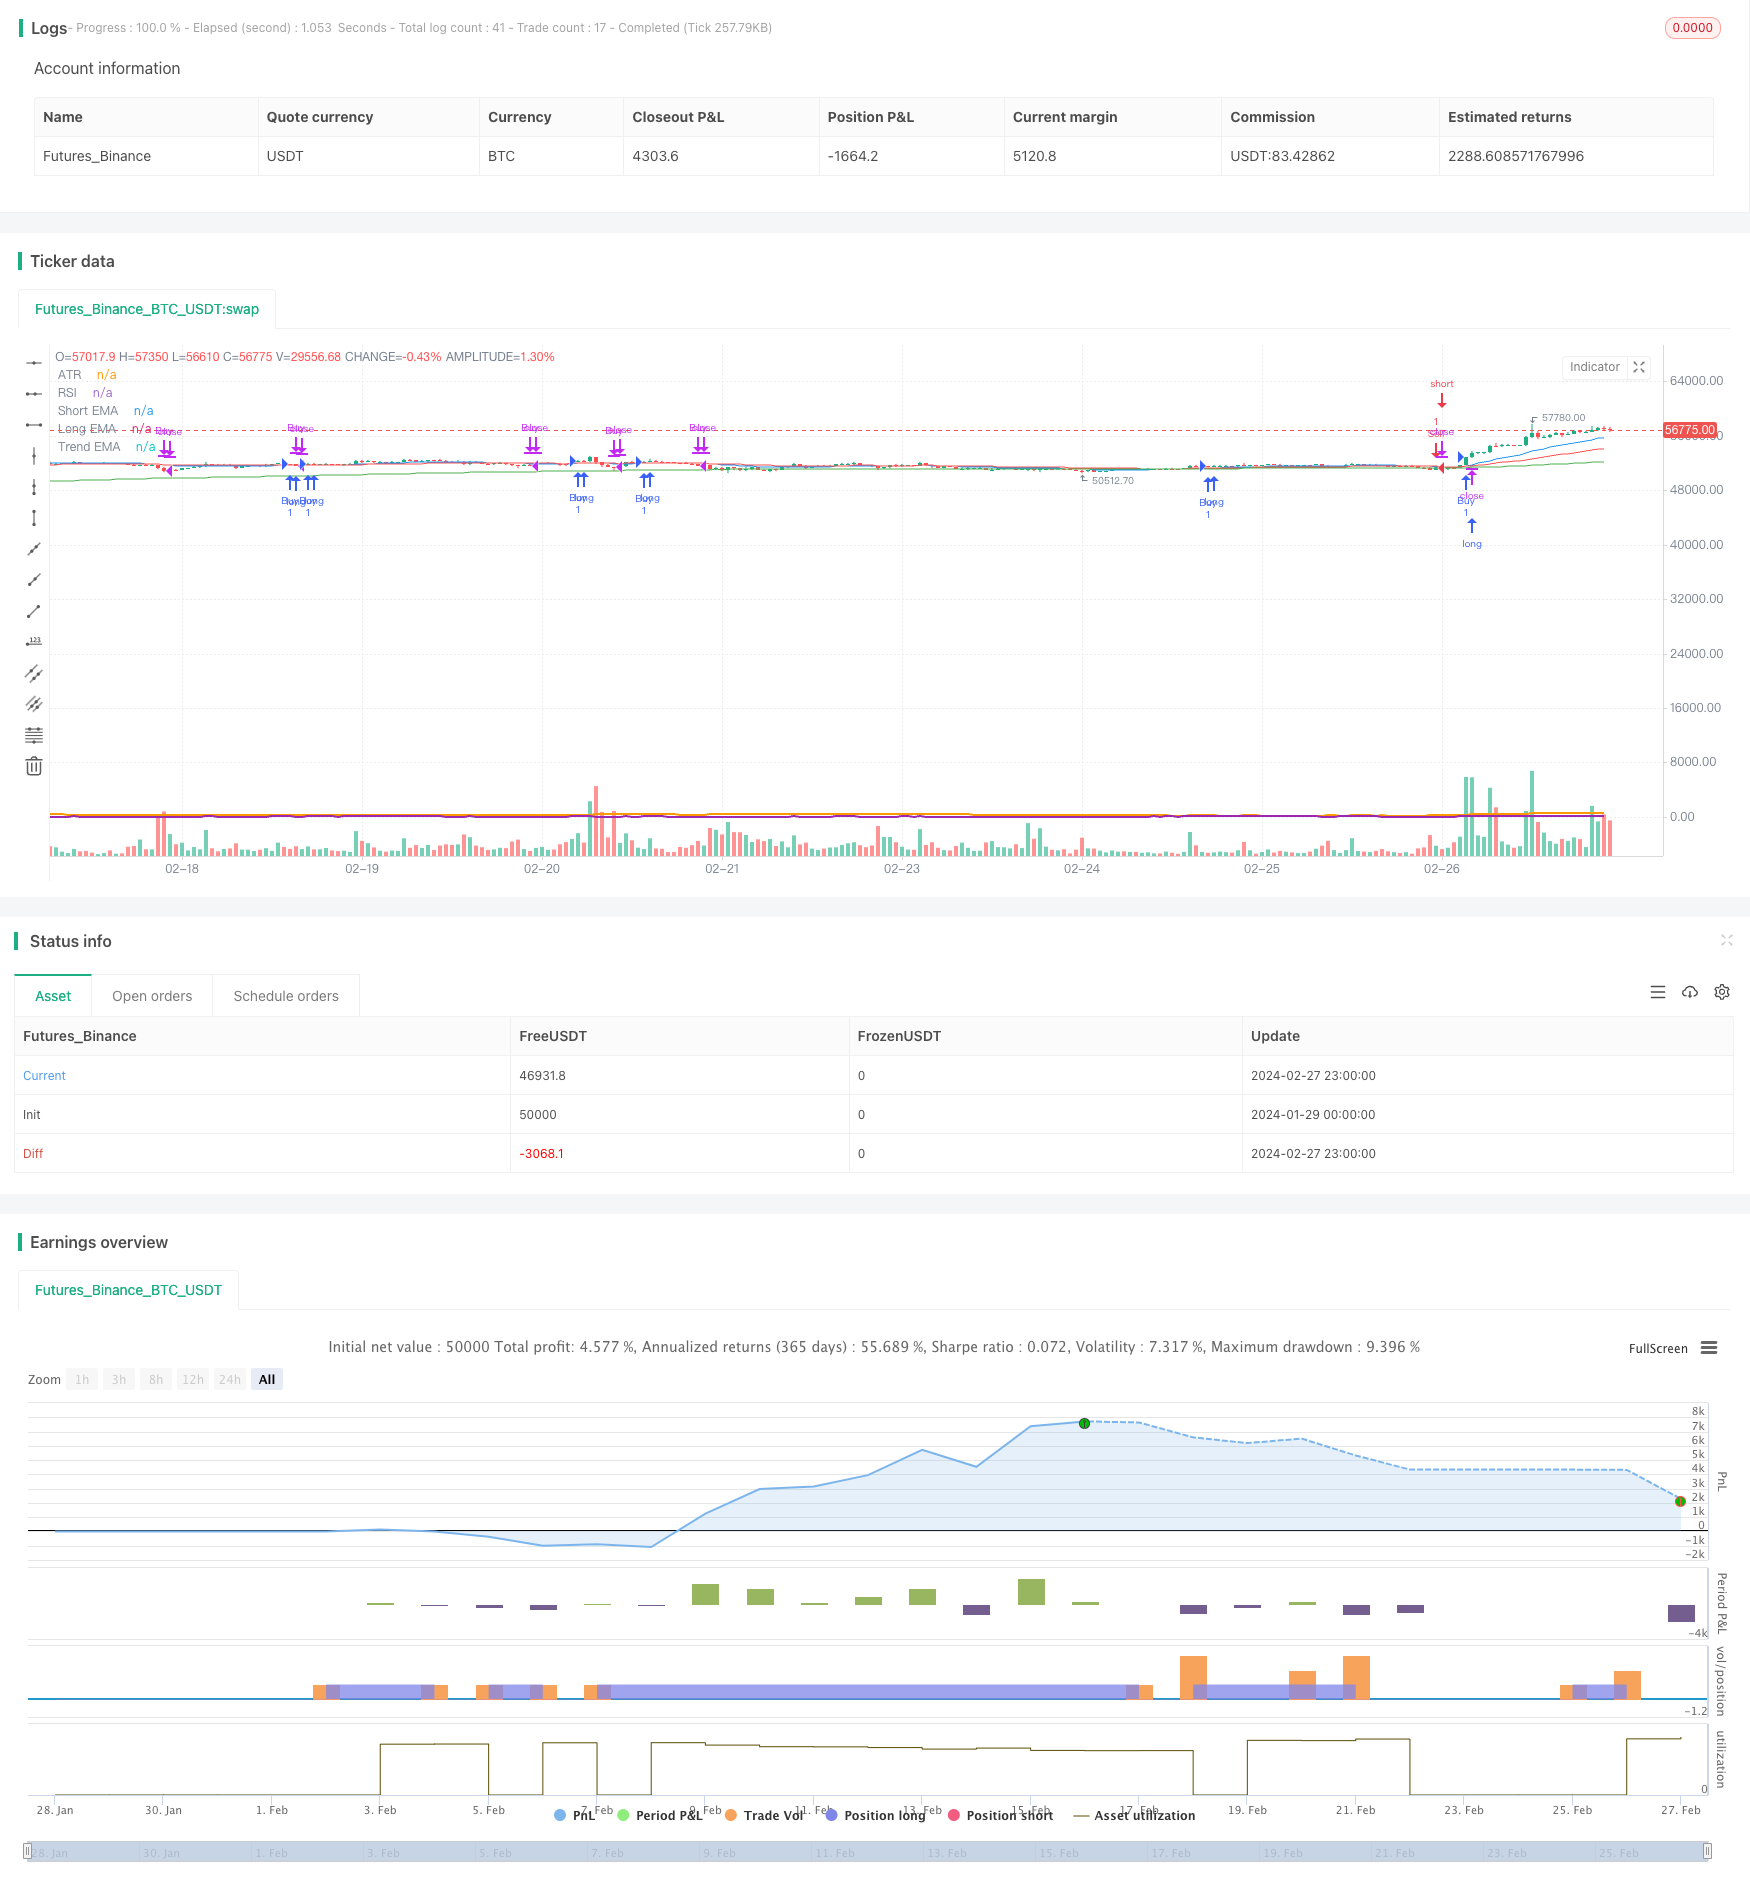
/*backtest
start: 2024-01-29 00:00:00
end: 2024-02-28 00:00:00
period: 1h
basePeriod: 15m
exchanges: [{"eid":"Futures_Binance","currency":"BTC_USDT"}]
*/

//@version=5
strategy("EMA Strategy with Trend Filter", overlay=true)

// Параметры EMA
shortEmaLength = input(20, title="Short EMA")
longEmaLength = input(50, title="Long EMA")
trendEmaLength = input(200, title="Trend EMA")
shortEma = ta.ema(close, shortEmaLength)
longEma = ta.ema(close, longEmaLength)
trendEma = ta.ema(close, trendEmaLength)

// Параметры RSI
rsiLength = input(14, title="RSI Length")
rsi = ta.rsi(close, rsiLength)

// Параметры ATR
atrLength = input(14, title="ATR Length")
atr = ta.atr(atrLength)

// Логика для сигналов покупки и продажи с фильтром по тренду
buySignal = ta.crossover(shortEma, longEma) and close > trendEma
sellSignal = ta.crossunder(shortEma, longEma) and close < trendEma

// Вход в сделки
if (buySignal)
    strategy.entry("Buy", strategy.long)

if (sellSignal)
    strategy.entry("Sell", strategy.short)

// Выход из сделок на основе EMA пересечений
exitBuySignal = ta.crossunder(shortEma, longEma)
exitSellSignal = ta.crossover(shortEma, longEma)

if (exitBuySignal)
    strategy.close("Buy")

if (exitSellSignal)
    strategy.close("Sell")

// Визуализация EMA
plot(shortEma, color=color.blue, title="Short EMA")
plot(longEma, color=color.red, title="Long EMA")
plot(trendEma, color=color.green, title="Trend EMA")

// Отдельная панель для RSI и его визуализация
plot(rsi, title="RSI", color=color.purple, linewidth=2)

// Отдельная панель для ATR и его визуализация
plot(atr, title="ATR", color=color.orange, linewidth=2)
Detail
https://www.fmz.com/strategy/443135
Last Modified
2024-02-29 14:44:10