Name
基于EMA和MACD的多时间框架趋势跟踪策略Trend-Following-Strategy-Based-on-EMA-and-MACD-across-Timeframes
Author
ChaoZhang
Strategy Description
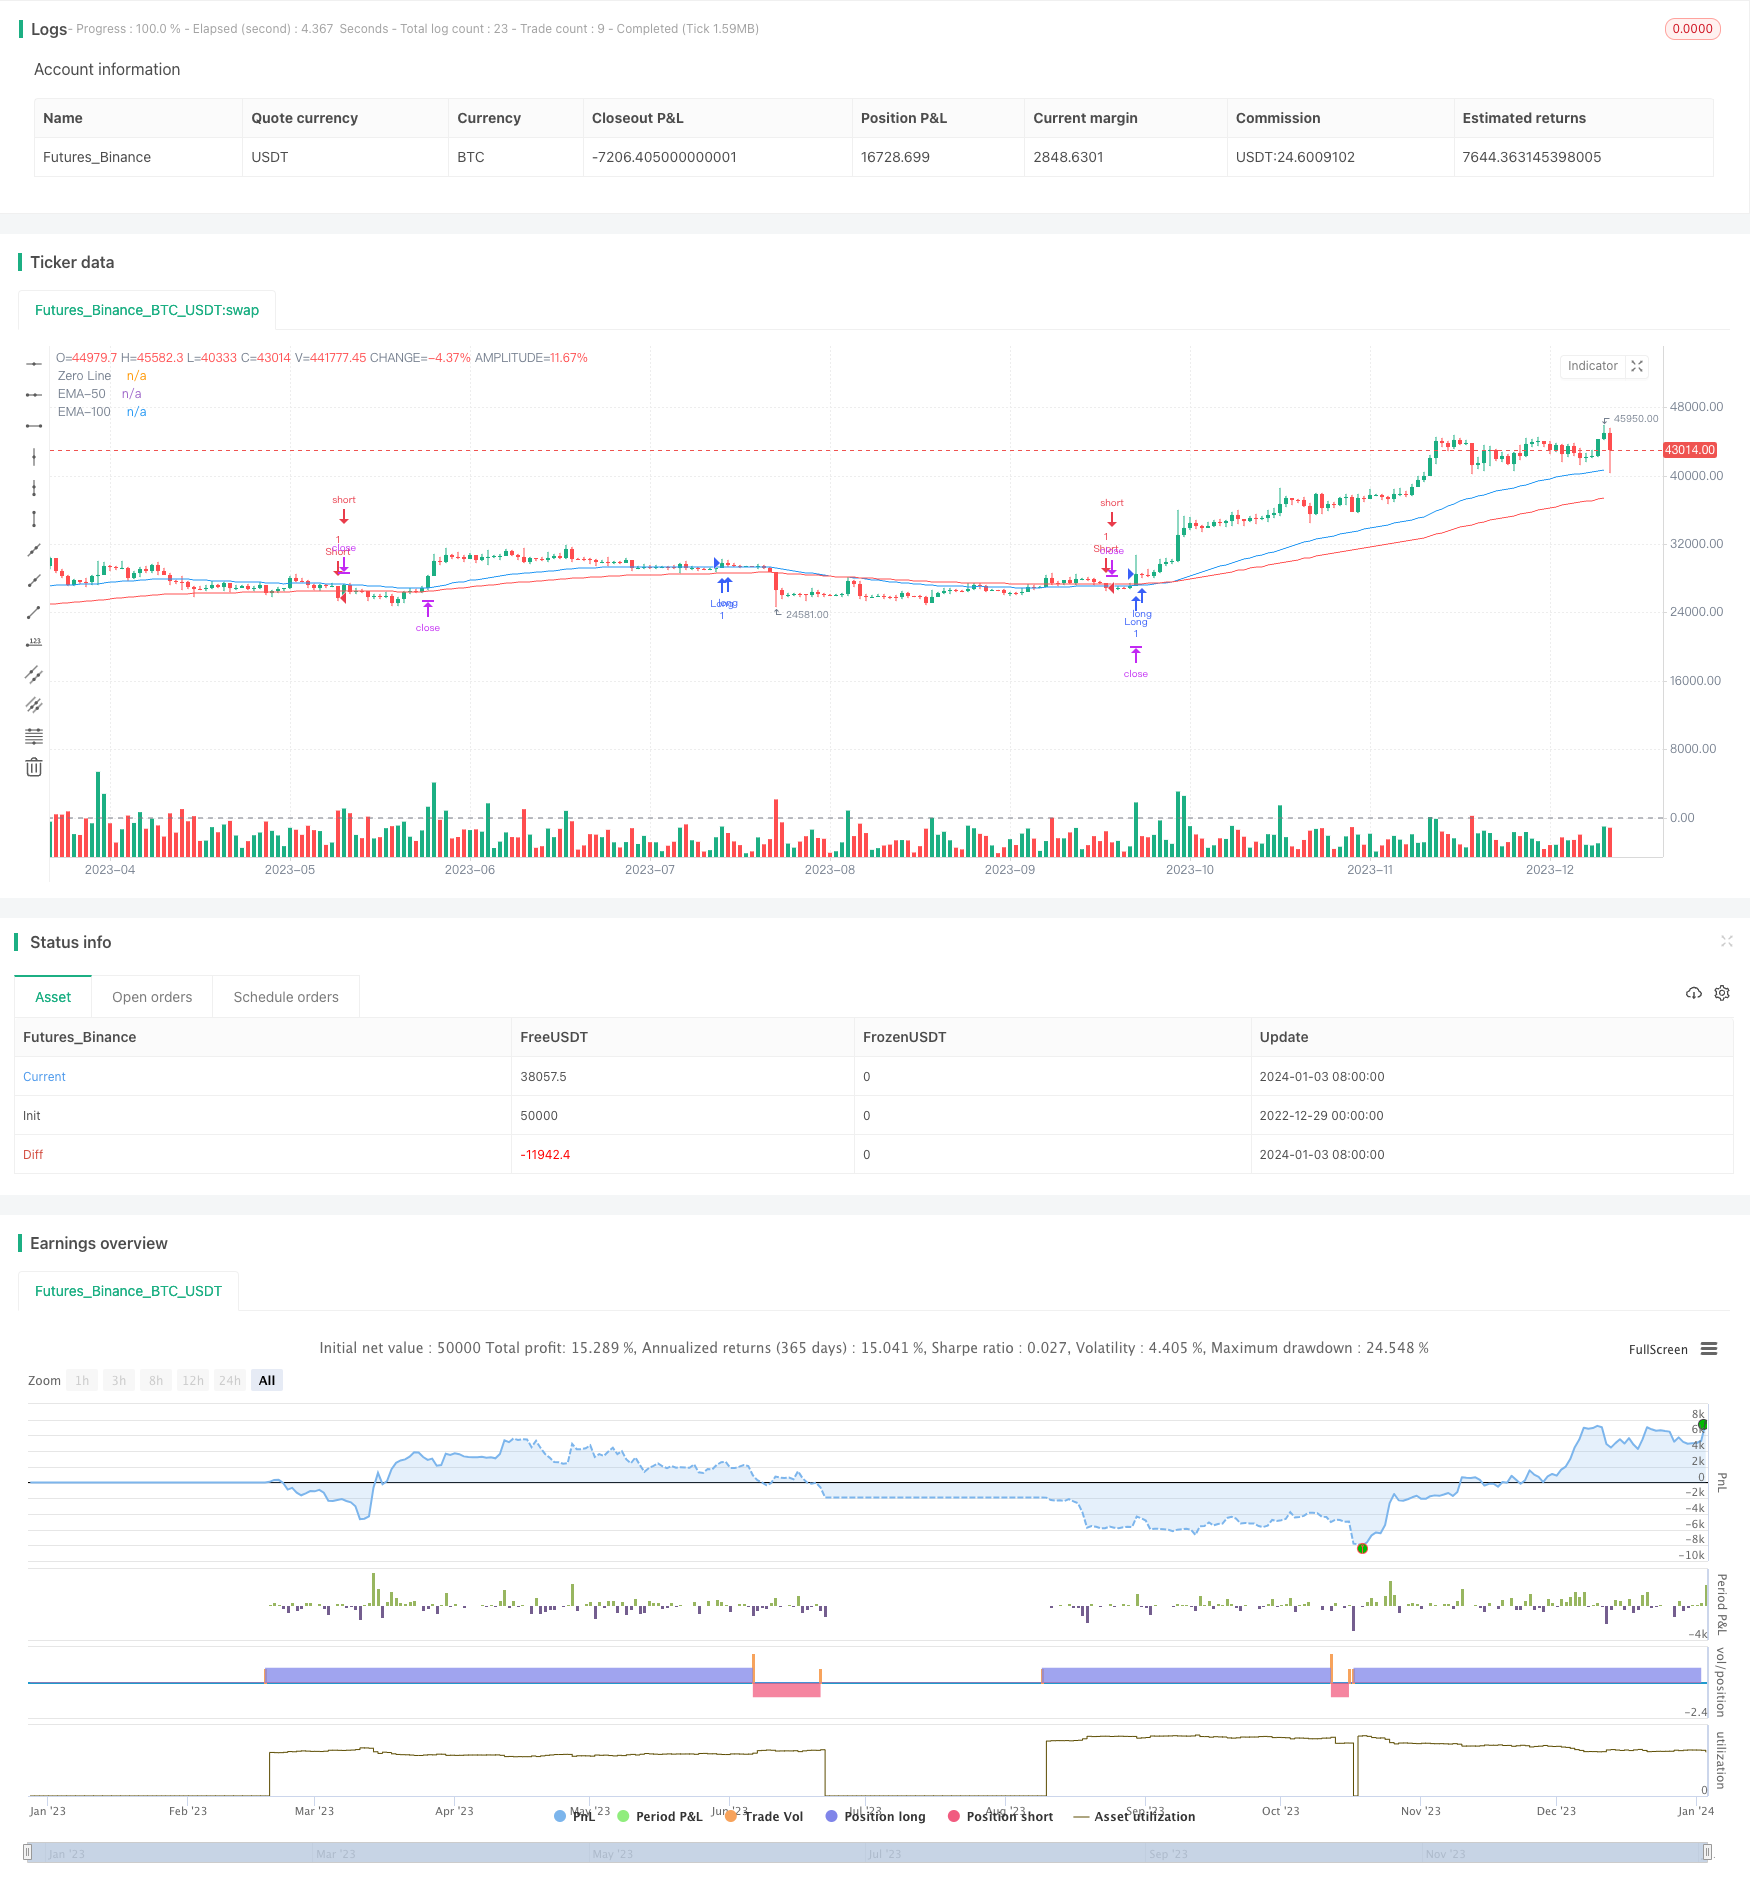
该策略综合利用EMA均线和MACD指标在多时间框架下识别趋势信号,以捕捉中长线趋势。当短期趋势与中长期趋势方向一致时,采取趋势跟踪操作。同时,策略利用ATR指标设定止损止盈,对波动进行风险控制。
策略以50日EMA线和100日EMA线判断中长期趋势方向。当短期趋势由MACD指标识别时,判断短期趋势方向与中长期趋势方向是否一致。如果一致,采取趋势跟踪操作。
具体来说,当MACD快线上穿慢线,并且 closes > 50日EMA 且 closes > 100日EMA时,做多;当MACD快线下穿慢线,并且 closes < 50日EMA 且 closes < 100日EMA时,做空。
此外,策略利用ATR指标计算波动范围,设定止损止盈价格。以close价格的一定倍数的ATR作为止损位,以close价格的一定倍数的ATR作为止盈位。
- 结合EMA均线和MACD指标,可以在多时间框架下识别趋势信号,防止错失中长线趋势
- 利用ATR指标根据市场波动设定止损止盈位,可以有效控制风险
- 避免交易市场中性区域,减少不必要损失
- EMA均线存在滞后性,可能错过转折点
- MACD指标存在多个时间周期,参数设置会影响结果
- ATR波动范围无法完全代表未来价格波动,无法完全规避风险
对策:
- 结合其他指标确认信号,规避EMA滞后问题
- 调整MACD参数,优化结果
- 合理设定ATR倍数,控制最大损失
- 测试不同的EMA均线周期组合
- 优化MACD参数设置
- 利用机器学习方法自动寻找最优ATR止损止盈倍数
该策略综合利用EMA、MACD和ATR等指标,实现多时间框架下的趋势跟踪操作。通过参数优化,有望获取较好的策略收益率。同时也需要防范指标滞后、参数调整及波动控制不当等风险,需要继续优化与提升。
||
This strategy combines EMA lines and MACD indicator across timeframes to identify trend signals and capture mid-to-long term trends. It takes trend following actions when short-term trend aligns with mid-to-long term trend. Meanwhile, the strategy uses ATR indicator to set stop loss and take profit to control risks from fluctuations.
The strategy uses 50-day EMA and 100-day EMA to determine mid-to-long term trend direction. When short-term trend is identified by MACD indicator, it checks if the directions align. If yes, it takes trend following actions.
Specifically, when MACD fast line crosses above slow line, and closes > 50-day EMA and closes > 100-day EMA, it goes long. When MACD fast line crosses below slow line, and closes < 50-day EMA and closes < 100-day EMA, it goes short.
Also, the strategy uses ATR indicator to calculate range of fluctuations and set stop loss and take profit prices. It sets certain multiplier of ATR based on close price as stop loss level, and certain multiplier of ATR based on close price as take profit level.
-
Combining EMA lines and MACD indicator across timeframes helps identify trend signals and prevents missing mid-to-long term trends
-
Using ATR indicator to set stop loss and take profit based on market fluctuation effectively controls risks
-
Avoiding market neutral zones prevents unnecessary losses
-
EMA lines have lagging effect and may miss turning points
-
MACD indicator has multiple timeframes and parameter settings that impact results
-
ATR ranges cannot fully represent future price fluctuations, cannot eliminate risks
Counter measures:
-
Confirm signals with other indicators to avoid EMA lagging issues
-
Adjust MACD parameters and optimize results
-
Reasonably set ATR multiplier to control maximum loss
-
Test different combinations of EMA line periods
-
Optimize MACD parameter settings
-
Use machine learning methods to automatically find optimal ATR stop loss/take profit multipliers
The strategy combines EMA, MACD and ATR indicators to implement trend following operations across timeframes. Through parameter optimization, it has the potential to achieve good strategy return rates. Also need to prevent risks including indicator lagging, improper parameter adjustment and fluctuation control, and continue to optimize and enhance.
[/trans]
Strategy Arguments
| Argument | Default | Description |
|---|---|---|
| v_input_1 | 12 | Fast Length |
| v_input_2 | 26 | Slow Length |
| v_input_3 | 9 | Signal Length |
| v_input_4 | 14 | ATR Length |
| v_input_5 | 3 | Take Profit Multiplier |
| v_input_6 | true | Stop Loss Multiplier |
Source (PineScript)
/*backtest
start: 2022-12-29 00:00:00
end: 2024-01-04 00:00:00
period: 1d
basePeriod: 1h
exchanges: [{"eid":"Futures_Binance","currency":"BTC_USDT"}]
*/

//@version=5
strategy("EMA-50, EMA-100, and MACD Strategy with ATR for Stop Loss/Profit", overlay=true)

// MACD hesaplama
fastLength = input(12, title="Fast Length")
slowLength = input(26, title="Slow Length")
signalLength = input(9, title="Signal Length")
[macdLine, signalLine, _] = ta.macd(close, fastLength, slowLength, signalLength)

// EMA-50 ve EMA-100 hesaplama
ema50 = ta.ema(close, 50)
ema100 = ta.ema(close, 100)

// ATR hesaplama
atrLength = input(14, title="ATR Length")
atrValue = ta.atr(atrLength)

// Take Profit ve Stop Loss çoklayıcıları
takeProfitMultiplier = input(3.0, title="Take Profit Multiplier") // TP, 3 katı ATR
stopLossMultiplier = input(1.0, title="Stop Loss Multiplier")

// Long Pozisyon Koşulları
longCondition = ta.crossover(macdLine, signalLine) and close > ema50 and close > ema100

// Short Pozisyon Koşulları
shortCondition = ta.crossunder(macdLine, signalLine) and close < ema50 and close < ema100

// Take Profit ve Stop Loss Seviyeleri
takeProfitLevel = close + takeProfitMultiplier * atrValue
stopLossLevel = close - stopLossMultiplier * atrValue

// Long Pozisyon İşlemleri
strategy.entry("Long", strategy.long, when=longCondition)
strategy.exit("Take Profit/Stop Loss", from_entry="Long", loss=stopLossLevel, profit=takeProfitLevel)

// Short Pozisyon İşlemleri
strategy.entry("Short", strategy.short, when=shortCondition)
strategy.exit("Take Profit/Stop Loss", from_entry="Short", loss=stopLossLevel, profit=takeProfitLevel)

// Grafikte Gösterme
plot(ema50, color=color.blue, title="EMA-50")
plot(ema100, color=color.red, title="EMA-100")
hline(0, "Zero Line", color=color.gray)
Detail
https://www.fmz.com/strategy/437738
Last Modified
2024-01-05 11:16:17