Name
基于EMA均线和MACD指标的趋势跟踪策略EMA-Crossover-and-MACD-Signals-Trend-Following-Strategy
Author
ChaoZhang
Strategy Description
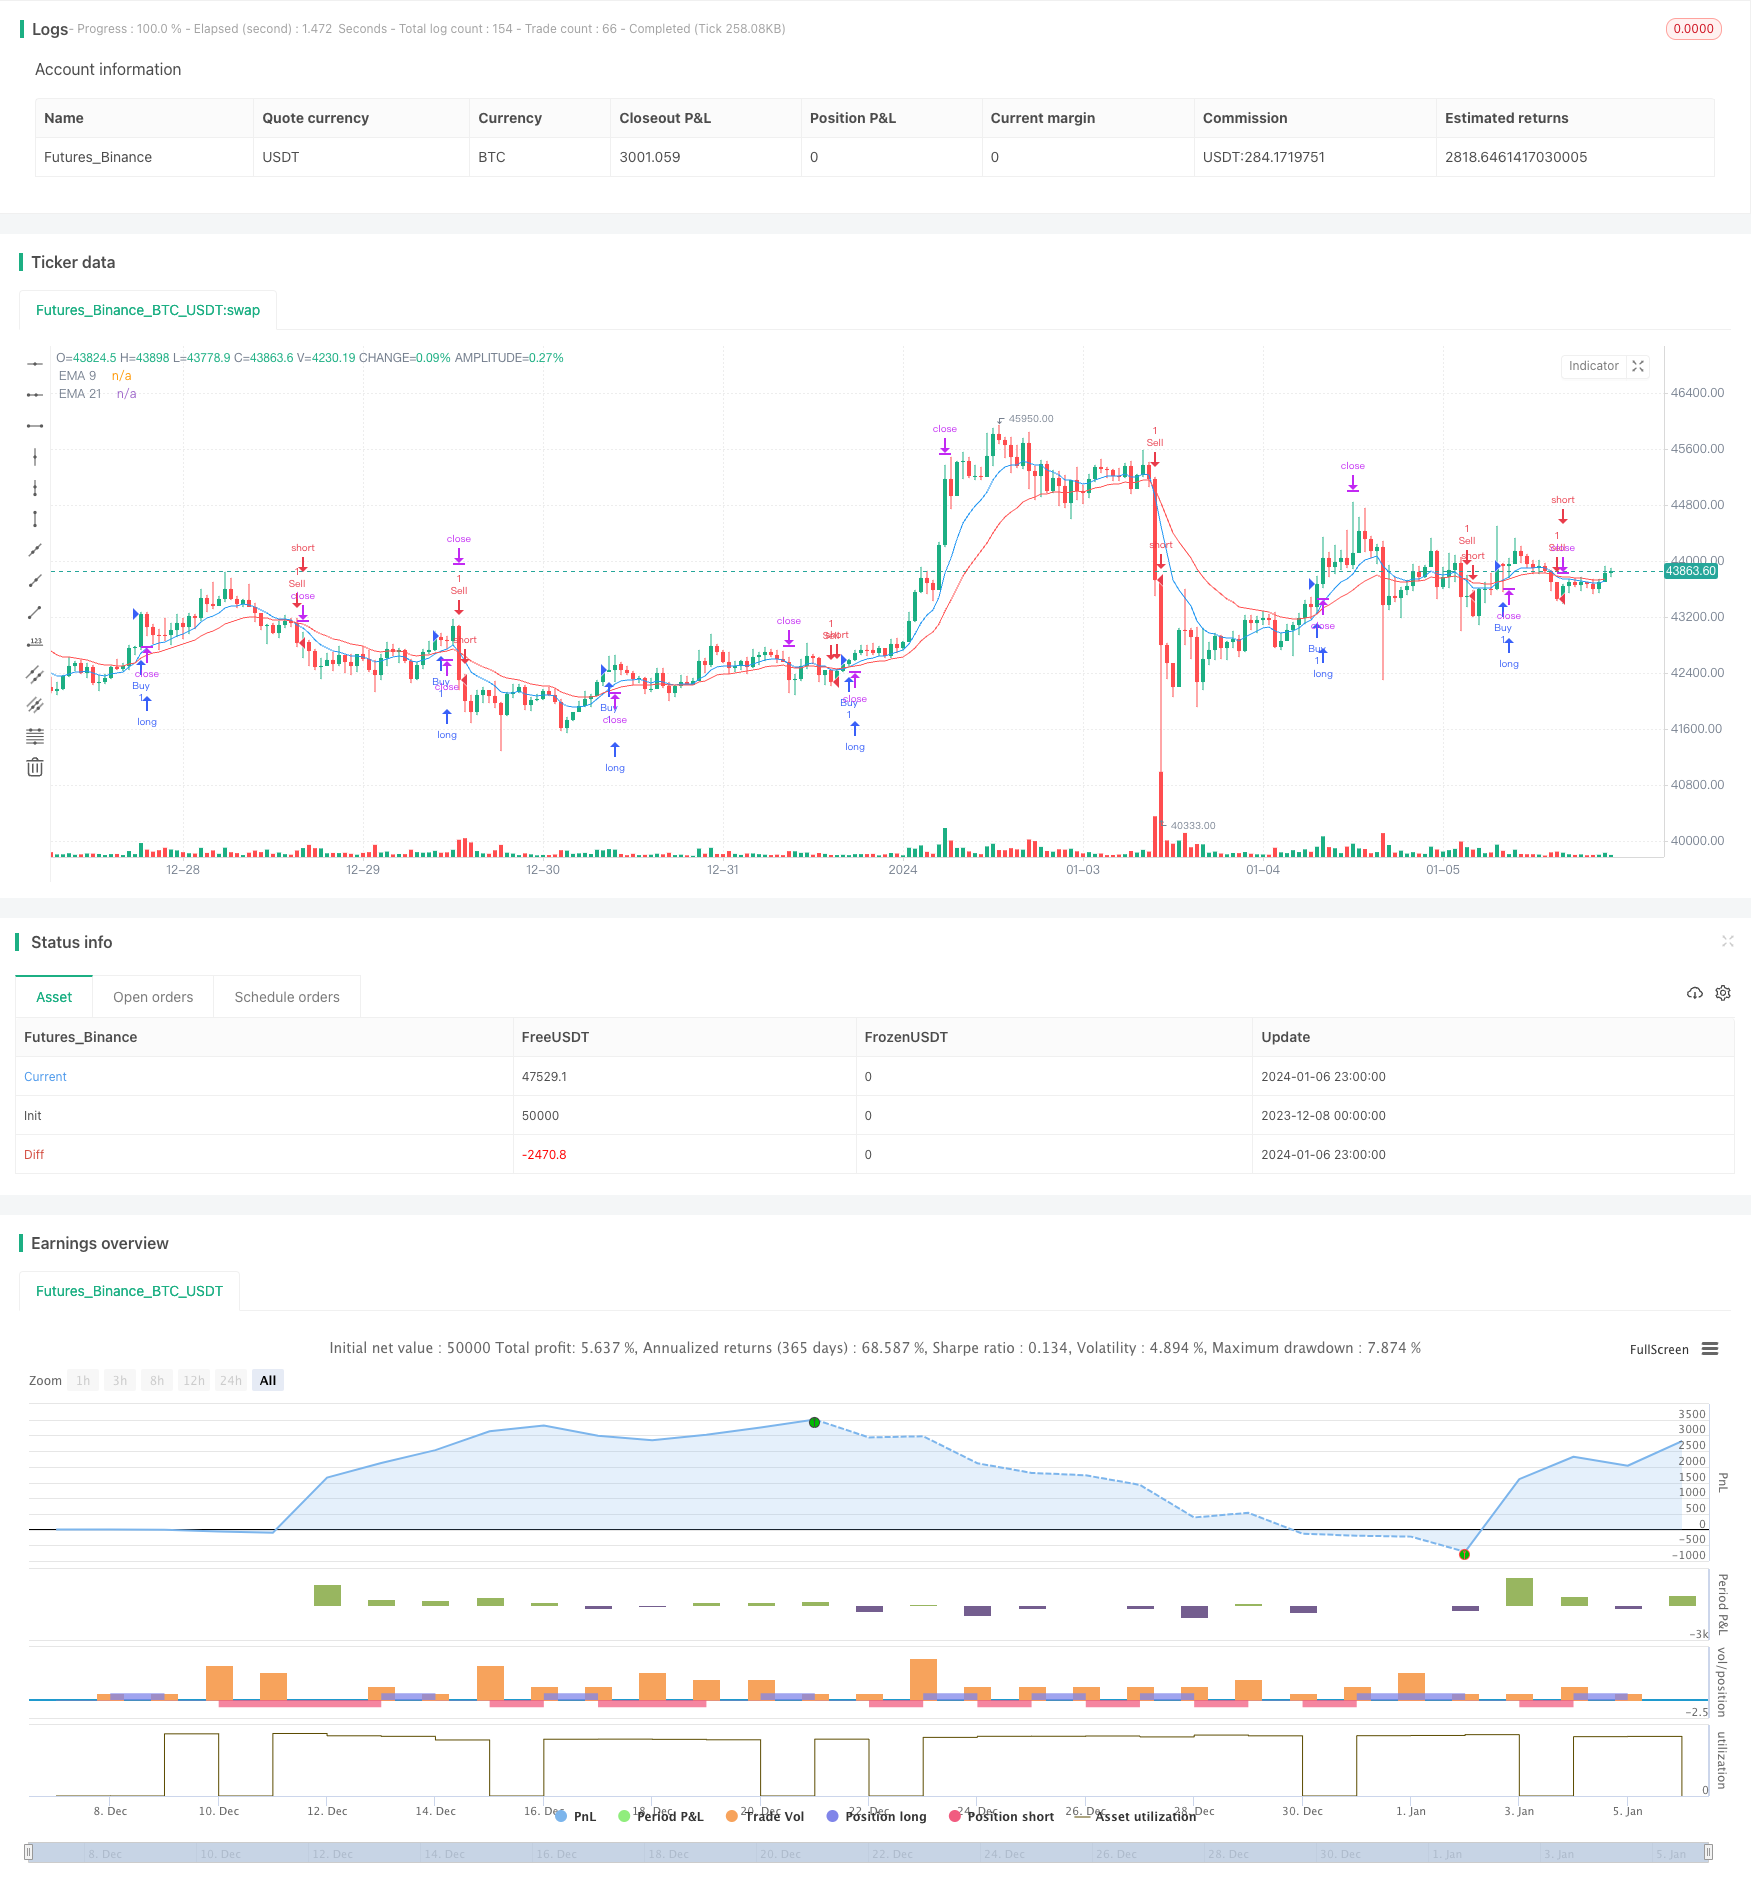
该策略运用EMA均线系统和MACD指标来识别趋势方向,在EMA均线发生黄金交叉时判断为上涨趋势建立多单;而在EMA均线发生死亡交叉时判断为下跌趋势建立空单。为filter波动性过大的信号,策略中增加MACD指标在两个时间周期上交叉作为附加的确认条件。
该策略主要基于EMA均线和MACD指标来捕捉中长线的价格趋势。其中使用9期和21期EMA构建均线系统,9EMA快速响应价格变动而21EMA则相对稳定,当快线上穿慢线时生成黄金交叉信号判断为价格处于上涨趋势;反之,快线下穿慢线时生成死亡交叉信号则判断为价格转为下跌趋势。EMA交叉信号受到一定周期内价格波动的影响,为了过滤假信号,策略中增加基于默认参数的MACD指标在1小时和4小时两个时间周期上的交叉作为附加的确认条件。满足均线交叉和MACD交叉双重条件后开仓。
那么识别到价格反转趋势后如何确定入场和退出的时机呢?本策略判断价格在EMA均线上方时为涨势,在下方为跌势,所以在黄金交叉发生时如果收盘价高于EMA 21 则开多单;死亡交叉时如果收盘价低于EMA 21则开空单。这里的依据是均线价格的支撑和压力特性,打开仓位后设置止损和止盈价格以锁定盈利并控制风险。
-
基于均线判断中长期趋势方向,再辅以MACD指标过滤假信号,可以有效识别价格反转点。
-
EMA均线上下轨以及MACD多空转向的组合,形成了多重验证的交易信号。使策略可以在趋势较明显时进行交易。
-
通过在EMA均线附近开仓,利用均线的支持压力特征来设置止损止盈,可以获得较好的风险回报比。
-
相对比较长线的指标参数设置,避免被短期市场波动干扰信号,适合中长线趋势跟踪。
-
均线系统及MACD指标都无法准确预测价格反转点,存在一定的滞后。如遇到突发事件导致快速调整可能入场过晚止损。
-
EMA均线交叉并不一定代表真实趋势转折,如果本轮行情波动较大信号可能不可靠。
-
MACD指标参数设置不当也可能误报信号或漏报信号,导致错过交易机会或错误入场。
-
作为趋势跟踪策略,容易被突发事件震荡的市场否定,一旦止损可能损失较大。
-
测试调整EMA均线的长短周期数值,找到最优参数组合。例如调整为20和60日EMA。
-
测试MACD指标的参数来获取最稳定可靠的信号线组合。例如调整MACD的长短均线周期。
-
对止损止盈条件进行测试和优化,设置最合适的止损幅度。可根据收益风险比来综合判断。
-
增加其他指标signals作为EMA均线交叉的确认指标。例如KDJ指标或布林带指标的信号。
-
增加自适应止损策略,让止损线可以跟踪止盈线,改善风险控制的效果。
该策略整合EMA均线交易系统和MACD指标的优点,试图捕捉价格中长线趋势的转折点。在确认双重信号后选择最佳入场时机开仓,并设置止损止盈来锁定利润。通过参数优化和加入其他指标可以进一步增强信号的准确性。但需注意作为趋势跟踪策略,市场短期内的震荡可能增加其止损风险。总体而言,该策略基于简单易用的技术指标并形成多重验证机制,适用于跟踪中长线价格趋势,可获得较好的盈亏比。
||
This strategy utilizes the EMA crossover system and MACD indicator to identify trend direction. It goes long when a golden cross occurs on the EMA lines judging that an uptrend is established, and it goes short when a death cross occurs on the EMA lines judging that a downtrend has started. To filter signals with high volatility, an additional condition of MACD crossover on both the current and 4-hour timeframes is included to confirm buy or sell signals.
The strategy mainly relies on EMA crossover and MACD indicator to capture mid- to long-term price trends. The EMA system consists of 9-period and 21-period EMA. The 9 EMA responds quickly to price changes while the 21 EMA is relatively more stable. When the fast EMA line crosses above the slow EMA line, it generates a golden cross signal indicating an uptrend. When the fast EMA line crosses below the slow EMA line, it generates a death cross signal indicating a downtrend. EMA crossover signals can be affected by price fluctuations within certain periods. To filter false signals, this strategy utilizes MACD crossover on both 1-hour and 4-hour timeframes based on default parameters as an additional confirmation. When both EMA crossover and MACD crossover conditions are met, the strategy enters a position.
So when a trend reversal is identified, how to determine the entry and exit points? This strategy judges an uptrend when price is above EMA 21 and a downtrend when price is below EMA 21. Therefore, when a golden cross happens, a long position will be opened if the close price is higher than EMA 21. When a death cross happens, a short position will be opened if the close price is lower than EMA 21. The rationale here is the support and resistance characteristic of moving average prices. After entering a position, stop loss and take profit prices are set to lock in profits and control risks.
-
Identifying mid- to long-term trend direction based on MA lines and filtering false signals with MACD makes it effective to detect trend reversal points.
-
The combination of EMA channel and MACD crossover forms multiple layers of verification for trading signals, allowing the strategy to trade when a clear trend is established.
-
By entering positions around EMA lines and utilizing their support/resistance levels for stop loss/profit taking, good risk reward ratios can be achieved.
-
The relatively long parameters prevent interference from short-term market fluctuations and suit for mid- to long-term trend following.
-
Both moving averages and MACD cannot precisely predict trend reversal points, with some lagging effect. Sudden price changes may trigger late entry with a stop loss hit.
-
EMA crossovers do not necessarily represent real trend reversals. Signals can be unreliable if volatility of the current market cycle is high.
-
Inappropriate MACD parameter settings may cause missed or false signals, missing trading opportunities or entering in the wrong direction.
-
As a trend following strategy, it is vulnerable whipsaws in ranging markets. A stop loss hit may result in big loss in such cases.
-
Test and optimize EMA period parameters to find the optimal combination, e.g. 20 and 60 days EMA.
-
Test MACD parameters for the most reliable signal line combination, e.g. fast/slow EMA periods of MACD.
-
Test and optimize stop loss/profit taking rules to find the most appropriate stop loss percentage, judged by risk-reward ratios.
-
Incorporate other indicator signals as confirmation for EMA crossovers, e.g. KDJ indicator or Bollinger Bands.
-
Add adaptive stop loss mechanism to trail stop loss along profit taking price, improving risk control.
This strategy combines the strengths of EMA trading system and MACD indicator in an attempt to capture mid- to long-term trend reversal points. It enters positions upon confirming dual signals and set stop loss/profit taking levels to lock in profits. Further improvements on signal accuracy can be achieved through parameter optimization and incorporating additional indicators. Note that as a trend following strategy, it is vulnerable to whipsaws in the short term. Overall, building upon simple and intuitive technical indicators while forming multi-layer signal verification, this strategy suits for mid- to long-term trend tracking and can achieve decent risk-adjusted returns. [/trans]
Strategy Arguments
| Argument | Default | Description |
|---|---|---|
| v_input_float_1 | true | Stop Loss (%) |
| v_input_float_2 | 2 | Take Profit (%) |
Source (PineScript)
/*backtest
start: 2023-12-08 00:00:00
end: 2024-01-07 00:00:00
period: 1h
basePeriod: 15m
exchanges: [{"eid":"Futures_Binance","currency":"BTC_USDT"}]
*/

//@version=5
strategy("EMA Crossover and Close Above/Below EMA 21", overlay=true)

// Define the EMA lengths
ema9 = ta.ema(close, 9)
ema21 = ta.ema(close, 21)

// Define Buy and Sell conditions
buyCondition = ta.crossover(ema9, ema21) and close > ema21
sellCondition = ta.crossunder(ema9, ema21) and close < ema21

// Calculate stop loss and take profit levels (adjust as needed)
stopLossPct = input.float(1, title="Stop Loss (%)") / 100
takeProfitPct = input.float(2, title="Take Profit (%)") / 100

stopLoss = close * (1 - stopLossPct)
takeProfit = close * (1 + takeProfitPct)

// Plot EMA lines
plot(ema9, color=color.blue, title="EMA 9")
plot(ema21, color=color.red, title="EMA 21")

// Strategy entry and exit
if buyCondition
    strategy.entry("Buy", strategy.long)

if sellCondition
    strategy.entry("Sell", strategy.short)

strategy.exit("Take Profit/Stop Loss", from_entry="Buy", stop=stopLoss, limit=takeProfit)
Detail
https://www.fmz.com/strategy/438034
Last Modified
2024-01-08 14:31:56