Name
基于EMA均线和RSI指标的量化交易策略EMA-and-RSI-Quantitative-Trading-Strategy
Author
ChaoZhang
Strategy Description
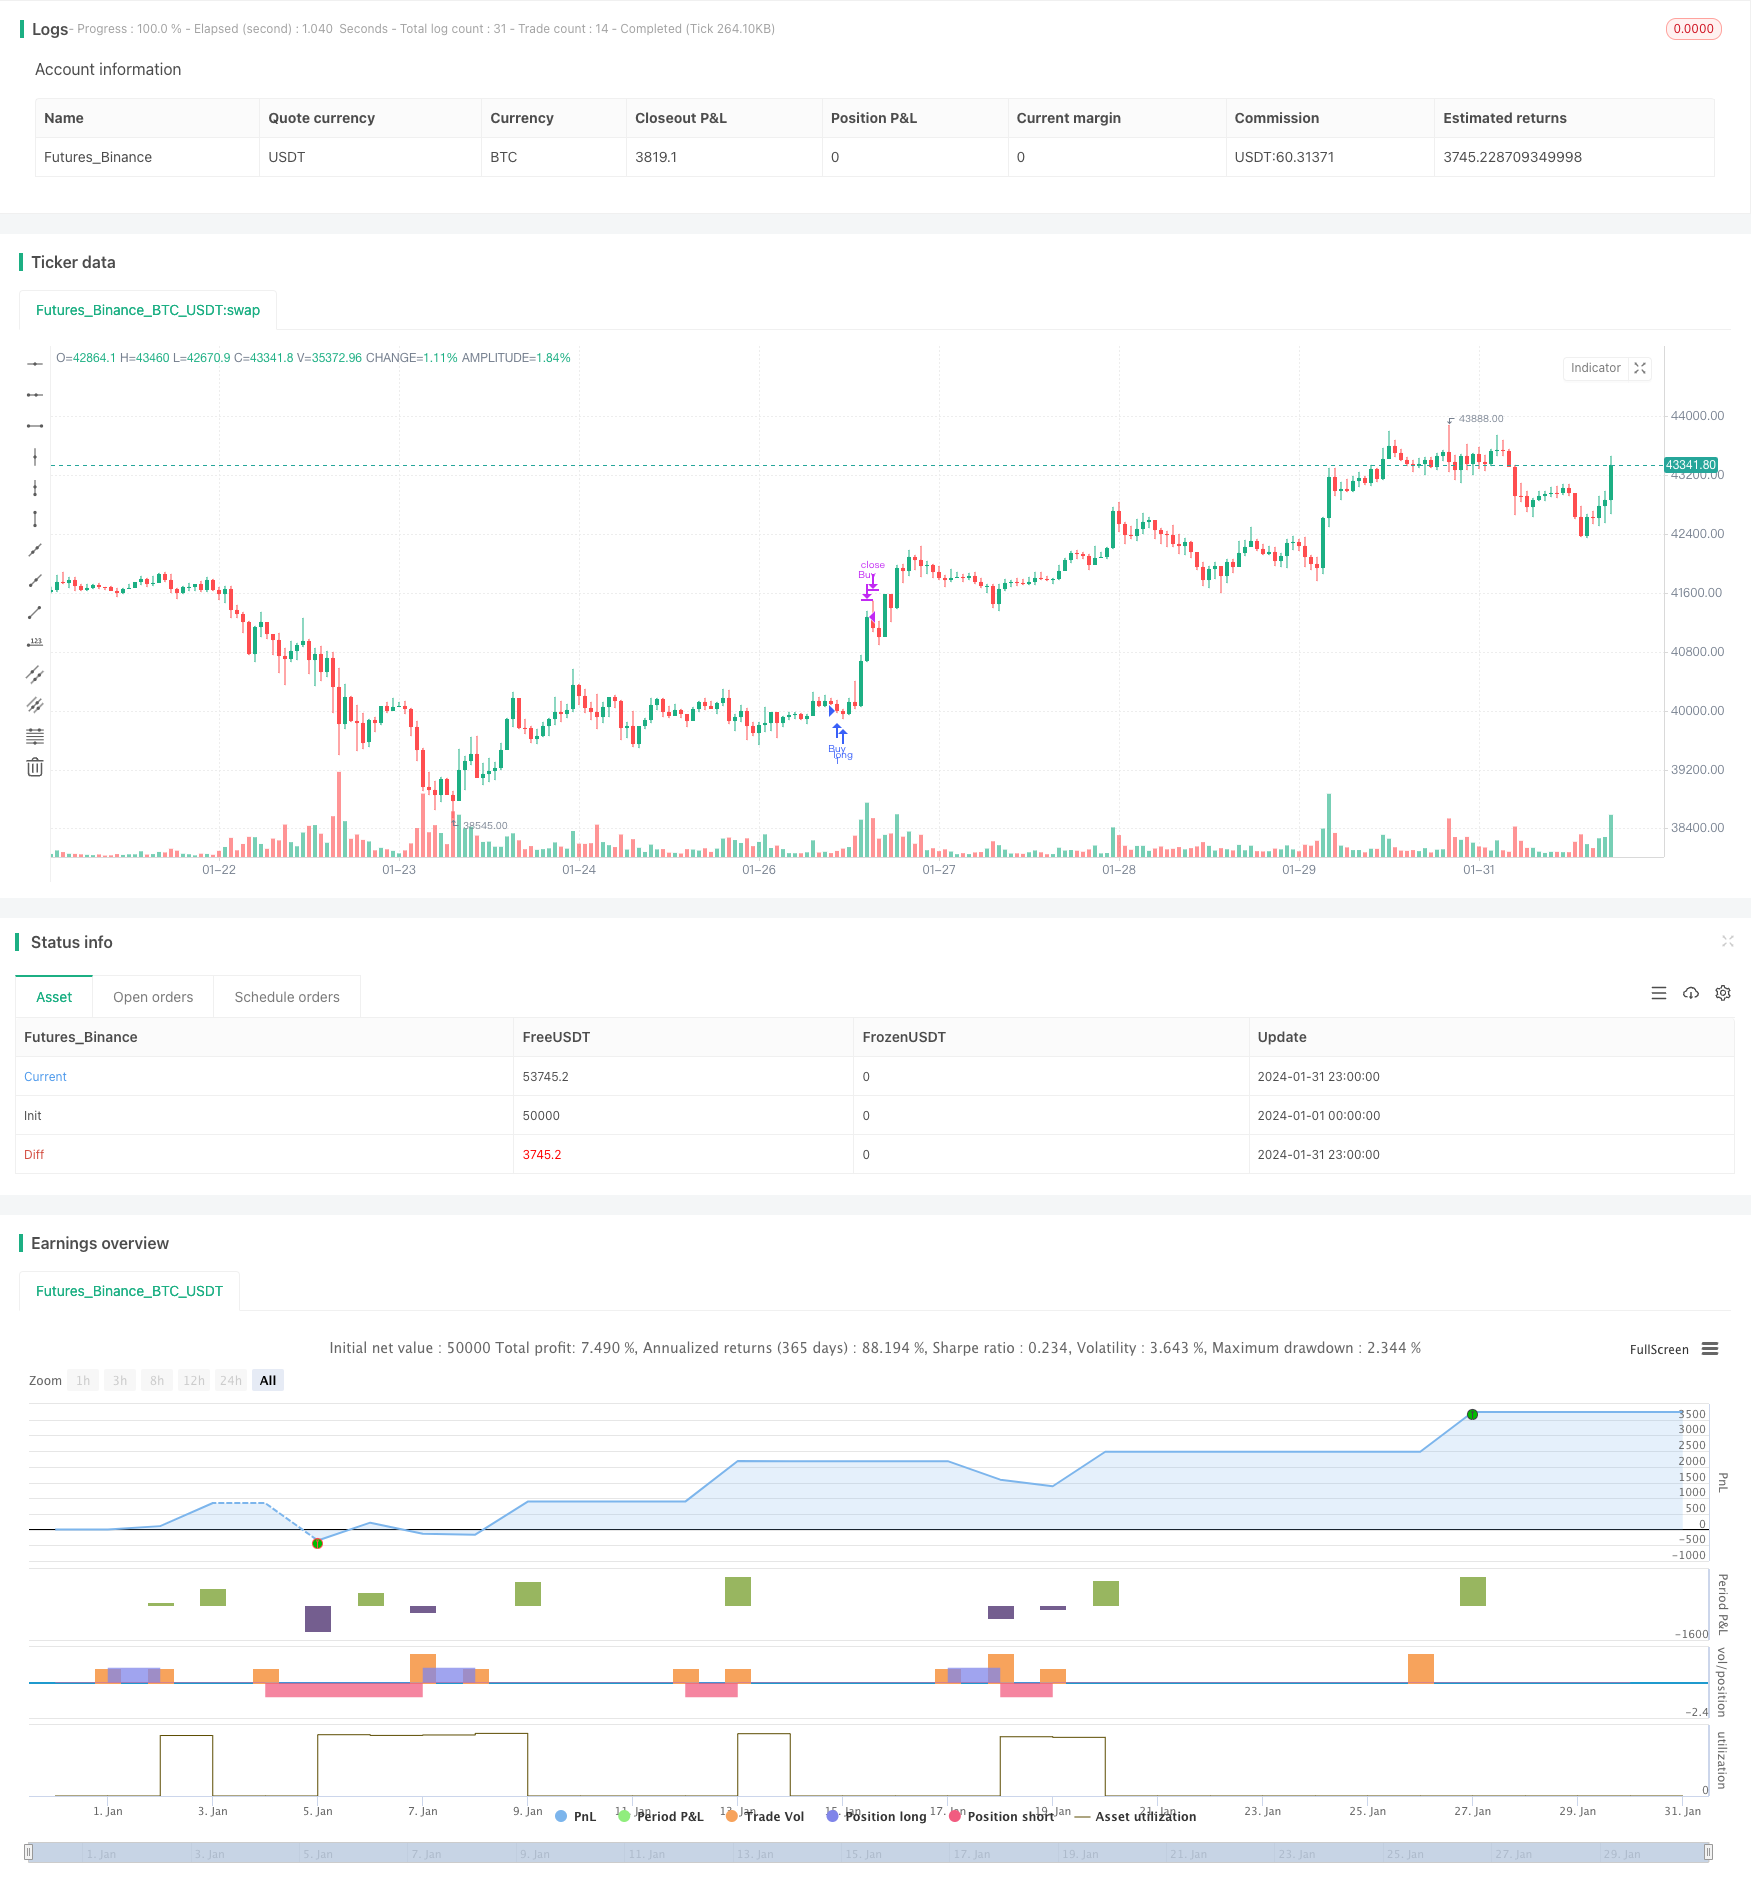
本策略称为“双均抄底策略”。该策略利用EMA均线系统与RSI指标的组合,形成交易信号,并设定止损和止盈条件,实现亏损控制和盈利目标。策略适用于BTC/USD和其他数字货币交易。
该策略以50日EMA均线和100日SMA均线为核心技术指标。当短期EMA上穿长期SMA时产生买入信号;当EMA下穿SMA时产生卖出信号,这是典型的趋势跟踪策略。同时结合RSI指标判断市场是否过热过冷,RSI高于70为超买区,低于30为超卖区,可以避免不必要的追高杀跌。
具体交易规则如下:
买入条件:50日EMA上穿100日SMA
卖出条件:50日EMA下穿100日SMA
止盈条件:RSI大于70时平多单;RSI小于30时平空单
该策略集成了均线、RSI等多种指标,形成比较稳定和可靠的交易信号。相比单一指标,多指标集成能够过滤掉一些假信号。
EMA快速响应价格变化,SMA能抑制短期噪音。EMA和SMA的配合使用,平衡了指标的灵敏度。
RSI指标判断超买超卖区,有助于把握大趋势,避免追高杀跌。
该策略依赖指标拟合历史数据,存在过拟合风险。如果市场状态发生重大变化,策略表现会受到影响。此外,数字货币市场波动大,止损点设定也有难度。
应对方法:
- 继续优化指标参数,改进信号质量
- 结合更多因子,判断交易机会
- 动态调整止损位,优化止损策略
该策略可以从以下几个方面进行进一步优化:
-
整合更多指标,如MACD、布林带等,形成指标集群,增强信号的稳健性。
-
尝试机器学习模型自动优化指标参数。目前参数依赖经验值设定,可以采用强化学习、进化优化等算法自动寻找最优参数。
-
结合交易量指标。增加交易量确认,避免出现无量突破的假信号。
-
增加自动止损策略,通过追踪波动率等指标,实现止损点的动态调整。
该策略整合EMA、SMA和RSI指标,形成稳定的交易信号。并设定比较清晰的止盈止损规则,对资金风险控制到位。但仍存在过拟合、止损点设置困难等问题。未来将从提高信号质量、止损策略优化等方面进行改进。
||
The strategy is called "Double Moving Average Bottom Pick" strategy. It uses the combination of EMA and RSI indicators to generate trading signals and sets stop loss and take profit conditions to control losses and achieve profit target. The strategy is applicable to trading BTC/USD and other cryptocurrencies.
The core technical indicators of this strategy are 50-day EMA and 100-day SMA. A buy signal is generated when the short-term EMA crosses over the long-term SMA, and a sell signal is generated when the EMA crosses below the SMA. This is a typical trend following strategy. The RSI indicator is also incorporated to gauge whether the market is overbought or oversold. The overbought level is set at 70 and oversold level at 30 to avoid unnecessary chasing high and killing lows.
The specific trading rules are as follows:
Buy Condition: 50-day EMA crosses over 100-day SMA Sell Condition: 50-day EMA crosses below 100-day SMA
Take Profit Condition: Close long position when RSI greater than 70; Close short position when RSI less than 30.
The strategy integrates multiple technical indicators including moving averages and RSI, forming relatively stable and reliable trading signals. Compared with single indicator strategies, the integration of multiple indicators helps filter out some false signals.
EMA responds swiftly to price changes while SMA suppresses short-term noises. The combination balances the sensitivity of the indicators.
RSI judging overbought/oversold area helps traders grasp the major trend and avoid chasing highs and killing lows.
The strategy relies on fitting indicators to historical data, posing overfitting risks. Significant market regime change can undermine strategy performance. Also, high volatility and difficulty in stop loss point setting in crypto markets remain a practical challenge.
Solutions:
- Continue parameter tuning and signal quality improvement
- Incorporate more factors to evaluate trading opportunities
- Dynamically adjust stop loss to optimize stop loss strategy
The strategy can be further enhanced from the following aspects:
-
Integrate more technical indicators like MACD and Bollinger Bands to form an indicator cluster and strengthen signal robustness.
-
Try machine learning models to auto tune parameters. Currently parameters depend on empirical assumptions. Algorithms like reinforcement learning and evolutionary optimization can find optimized parameters automatically.
-
Incorporate trading volume indicators. Volume confirmation prevents false breakout signals without substantive volume backup.
-
Build in automated stop loss strategies. By tracking metrics like volatility dynamics, stop loss points can be adjusted dynamically.
The strategy consolidates EMA, SMA and RSI to form stable trading signals. Clear take profit and stop loss rules control capital risks. But issues like overfitting, difficulty in stop loss point setting still exist. Future improvements will focus on enhancing signal quality, optimizing stop loss strategies etc.
[/trans]
Strategy Arguments
| Argument | Default | Description |
|---|---|---|
| v_input_1 | 14 | RSI Length |
| v_input_2 | 70 | Overbought Level |
| v_input_3 | 30 | Oversold Level |
Source (PineScript)
/*backtest
start: 2024-01-01 00:00:00
end: 2024-01-31 23:59:59
period: 1h
basePeriod: 15m
exchanges: [{"eid":"Futures_Binance","currency":"BTC_USDT"}]
*/

// This Pine Script™ code is subject to the terms of the Mozilla Public License 2.0 at https://mozilla.org/MPL/2.0/
// © Wallstwizard10

//@version=4
strategy("Estrategia de Trading", overlay=true)

// Definir las EMA y SMA
ema50 = ema(close, 50)
sma100 = sma(close, 100)

// Definir el RSI
rsiLength = input(14, title="RSI Length")
overbought = input(70, title="Overbought Level")
oversold = input(30, title="Oversold Level")
rsi = rsi(close, rsiLength)

// Condiciones de Compra
buyCondition = crossover(ema50, sma100) // EMA de 50 cruza SMA de 100 hacia arriba

// Condiciones de Venta
sellCondition = crossunder(ema50, sma100) // EMA de 50 cruza SMA de 100 hacia abajo

// Salida de Operaciones
exitBuyCondition = rsi >= overbought // RSI en niveles de sobrecompra
exitSellCondition = rsi <= oversold // RSI en niveles de sobreventa

// Lógica de Trading
if (buyCondition)
    strategy.entry("Buy", strategy.long)

if (sellCondition)
    strategy.entry("Sell", strategy.short)

if (exitBuyCondition)
    strategy.close("Buy")

if (exitSellCondition)
    strategy.close("Sell")
Detail
https://www.fmz.com/strategy/443119
Last Modified
2024-02-29 13:52:20