Name
基于EMA平均线的趋势跟踪策略Trend-Following-Strategy-Based-on-EMA-Lines
Author
ChaoZhang
Strategy Description
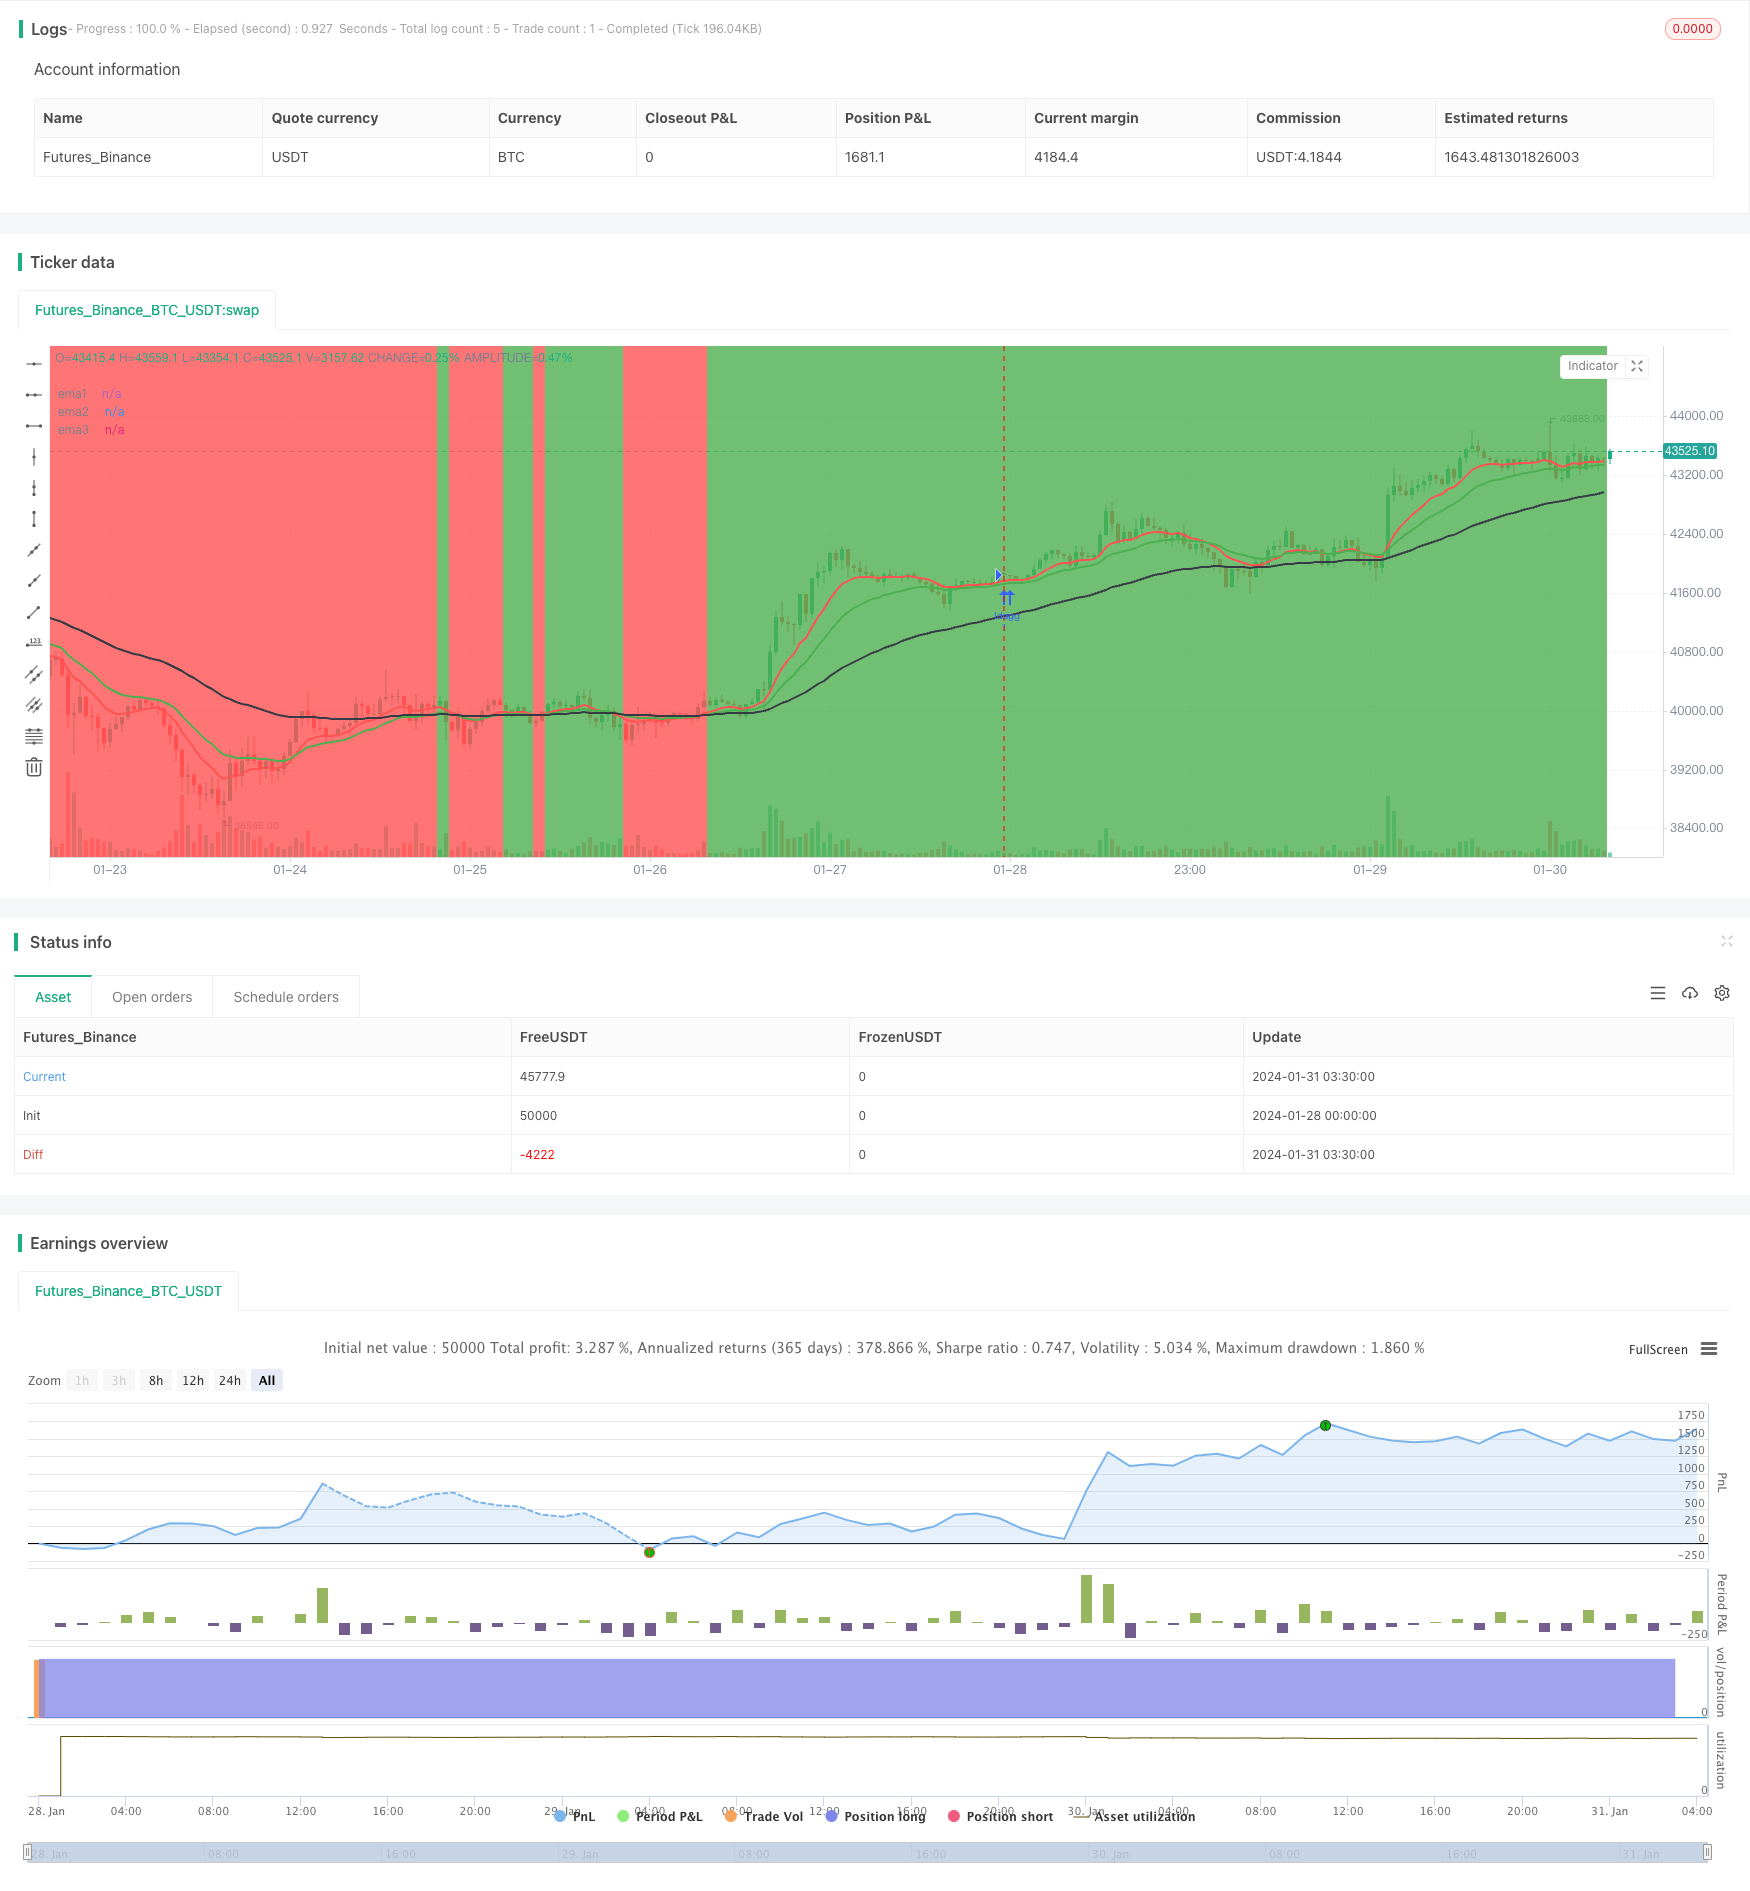
该策略基于3条不同周期的EMA平均线,通过判断价格是否处于EMA平均线之上,来判断目前的趋势方向。当短期EMA线上穿长期EMA线时生成买入信号;当短期EMA线下穿长期EMA线时生成卖出信号。该策略追踪趋势运行,在趋势转向时及时平仓。
该策略使用3条EMA平均线,分别是10日线、20日线和50日线。其判断规则为:
-
当10日EMA线和20日EMA线同时位于50日EMA线之上时,定义为上升趋势;
-
当10日EMA线和20日EMA线同时位于50日EMA线之下时,定义为下降趋势;
-
当短期EMA线(10日线和20日线)上穿长期EMA线(50日线)时产生买入信号;
-
当短期EMA线(10日线和20日线)下穿长期EMA线(50日线)时产生卖出信号;
-
在上升趋势中持有多头仓位,下降趋势中持有空头仓位;
-
在趋势转向时(EMA短期线与长期线发生穿透)平掉当前信号方向的头寸。
该策略通过 capture profit,通过及时平仓锁定盈利的方式轮番进行多空操作。
该策略具有以下优势:
- 规则简单清晰,容易理解和实现;
- 利用EMA平均线判断趋势方向,避免被市场短期波动干扰;
- 及时平仓,追踪趋势运行,避免亏损扩大;
- 无需预测行情方向,跟踪趋势运行,胜率较高。
该策略也存在一些风险:
- 在盘整市的时候,EMA平均线之间容易出现多次穿透,可能频繁开仓平仓带来交易成本;
- 行情跳空后EMA判断趋势的效果会受到影响,可能错失良好的开仓机会。
针对以上风险,可以通过以下方法加以优化:
- 在EMA间距较小时,可以适当放宽开仓规则,避免过于频繁交易;
- 结合其他指标确定趋势,避免EMA判断失效的情况。
该策略可以从以下几个方向进行优化:
-
参数优化。可以测试不同EMA周期的参数组合,找到最佳的参数;
-
交易成本优化。适当优化开仓规则,减少不必要的频繁交易;
-
止损策略优化。设定合理的止损水平,控制单笔损失;
-
结合其他指标。运用MACD,KDJ等其他指标辅助判断,优化入场时机。
该策略整体来说较为简单实用。其利用EMA判断趋势运行方向,附带适当的止损策略,可以有效控制风险。同时也存在一些优化空间,若果结合参数优化、止损策略、其他指标等,该策略的效果还具有很大提升空间。
||
This strategy is based on 3 EMA lines of different periods. It judges the current trend direction by whether the price is above the EMA lines. When the short-term EMA line crosses above the long-term EMA line, a buy signal is generated. When the short-term EMA line crosses below the long-term EMA line, a sell signal is generated. This strategy tracks the trend runs and closes positions in time when trend reverses.
The strategy uses 3 EMA lines, which are 10-day, 20-day and 50-day respectively. The judging rules are:
-
When both 10-day EMA and 20-day EMA are above 50-day EMA, it is defined as an uptrend;
-
When both 10-day EMA and 20-day EMA are below 50-day EMA, it is defined as a downtrend;
-
When short-term EMA lines (10-day and 20-day) cross above long-term EMA line (50-day), a buy signal is generated;
-
When short-term EMA lines (10-day and 20-day) cross below long-term EMA line (50-day), a sell signal is generated;
-
Hold long position during uptrend and hold short position during downtrend;
-
Close current directional position when trend reverses (short-term EMA crosses long-term EMA).
The strategy captures profit by timely closing positions to lock in gains and alternating between long and short positions.
The advantages of this strategy are:
- The rules are simple and clear, easy to understand and implement;
- Using EMA lines to determine trend avoids interference from short-term market fluctuations;
- Timely closing positions to track trend runs avoids expanding losses;
- No need to predict market direction with high winning rate by tracking trends.
There are also some risks in this strategy:
-
During range-bound markets, EMA lines may crossover frequently, resulting in high trading costs from frequently opening and closing positions;
-
Trend determination by EMA may fail after price gap, missing good entry opportunities.
To optimize the risks, some methods can be used:
-
Open position rules can be relaxed properly when EMAs are close to avoid over-trading;
-
Determine trend combining other indicators to avoid EMA failure.
The strategy can be optimized from the following aspects:
-
Parameter optimization. Test different EMA period combinations to find the optimal parameters;
-
Trading cost optimization. Optimize open position rules properly to reduce unnecessary frequent trading;
-
Stop loss strategy optimization. Set reasonable stop loss level to control single loss;
-
Combine other indicators. Use MACD, KDJ and other indicators to assist in determining optimal entry timing.
In general, this strategy is quite simple and practical. It uses EMA to determine trend direction with proper stop loss strategy to effectively control risks. There are also rooms for optimization. By combining parameter optimization, stop loss strategy and other indicators, the performance of this strategy can be further improved.
[/trans]
Strategy Arguments
| Argument | Default | Description |
|---|---|---|
| v_input_1 | true | infoBox |
| v_input_2 | false | infoBox2 |
| v_input_3 | false | Buy & SellSignal |
| v_input_4 | 0 | infoBoxSize: size.large |
| v_input_5 | 10 | ema1Value |
| v_input_6 | 20 | ema2Value |
| v_input_7 | 59 | ema3Value |
| v_input_8 | 3000 | maxLoss |
Source (PineScript)
/*backtest
start: 2024-01-28 00:00:00
end: 2024-01-31 04:00:00
period: 45m
basePeriod: 5m
exchanges: [{"eid":"Futures_Binance","currency":"BTC_USDT"}]
*/

// This source code is subject to the terms of the Mozilla Public License 2.0 at https://mozilla.org/MPL/2.0/
// © mattehalen

//@version=4
//study("EMA 10,20 59",overlay=true)
strategy("EMA 10,20 59",overlay=true)
infoBox     = input(true, title="infoBox", type=input.bool)
infoBox2    = input(false, title="infoBox2", type=input.bool)
BuySellSignal_Bool = input(false, title="Buy & SellSignal", type=input.bool)
infoBoxSize = input(title="infoBoxSize", defval=size.large, options=[size.auto, size.tiny, size.small, size.normal, size.large, size.huge])
ema1Value   = input(10)
ema2Value   = input(20)
ema3Value   = input(59)
maxLoss = input(3000)
ema1        = ema(close,ema1Value)
ema2        = ema(close,ema2Value)
ema3        = ema(close,ema3Value)
objcnt      = 0
buyTitle    = tostring(close[1])
myProfit    = float(0)

plot(ema1,title="ema1",color=color.red,linewidth=2)
plot(ema2,title="ema2",color=color.green,linewidth=2)
plot(ema3,title="ema3",color=color.black,linewidth=2)

Buytrend = (ema1 and ema2 > ema3) and (ema1[1] and ema2[1] > ema3[1])
BarssinceBuyTrend = barssince(Buytrend)
BarssinceSellTrend = barssince(not Buytrend)
closeAtBuyTrend = close[1]
bgcolor(Buytrend ? color.green : color.red,transp=70)

BuySignal = Buytrend and not Buytrend[1] and BuySellSignal_Bool

BuySignalOut = Buytrend and (crossunder(ema1,ema2)) and BuySellSignal_Bool
BarssinceBuy = barssince(BuySignal)
bgcolor(BuySignal ? color.green : na , transp=30)
bgcolor(BuySignalOut ? color.black : na , transp=30)
plot(BarssinceBuy,title="BarssinceBuy",display=display.none)


SellSignal = not Buytrend and Buytrend[1] and BuySellSignal_Bool
SellSignalOut = not Buytrend and (crossover(ema1,ema2)) and BuySellSignal_Bool
BarssinceSell = barssince(SellSignal)
bgcolor(SellSignal ? color.red : na , transp=30)
bgcolor(SellSignalOut ? color.black : na , transp=30)
plot(BarssinceSell,title="BarssinceSell",display=display.none)


buyProfit   = float(0)
cntBuy      =0
sellProfit  = float(0)
cntSell     =0
buyProfit   := Buytrend and not Buytrend[1]? nz(buyProfit[1]) + (close[BarssinceBuyTrend[1]]-close) : nz(buyProfit[1])
cntBuy      := Buytrend and not Buytrend[1]? nz(cntBuy[1]) + 1: nz(cntBuy[1])
sellProfit  := not Buytrend and Buytrend[1]? nz(sellProfit[1]) + (close-close[BarssinceSellTrend[1]]) : nz(sellProfit[1])
cntSell     := not Buytrend and Buytrend[1]? nz(cntSell[1]) + 1 : nz(cntSell[1])
totalProfit = buyProfit + sellProfit

// if (Buytrend and not Buytrend[1] and infoBox==true)
//     l = label.new(bar_index - (BarssinceBuyTrend[1]/2), na,text="Close = " + tostring(close) + "\n" + "Start = "+tostring(close[BarssinceBuyTrend[1]]) + "\n" + "Profit = "+tostring(close[BarssinceBuyTrend[1]]-close) ,style=label.style_labelup, yloc=yloc.belowbar,color=color.red,size=infoBoxSize)
// if (not Buytrend and Buytrend[1] and infoBox==true)
//     l = label.new(bar_index - (BarssinceSellTrend[1]/2), na,text="Close = " + tostring(close) + "\n" + "Start = "+tostring(close[BarssinceSellTrend[1]]) + "\n" + "Profit = "+tostring(close-close[BarssinceSellTrend[1]]) ,style=label.style_labeldown, yloc=yloc.abovebar,color=color.green,size=infoBoxSize)

// if (BuySignalOut and not BuySignalOut[1] and infoBox2==true)
// //    l = label.new(bar_index - (BarssinceBuy[0]/2), na,text="Close = " + tostring(close) + "\n" + "Start = "+tostring(close[BarssinceBuy[0]]) + "\n" + "Profit = "+tostring(close-close[BarssinceBuy[0]]) ,style=label.style_labelup, yloc=yloc.belowbar,color=color.purple,size=infoBoxSize
//     l = label.new(bar_index, na,text="Close = " + tostring(close) + "\n" + "Start = "+tostring(close[BarssinceBuy[0]]) + "\n" + "Profit = "+tostring(close-close[BarssinceBuy[0]]) ,style=label.style_labelup, yloc=yloc.belowbar,color=color.lime,size=infoBoxSize)
// if (SellSignalOut and not SellSignalOut[1] and infoBox2==true)
// //    l = label.new(bar_index - (BarssinceSell[0]/2), na,text="Close = " + tostring(close) + "\n" + "Start = "+tostring(close[BarssinceSell[0]]) + "\n" + "Profit = "+tostring(close[BarssinceSell[0]]-close) ,style=label.style_labeldown, yloc=yloc.abovebar,color=color.purple,size=infoBoxSize)
//     l = label.new(bar_index, na,text="Close = " + tostring(close) + "\n" + "Start = "+tostring(close[BarssinceSell[0]]) + "\n" + "Profit = "+tostring(close[BarssinceSell[0]]-close) ,style=label.style_labeldown, yloc=yloc.abovebar,color=color.fuchsia,size=infoBoxSize)


// l2 = label.new(bar_index, na, 'buyProfit in pip = '+tostring(buyProfit)+"\n"+  'cntBuy = '+tostring(cntBuy) +"\n"+  'sellProfit in pip = '+tostring(sellProfit)+"\n"+  'cntSell = '+tostring(cntSell) +"\n"+  'totalProfit in pip = '+tostring(totalProfit)     ,
//   color=totalProfit>0 ? color.green : color.red,
//   textcolor=color.white,
//   style=label.style_labeldown, yloc=yloc.abovebar,
//   size=size.large)

// label.delete(l2[1])


//--------------------------------------------------
//--------------------------------------------------
if (Buytrend)
    strategy.close("short", comment = "Exit short")
    strategy.entry("long", true)
    strategy.exit("Max Loss", "long", loss = maxLoss)

//if BuySignalOut
   // strategy.close("long", comment = "Exit Long")
if (not Buytrend)
    // Enter trade and issue exit order on max loss.
    strategy.close("long", comment = "Exit Long")
    strategy.entry("short", false)
    strategy.exit("Max Loss", "short", loss = maxLoss)
//if SellSignalOut
    // Force trade exit.
    //strategy.close("short", comment = "Exit short")

//--------------------------------------------------
//--------------------------------------------------
//--------------------------------------------------
Detail
https://www.fmz.com/strategy/441082
Last Modified
2024-02-05 14:21:18