Name
基于Fibonacci水平的日内高低价突破Breakthrough-of-Daily-High-low-Price-Based-on-Fibonacci-Levels
Author
ChaoZhang
Strategy Description
该策略通过计算每日的最高价和最低价,结合斐波那契回撤水平,寻找在当前交易日内进行突破的交易机会。当价格上涨突破当日最高价时,采取看涨策略;当价格下跌突破 当日最低价时,采取看跌策略。
该策略的核心逻辑如下:
-
每天开盘时,记录当日的最高价dayHigh和最低价dayLow。
-
计算0.236和0.786两个Fibonacci回撤水平:
fib236High = dayLow + 0.236 * (dayHigh - dayLow)
fib786High = dayLow + 0.786 * (dayHigh - dayLow) -
如果收盘价上涨突破dayHigh,则生成买入信号;如果收盘价下跌突破dayLow,则生成卖出信号。
-
根据买入和卖出信号,采取相应的看涨或看跌策略。
该策略巧妙地结合最高价、最低价和Fibonacci水平,在日内突破出现时寻找交易机会,属于趋势追踪策略的一种,可以捕捉中间盘段出现的趋势反转。
该策略主要具有以下优势:
-
日内操作频率高,可以抓住中间盘段的价格突破。
-
结合Fibonacci回撤具有一定的技术指标支持,不是简单追高抄底。
-
采用最高价和最低价作为参考位,有一定的支持力量。
-
交易逻辑简单清晰,容易理解实现,适合量化交易。
-
可配置展示最高价、最低价及Fibonacci水平,便于视觉分析。
该策略也存在一些风险:
-
日内操作频繁,可能增加交易成本和滑点风险。
-
日内突破可能是假突破,存在得到多头空头错误信号的风险。
-
没有止损逻辑,存在亏损扩大的风险。
-
纯粹技术指标驱动,没有结合基本面分析。
对策:
-
适当调整位置 size,降低成本影响。
-
结合更多技术指标过滤信号,避免假突破。
-
增加移动止损策略,控制单笔亏损。
-
结合基本面数据,避免行情反转打击。
该策略的主要优化方向:
-
增加多种技术指标的组合,提高信号的可靠性。
-
加入自动止损策略,控制亏损。
-
优化买卖策略参数,调整仓位管理。
-
在高频因子基础上,结合波动率、量比等过滤信号。
-
利用机器学习方法寻找更优参数组合。
-
建立动态退出机制,而不是简单穿越最高或最低。
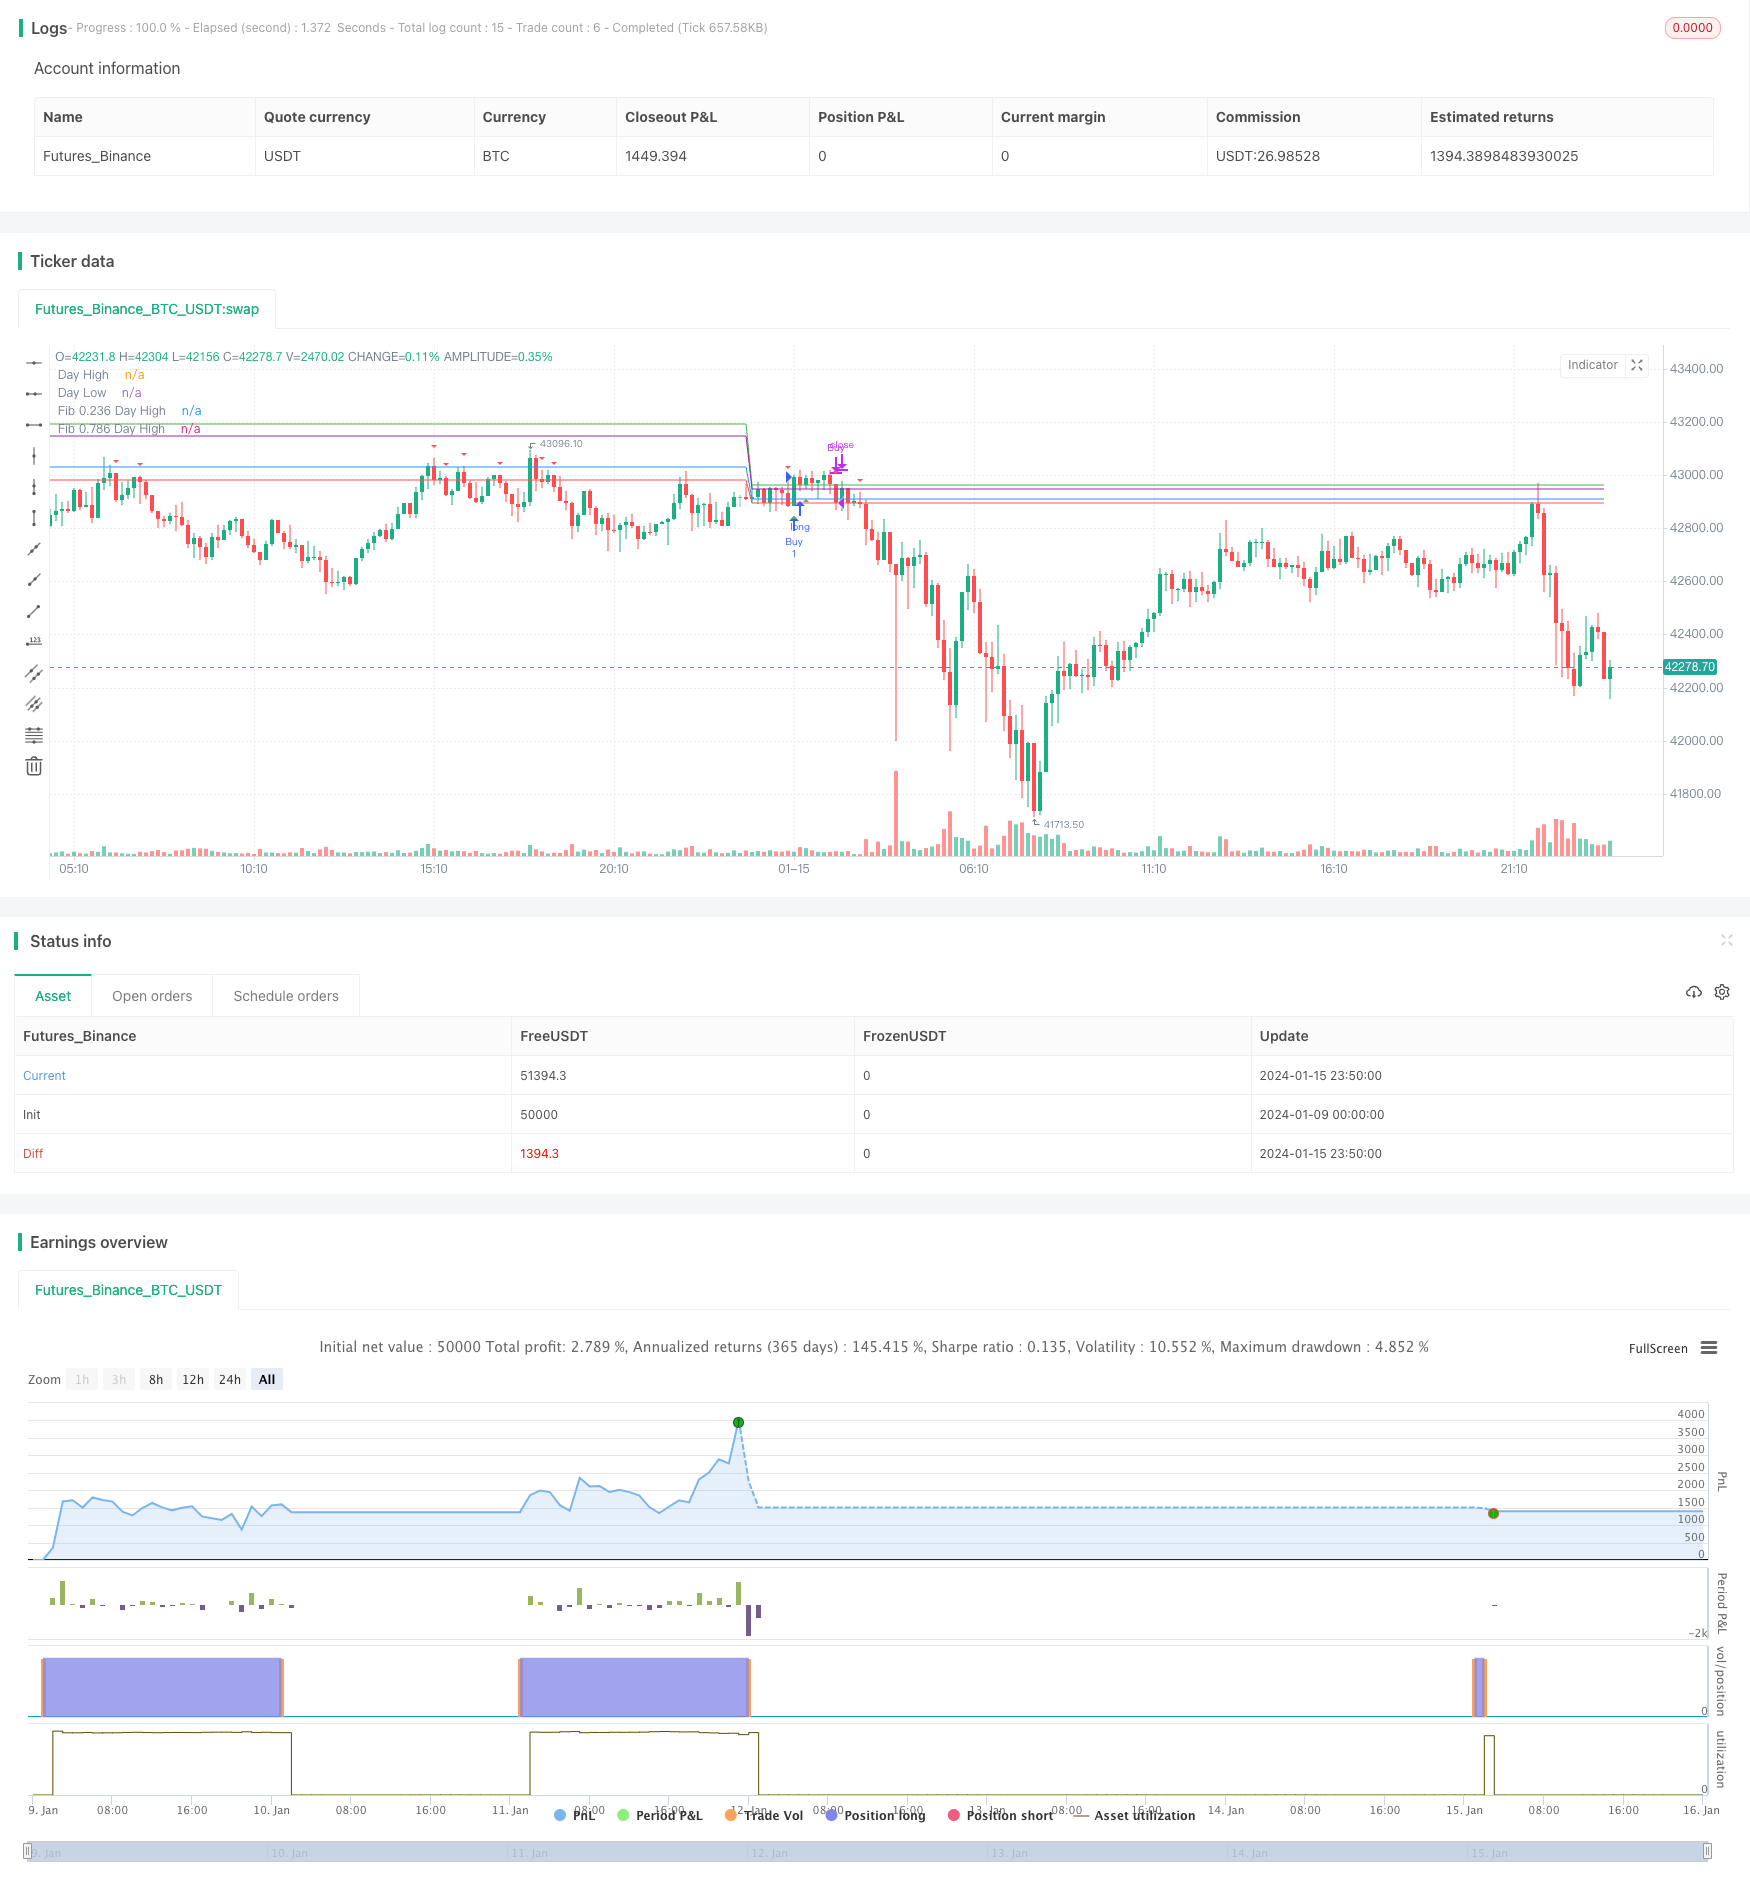
该日内高低价挤压Fibonacci策略,整体较为简单,通过抓住价位短线的突破来获利。策略优化空间较大,可从指标优化、止损管理、参数调整等多个角度进行改进,使其成为稳定盈利的高频日内策略。
||
This strategy calculates the highest and lowest prices of each day, combined with Fibonacci retracement levels, to find breakthrough trading opportunities within the current trading day. When the price breaks through the highest price of the day, take a bullish strategy; when the price breaks through the lowest price of the day, take a bearish strategy.
The core logic of this strategy is as follows:
-
Record the highest price dayHigh and the lowest price dayLow of the day at market open each day.
-
Calculate two Fibonacci retracement levels of 0.236 and 0.786:
fib236High = dayLow + 0.236 * (dayHigh - dayLow)
fib786High = dayLow + 0.786 * (dayHigh - dayLow) -
If the closing price breaks through dayHigh upwards, a buy signal is generated; if the closing price breaks through dayLow downwards, a sell signal is generated.
-
Take corresponding bullish or bearish strategies according to buy and sell signals.
This strategy ingeniously combines the highest price, the lowest price and Fibonacci levels to find trading opportunities when breakthroughs occur during the day. It is a kind of trend tracking strategy that can capture trend reversals during the midday trading session.
The main advantages of this strategy are:
-
High intraday trading frequency to capture price breakthroughs during midday trading sessions.
-
With certain technical indicator support of Fibonacci retracement, it is not simply chasing new highs or new lows.
-
Using the highest and lowest prices as reference levels has some supporting strength.
-
The trading logic is simple and clear, easy to understand and implement, suitable for quantitative trading.
-
Displaying the highest price, lowest price and Fibonacci levels is configurable for visual analysis.
There are also some risks to this strategy:
-
Frequent intraday operations may increase transaction costs and slippage risks.
-
Intraday breakthroughs may be false breakouts, with the risk of getting wrong bullish or bearish signals.
-
There is no stop loss logic, with the risk of expanding losses.
-
It is purely technically driven without combining fundamental analysis.
Countermeasures:
-
Adjust position size appropriately to reduce cost impact.
-
Combine more technical indicators to filter out false breakout signals.
-
Increase moving stop loss strategies to control single loss.
-
Combine fundamental data analysis to avoid impacts of market reversals.
The main optimization directions for this strategy:
-
Increase the combination of multiple technical indicators to improve signal reliability.
-
Add automatic stop loss strategies to control losses.
-
Optimize buy and sell strategy parameters, adjust position management.
-
Based on high frequency factors, combine volatility, volume ratio and other filtering signals.
-
Use machine learning methods to find better parameter combinations.
-
Establish a dynamic exit mechanism, rather than a simple crossover of highest or lowest prices.
This intraday high-low price squeeze Fibonacci strategy is relatively simple, profiting by capturing short-term breakthroughs of price levels. There is large room for strategy optimization in areas like indicator optimization, stop loss management, parameter adjustment to make it a stable profitable high frequency intraday strategy.
[/trans]
Strategy Arguments
| Argument | Default | Description |
|---|---|---|
| v_input_1 | true | Show Day High/Low Lines |
| v_input_2 | true | Show Fibonacci Levels |
Source (PineScript)
/*backtest
start: 2024-01-09 00:00:00
end: 2024-01-16 00:00:00
period: 10m
basePeriod: 1m
exchanges: [{"eid":"Futures_Binance","currency":"BTC_USDT"}]
*/

//@version=4
strategy("Day High/Low Fibonacci Levels Strategy", shorttitle="DHL Fibonacci", overlay=true)

// Calculate the day's high and low
var float dayHigh = na
var float dayLow = na
if change(time("D"))
    dayHigh := high
    dayLow := low

// Define input for plotting lines
showLines = input(true, title="Show Day High/Low Lines")
showFibLevels = input(true, title="Show Fibonacci Levels")

// Plot the day's high and low as lines
plot(showLines ? dayHigh : na, color=color.green, style=plot.style_line, linewidth=1, title="Day High")
plot(showLines ? dayLow : na, color=color.red, style=plot.style_line, linewidth=1, title="Day Low")

// Calculate buy and sell conditions
buyCondition = crossover(close, dayHigh)
sellCondition = crossunder(close, dayLow)

// Plot buy and sell signals
plotshape(buyCondition, style=shape.triangleup, location=location.belowbar, color=color.green, size=size.small, title="Buy Signal")
plotshape(sellCondition, style=shape.triangledown, location=location.abovebar, color=color.red, size=size.small, title="Sell Signal")

// Calculate Fibonacci levels for the day's high and low
fib236High = dayLow + (0.236 * (dayHigh - dayLow))
fib786High = dayLow + (0.786 * (dayHigh - dayLow))

// Plot Fibonacci levels
plot(showFibLevels ? fib236High : na, color=color.blue, style=plot.style_line, linewidth=1, title="Fib 0.236 Day High")
plot(showFibLevels ? fib786High : na, color=color.purple, style=plot.style_line, linewidth=1, title="Fib 0.786 Day High")

// Strategy
strategy.entry("Buy", strategy.long, when=buyCondition)
strategy.close("Buy", when=sellCondition)
Detail
https://www.fmz.com/strategy/439083
Last Modified
2024-01-17 15:59:17