Name
基于MACD和RSI的趋势追踪交易策略Trend-Following-Trading-Strategy-Based-on-MACD-and-RSI
Author
ChaoZhang
Strategy Description
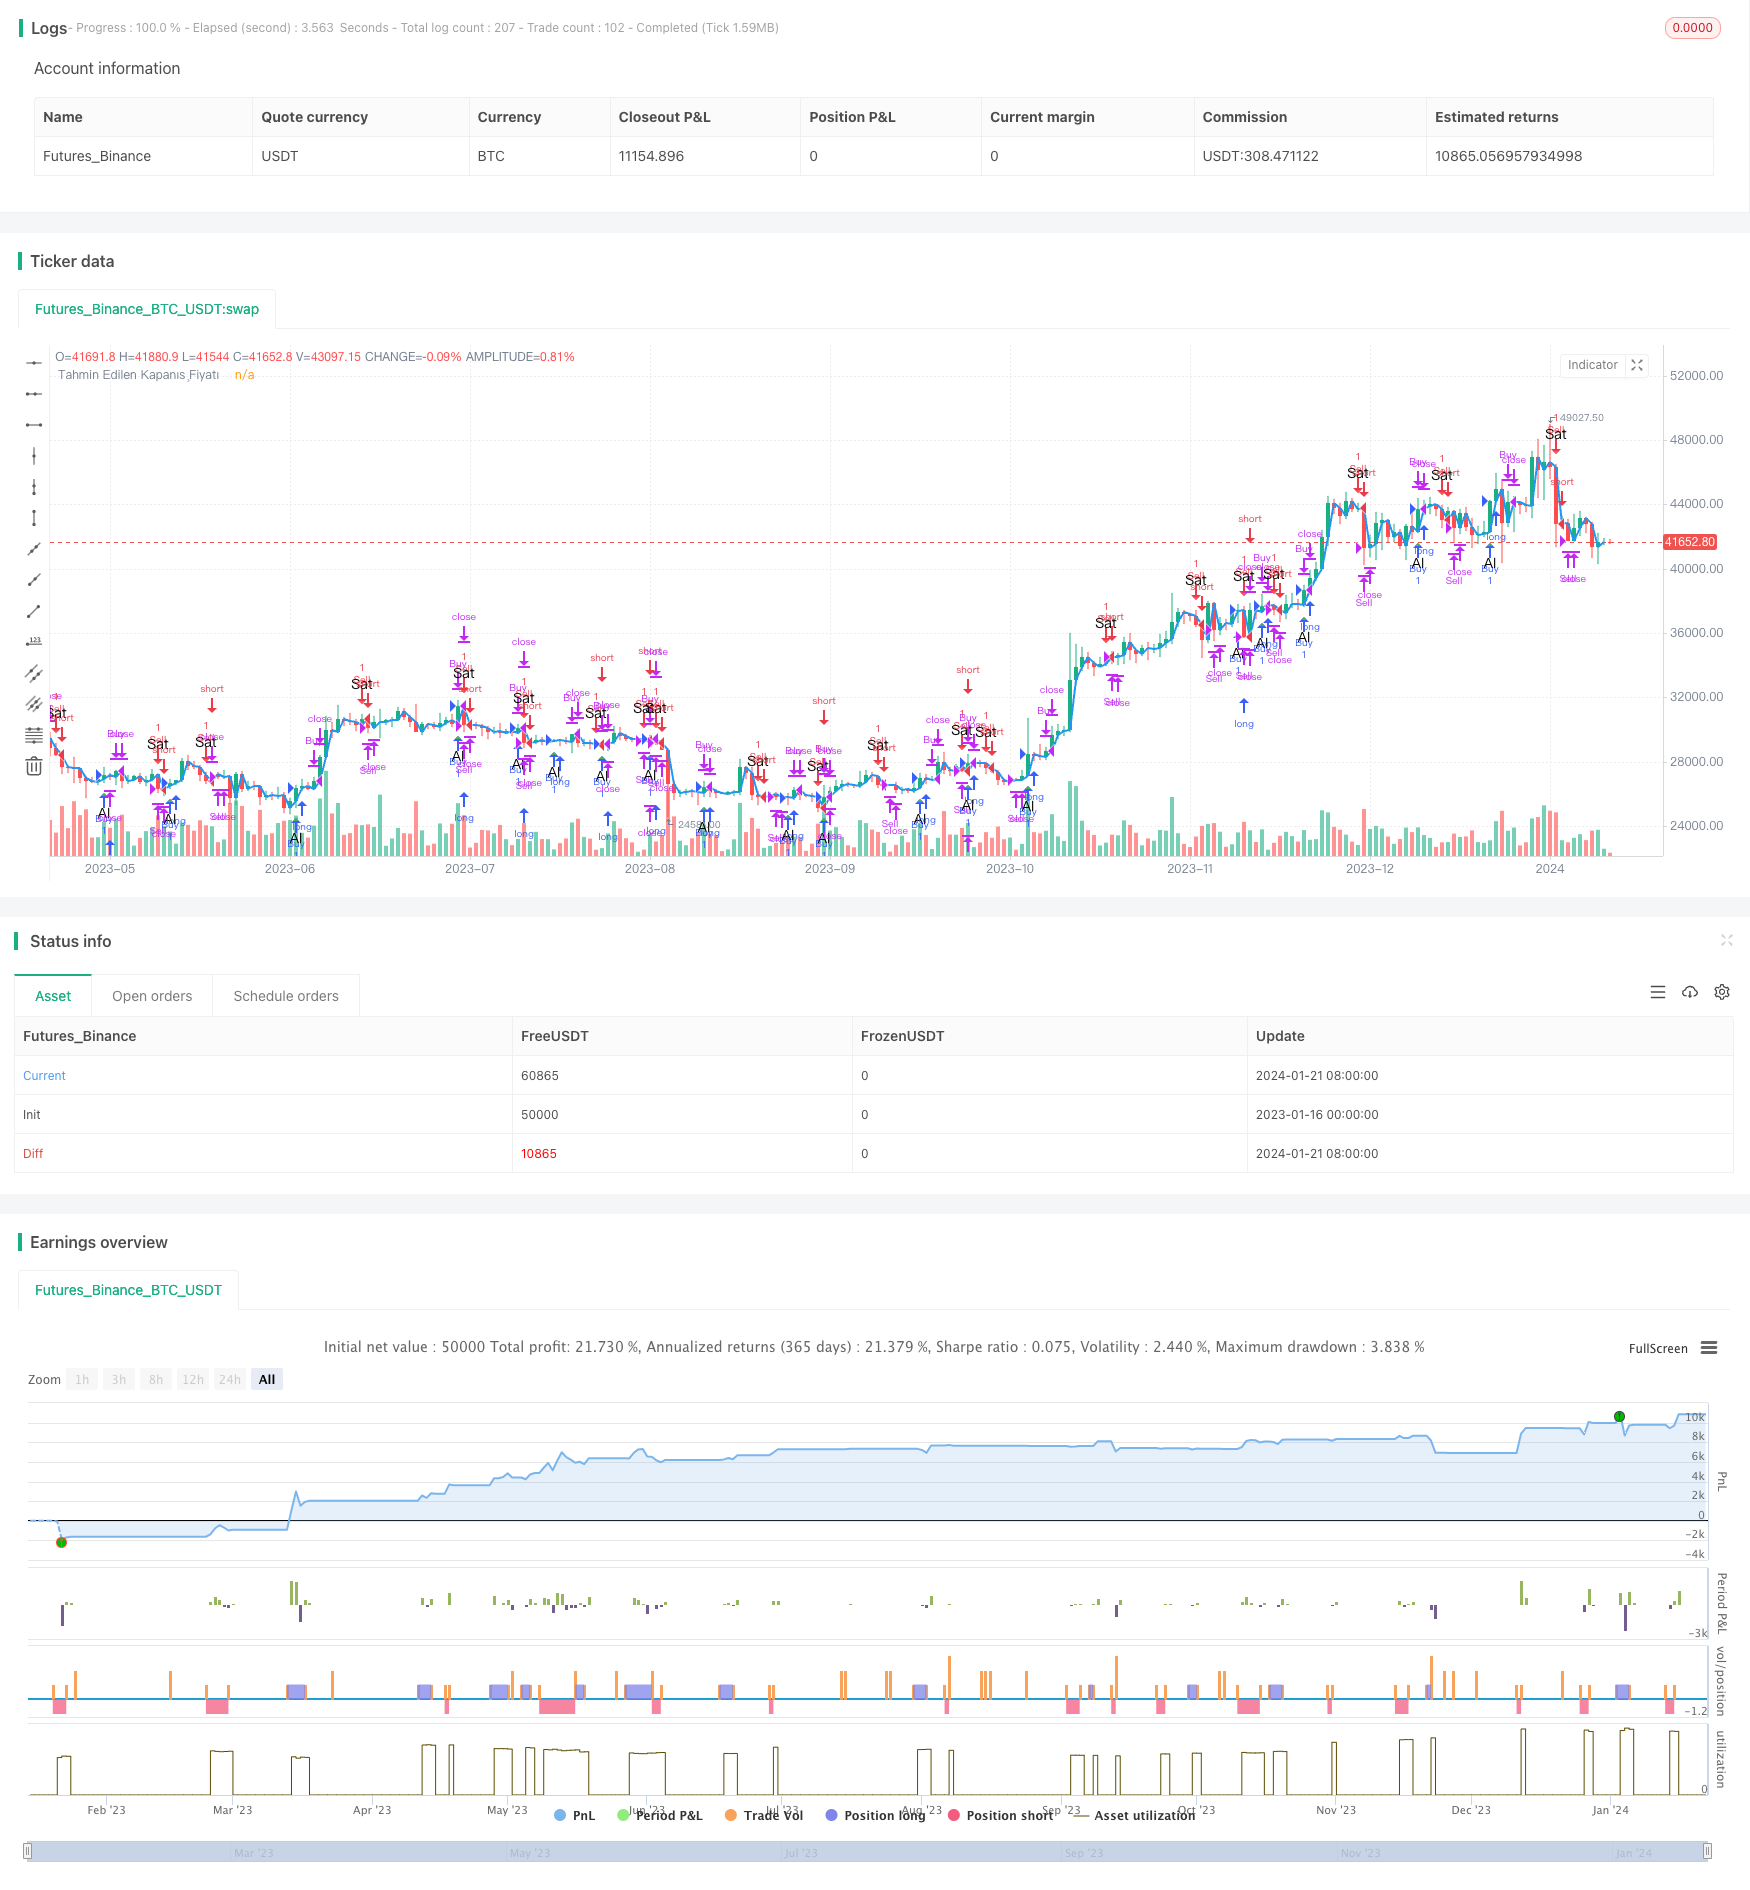
本策略通过计算 MACD 和 RSI 指标,结合趋势和超买超卖过滤,实现趋势追踪交易。该策略适用于中长线交易,可以有效过滤假突破,确认趋势方向,在趋势发展初期建立头寸,随后利用追踪止损等方法锁定利润。
该策略主要基于 MACD 和 RSI 两个指标进行交易信号生成。
MACD 即移动平均线差指标,它由差离值(DIF)、信号线(DEA)和背离柱组成。本策略中,DIFF为5日指数移动平均线和13日指数移动平均线的差值,DEA 为DIFF的5日指数移动平均线。当DIFF上穿DEA时产生买入信号,下穿时产生卖出信号。
RSI指相对强弱指数,它通过比较一段时期内的平均收盘上涨天数和平均收盘下跌天数的比值,来判断市场是超买还是超卖。本策略中,RSI周期设置为14。RSI大于70时为超买区,小于30时为超卖区。
结合MACD交易信号和RSI过滤信号,当MACD产生买入信号而RSI未进入超买区时,做多;当MACD产生卖出信号而RSI未进入超卖区时,做空。
此外,本策略还会判断当前K线是否与前一根K线颜色不同,如果相同则跳过该交易信号,这个设计主要是为了过滤假突破。
在入市后,策略会判断下一根K线的收盘价是否高于/低于开盘价,如果条件满足,则证明趋势得到验证,此时平仓止盈。
- 利用MACD交易信号和RSI过滤,可以有效定位趋势的发展方向,避免假突破造成不必要的损失
- 追踪止损设计锁定利润,避免回吐给账户带来损失
- 结合趋势性指标和超买超卖指标,实现了趋势追踪和逆市避险
该策略主要存在以下风险:
-
MACD交易信号可能产生较多噪音,导致过于频繁交易。解决方法是适当调整MACD的参数,平滑曲线。
-
RSI过滤器设置不当可能导致错过交易机会。解决方法是测试更合适的RSI参数。
-
追踪止损设置不当可能过早止损或止损幅度太大。解决方法是根据市场波动率和个人风险偏好调整止损幅度。
-
短期内价格剧烈波动可能导致巨额亏损。解决方法是利用期权或其他金融工具进行避险。
该策略可以从以下几个方面进行优化:
-
优化MACD参数,平滑MACD曲线,降低噪音信号
-
优化或改进RSI过滤器,提高 FILTER 效果
-
尝试其他指标确认信号,如KD、布林带等
-
优化止损策略,实现动态跟踪止损
-
利用机器学习等方法进行参数优化
-
结合股指期货、期权等工具进行套期保值
本策略综合运用MACD指标和RSI指标,实现了趋势判断、超买超卖过滤和止损追踪,可有效控制交易风险。该策略可优化空间较大,通过参数调整、新指标引入等手段可望获得更佳交易效果。
||
This strategy calculates the MACD and RSI indicators to identify trend directions and overbought/oversold situations for trend following trading. It is suitable for medium-to-long term trading, filtering out false breakouts effectively and establishing positions at early trend development, locking in profits later with trailing stop loss.
The strategy mainly utilizes the MACD and RSI indicators to generate trading signals.
MACD stands for Moving Average Convergence Divergence. It consists of the DIFF line, DEA line and histogram. In this strategy, DIFF is the difference between 5-day EMA and 13-day EMA of the closing price, while DEA is the 5-day EMA of DIFF. The buy and sell signals are generated when DIFF crosses above and below DEA respectively.
RSI stands for Relative Strength Index. It reflects overbought/oversold situations by comparing the average gains and losses over a period. This strategy sets the RSI period as 14. RSI above 70 suggests overbought conditions while below 30 oversold.
By combining the MACD trading signals and RSI filters, the strategy goes long when MACD gives buy signals and RSI is not overbought. It goes short when MACD sells and RSI not oversold.
In addition, the strategy checks if the current bar's color differs from the previous one, skipping the signal if same color to avoid false breakout.
After entry, the strategy anticipates the next bar's closing price to be higher/lower than open price to validate the trend, closing position for profit if the condition is met.
- MACD signals and RSI filters effectively locate trend direction, avoiding unnecessary losses from false breakouts
- The trailing stop loss design locks in profits, preventing pullbacks from erasing gains
- The integration of trending and oscillating indicators realizes both trend following and reversal prevention
The main risks of this strategy include:
-
MACD may generate excessive noise and lead to over-trading. Solution: Optimize MACD parameters to smooth the curve.
-
Improper RSI filter settings may cause missing trades. Solution: Test more appropriate RSI periods.
-
Improper stop loss placement may stop out prematurely or too loosely. Solution: Adjust based on market volatility and personal risk preference.
-
Extreme price swings may result in huge losses in short term. Solution: Hedge with options or other instruments.
The strategy can be improved in the following aspects:
-
Optimize MACD parameters to reduce noisy signals
-
Enhance RSI filter for better effectiveness
-
Test other confirming indicators like KD, Bollinger Bands etc
-
Implement dynamic trailing stop loss
-
Utilize machine learning for parameter optimization
-
Incorporate stock index futures, options for hedging
This strategy combines MACD and RSI for trend identification, overbought/oversold filtering and trailing stop loss, effectively controlling trading risks. Much room remains for improving performance by parameter tuning, new indicator adoption etc.
[/trans]
Source (PineScript)
/*backtest
start: 2023-01-16 00:00:00
end: 2024-01-22 00:00:00
period: 1d
basePeriod: 1h
exchanges: [{"eid":"Futures_Binance","currency":"BTC_USDT"}]
*/

//@version=5
strategy("Al-Sat Sinyali ve Teyidi", overlay=true)

// MACD (Hareketli Ortalama Yakınsaklık Sapma)
[macdLine, signalLine, _] = ta.macd(close, 5, 13, 5)

// RSI (Göreceli Güç Endeksi)
rsiValue = ta.rsi(close, 14)

// RSI Filtresi
rsiOverbought = rsiValue > 70
rsiOversold = rsiValue < 30

// MACD Sinyalleri
buySignalMACD = ta.crossover(macdLine, signalLine) and not rsiOverbought
sellSignalMACD = ta.crossunder(macdLine, signalLine) and not rsiOversold

// Al-Sat Stratejisi
if (buySignalMACD and close[1] != close) // Al sinyali ve bir önceki mumdan farklı renkte ise
    strategy.entry("Buy", strategy.long)

if (sellSignalMACD and close[1] != close) // Sat sinyali ve bir önceki mumdan farklı renkte ise
    strategy.entry("Sell", strategy.short)

// Teyit için bir sonraki mumu bekleme
strategy.close("Buy", when=ta.crossover(close, open))
strategy.close("Sell", when=ta.crossunder(close, open))

// Varsayımsal bir sonraki mumun kapanış fiyatını hesapla
nextBarClose = close[1]
plot(nextBarClose, color=color.blue, linewidth=2, title="Tahmin Edilen Kapanış Fiyatı")

// Görselleştirmeyi devre dışı bırakma
plot(na)

// Al-Sat Etiketleri
plotshape(series=buySignalMACD, title="Al Sinyali", color=color.green, style=shape.triangleup, location=location.belowbar, size=size.small, text="Al")
plotshape(series=sellSignalMACD, title="Sat Sinyali", color=color.red, style=shape.triangledown, location=location.abovebar, size=size.small, text="Sat")
Detail
https://www.fmz.com/strategy/439717
Last Modified
2024-01-23 12:03:23