Name
基于MACD指标的Histogram进行交易决策策略This-strategy-makes-trading-decisions-based-on-the-trend-of-MACD-Histogram
Author
ChaoZhang
Strategy Description
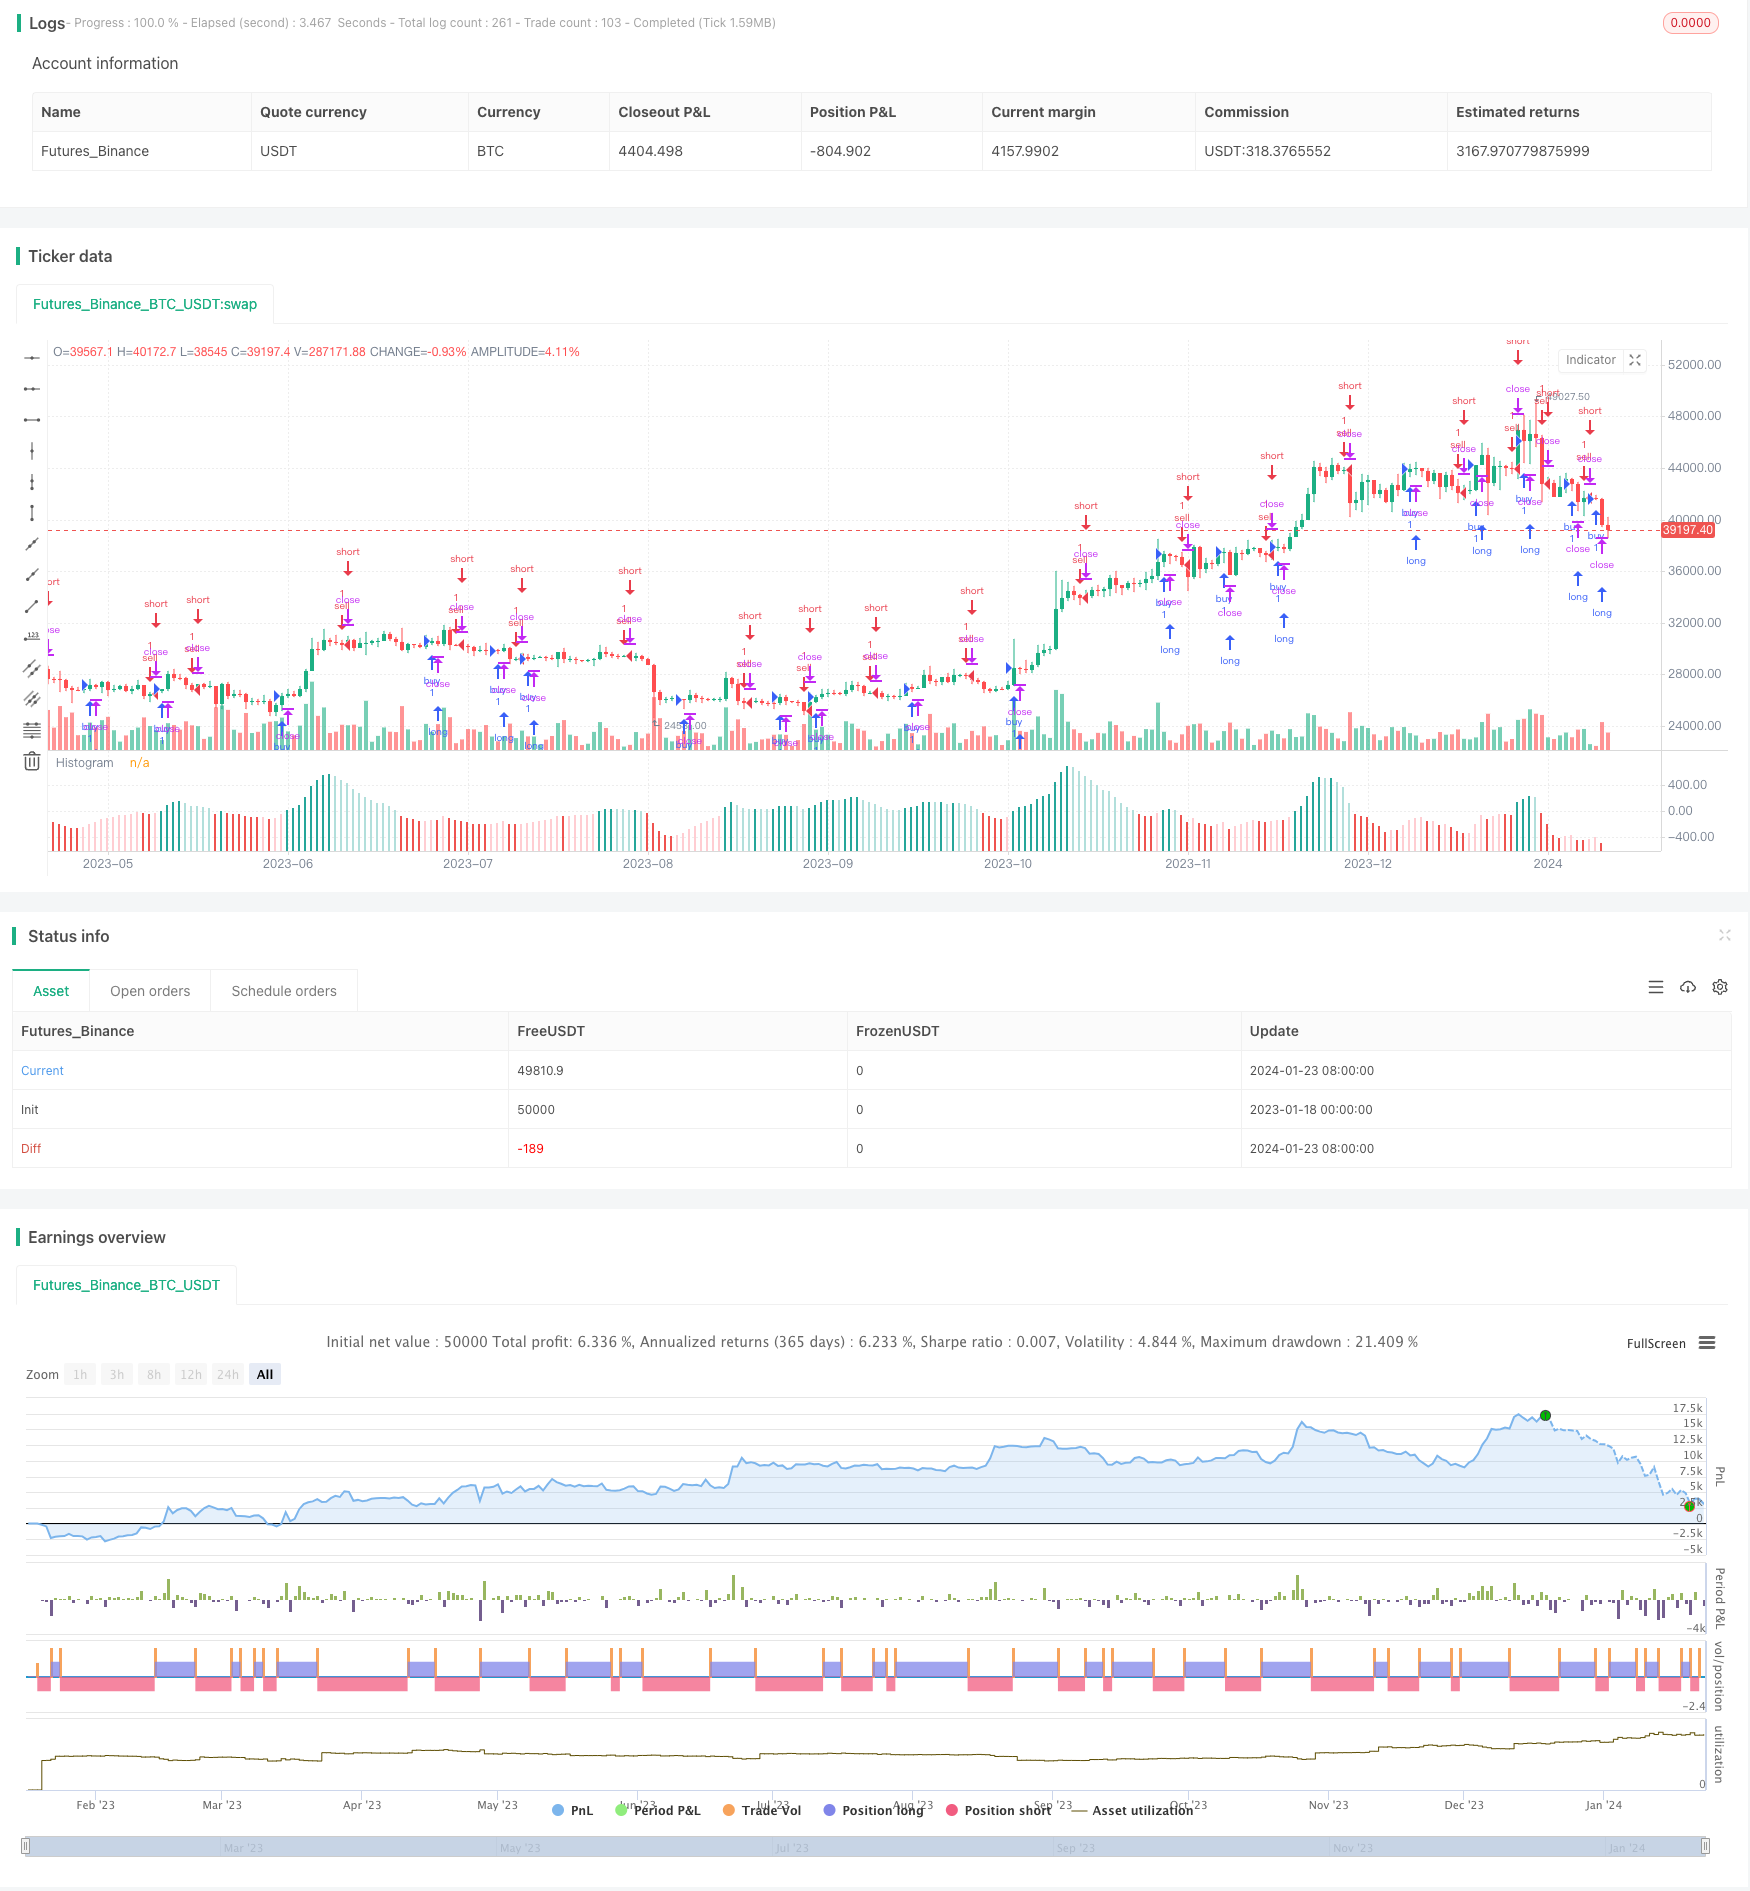
该策略基于MACD指标的Histogram进行交易决策。它利用Histogram的上升趋势和下降趋势来产生买入和卖出信号。当Histogram连续上升或下降达到一定周期后,产生相应的信号。
该策略使用MACD指标的快线、慢线和Histogram。首先计算快线EMA和慢线EMA。然后快线减去慢线得到MACD,MACD再减去其移动平均线Signal得到Histogram。
当Histogram连续上升趋势达到设定的周期后,产生买入信号。这表示MACD正在加速向上突破其信号线,预测价格可能上涨。
当Histogram连续下降趋势达到设定的周期后,产生卖出信号。这表示MACD正在加速向下跌破其信号线,预测价格可能下跌。
该策略具有以下优势:
-
利用MACD Histogram的趋势性,能抓住价格变化的转折点,增强获利概率。
-
结合Histogram连续上升或下降的周期条件,可以过滤掉部分噪音交易,减少不必要的损失。
-
允许自定义MACD参数和Histogram趋势周期,可以调整来适应不同品种和交易时段。
-
策略逻辑简单清晰,容易理解和修改,也方便与其他指标或策略组合使用。
该策略也存在一些风险:
-
当价格处于震荡区间时,可能产生错误信号,需要结合趋势指标等过滤。
-
Histogram上升或下降后,MACD线可能无法突破信号线,无法获利退出,需要设置止损来控制风险。
-
未考虑交易成本和滑点等实际交易问题,实盘时收益可能会减少。
-
参数设置(如MACD周期、Histogram趋势周期等)不当可能导致策略效果变差,需要针对品种和时段优化。
可以通过与趋势指标组合、设置止损机制、优化参数等方法来控制和减少这些风险。
该策略可以从以下几个方向进行优化:
-
结合其他指标判断大致趋势方向,避免交易震荡区间。例如20日线判断中长线趋势等。
-
增加止损机制。例如MACD重新跌破信号线时止损。
-
优化MACD参数,适应不同周期的品种。例如对高频数据可以缩短周期参数。
-
优化Histogram连续上升或下降的最小周期数,平衡信号频繁程度与可靠性。
-
尝试Breakout失败后追踪信号的策略逻辑。即 Histogram反转后再追踪反向信号。
-
与其他指标组合,例如量能指标、波动率指标等判断市场热度,过滤信号。
该MACD Histogram Trend策略通过捕捉Histogram趋势变化,实现 对价格变化转折点的判断。结合参数优化和组合指标判断,可以有效滤掉错误信号。MACD Histogram作为一个量化交易中非常重要的辅助判断工具,该策略提供了一种简单实用的交易思路。
||
This strategy makes trading decisions based on the trend of MACD Histogram. It utilizes the upward and downward trends of Histogram to generate buy and sell signals. When the Histogram continues to rise or fall for a certain period, corresponding signals are generated.
The strategy uses the fast line, slow line and Histogram of the MACD indicator. First calculate the fast EMA and slow EMA. Then subtract slow EMA from fast EMA to get MACD, and subtract Signal which is the moving average of MACD to get Histogram.
When the Histogram continues to rise for the set period, a buy signal is generated. This indicates that MACD is accelerating to break through its signal line upward, predicting that prices may rise.
When the Histogram continues to decline for the set period, a sell signal is generated. This indicates that MACD is accelerating to break through its signal line downward, predicting that prices may fall.
The strategy has the following advantages:
-
Utilizing the trending characteristic of MACD Histogram, it can capture the turning points of price changes and enhance profitability.
-
Combining with the condition of consecutive rise or fall of Histogram, some noisy trades can be filtered out to reduce unnecessary losses.
-
Allowing customization of MACD parameters and Histogram trend period, it can be adjusted to suit different products and trading sessions.
-
The strategy logic is simple and clear, easy to understand and modify, and also convenient to combine with other indicators or strategies.
The strategy also has some risks:
-
Wrong signals may occur when prices are oscillating in range. Trend indicators need to be combined to filter.
-
After Histogram rises or falls, MACD line may fail to break through the signal line, unable to profitably exit. Stop loss should be set to control risk.
-
Trading cost and slippage are not considered. Actual profit may decrease in live trading.
-
Improper parameter settings (e.g. MACD period, Histogram trend period) may worsen strategy performance. Parameters need to be optimized for products and sessions.
These risks can be controlled and reduced through methods like combining with trend indicators, setting stop loss mechanism, optimizing parameters etc.
The strategy can be optimized in the following aspects:
-
Combine other indicators to determine overall trend direction, avoiding trading in oscillating ranges. E.g. 20-day line for medium-long term trend.
-
Add stop loss mechanism. E.g. stop loss when MACD re-breaks signal line downwards.
-
Optimize MACD parameters to suit products of different frequencies. E.g. shorten period parameters for high-frequency data.
-
Optimize minimum period of consecutive Histogram rise or fall, balancing signal frequency and reliability.
-
Try logic of trailing signals after breakout failure. I.e. trailing reverse signal after Histogram reversal.
-
Combine other indicators like volume or volatility indicators to gauge market heat and filter signals.
In conclusion, the MACD Histogram Trend strategy realizes judgment of price change turning points by capturing Histogram trend changes. Combining parameter optimization and combo indicators can effectively filter out wrong signals. As an important auxiliary judgment tool in quantitative trading, this strategy provides a simple and practical trading idea using MACD Histogram.
[/trans]
Strategy Arguments
| Argument | Default | Description |
|---|---|---|
| v_input_1 | 2017 | Year |
| v_input_2 | 12 | Fast Length |
| v_input_3 | 26 | Slow Length |
| v_input_4 | true | Trend of Histogram Number |
| v_input_5_close | 0 | Source: close |
| v_input_6 | 9 | Signal Smoothing |
| v_input_7 | false | Simple MA(Oscillator) |
| v_input_8 | false | Simple MA(Signal Line) |
Source (PineScript)
/*backtest
start: 2023-01-18 00:00:00
end: 2024-01-24 00:00:00
period: 1d
basePeriod: 1h
exchanges: [{"eid":"Futures_Binance","currency":"BTC_USDT"}]
*/

//@version=4
//study(title="Histogram Strategy by Sedkur", shorttitle="Histogram Strategy by Sedkur")
strategy (title="Histogram Trends Strategy by Sedkur", shorttitle="Histogram Trends Strategy by Sedkur")


/// Getting inputs
dyear = input(title="Year", type=input.integer, defval=2017, minval=1950, maxval=2500)
fast_length = input(title="Fast Length", type=input.integer, defval=12)
slow_length = input(title="Slow Length", type=input.integer, defval=26)
hist_length = input(title="Trend of Histogram Number", type=input.integer, defval=1, minval=1, maxval=100)
//buyh = input(title="Buy histogram value", type=input.float, defval=0.0, minval=-1000, maxval=1000, step=0.1)
//sellh = input(title="Sell histogram value", type=input.float, defval=0.0, minval=-1000, maxval=1000, step=0.1)
src = input(title="Source", type=input.source, defval=close)
signal_length = input(title="Signal Smoothing", type=input.integer, minval = 1, maxval = 50, defval = 9)
sma_source = input(title="Simple MA(Oscillator)", type=input.bool, defval=false)
sma_signal = input(title="Simple MA(Signal Line)", type=input.bool, defval=false)

// Plot colors
col_grow_above = #26A69A
col_grow_below = #FFCDD2
col_fall_above = #B2DFDB
col_fall_below = #EF5350
col_macd = #0094ff
col_signal = #ff6a00

/// Calculating
fast_ma = sma_source ? sma(src, fast_length) : ema(src, fast_length)
slow_ma = sma_source ? sma(src, slow_length) : ema(src, slow_length)
macd = fast_ma - slow_ma
signal = sma_signal ? sma(macd, signal_length) : ema(macd, signal_length)
hist = macd - signal

plot(hist, title="Histogram", style=plot.style_columns, color=(hist>=0 ? (hist[1] < hist ? col_grow_above : col_fall_above) : (hist[1] < hist ? col_grow_below : col_fall_below) ), transp=0 )
//plot(macd, title="MACD", color=col_macd, transp=0)
//plot(signal, title="Signal", color=col_signal, transp=0)

//bullish = hist[1] <= hist and buyh<=hist?true:false
//bearish = hist[1] >= hist and sellh>=hist?true:false
bull=0
bear=0


for i=0 to hist_length
    if (hist[i+1] <= hist[i])
        bull:=bull+1
bullish = bull==hist_length+1?true:false

for j=0 to hist_length
    if (hist[j+1] >= hist[j])
        bear:=bear+1
bearish = bear==hist_length+1?true:false


//bullish = hist[1] <= hist and hist[2] <= hist and hist[3] <= hist and hist[4] <= hist and hist[5] <= hist?true:false
//bearish = hist[1] >= hist and hist[2] >= hist and hist[3] >= hist and hist[4] >= hist and hist[5] >= hist?true:false

strategy.entry("buy", strategy.long, comment="buy", when = bullish and year>=dyear)
strategy.entry("sell", strategy.short, comment="sell", when = bearish and year>=dyear)
Detail
https://www.fmz.com/strategy/439978
Last Modified
2024-01-25 14:31:57