Name
基于RSI和EMA的趋势跟踪策略RSI-and-EMA-Based-Trend-Following-Strategy
Author
ChaoZhang
Strategy Description
本策略通过结合相对强弱指数(RSI)和指数移动平均线(EMA)这两个技术指标,实现了一个基于趋势跟踪的量化交易策略。该策略主要适用于趋势性市场,通过在识别到价格可能反转的时机进场,跟踪趋势获利。
- EMA用于判断当前趋势方向。策略中使用了20日线、50日线和200日线三条EMA。当价格高于这三条EMA时,我们判断目前处于牛市趋势。
- RSI用于判断是否处于超买超卖状态。标准参数14的RSI,超买线为70,超卖线为30。
看涨入场信号:
- RSI低于30阈值,表示处于超卖状态,价格可能反弹上涨
- 价格高于20日线、50日线、200日线中的任意一条,表示目前处于趋势向上阶段
当同时满足以上两个条件时,我们做多入场。
每一笔交易,我们限制最大可能损失为账户净值的3%。具体设置Stop Loss点的位置需要结合市场的特点。
入场时计算持仓规模:最大损失额/(入场价 - Stop Loss价) = 持仓规模
这样可有效控制单笔交易的风险。
平仓信号主要有以下几种情况:
- RSI超过70阈值,表明股价可能因超买而下跌
- 价格下破20日线、50日线或200日线的任意一条,表示趋势反转
满足以上条件时我们平仓离场。
该策略结合了趋势跟踪和反转交易的优点。通过EMA判断大趋势方向,再在超卖区反转的时机进场,既可以跟踪趋势又有反转的机会,增强策略稳定性。同时,RSI指标的参数可调,可以针对不同市场进行优化,适应性强。
风险控制方面,每笔交易限制最大损失,可以有效控制单笔交易的风险,保护账户资金。
该策略主要适合趋势性比较明显的市场,如果遇到复杂多变的市场,使用EMA判断趋势效果可能会打折扣。此外,RSI指标存在一定的滞后,需要结合价格实际走势进行分析。
停损点的设置对策略的盈亏很关键,需要根据不同市场谨慎测试来设定。如果停损点设定过大,单笔损失可能扩大;如果停损点过小,可能被市场噪音止损。这方面需要实盘观察来不断优化。
可以尝试优化RSI的参数,适应更多市场环境。可以测试不同的持仓规模比例,找到最优的设置。可以测试加入其他技术指标,构建更稳健的入场和出场系统。这些都是可以尝试的优化方向。
该策略整合趋势跟踪和反转交易的优点,在判断大趋势的同时,在可能反转点进入市场。运用RSI等指标参数的优化,可以适应更多市场环境。每笔交易风险可控,适合中长期稳定运营。同时策略可进一步优化,根据不同市场和风格进行调整测试。
||
This strategy combines the Relative Strength Index (RSI) and Exponential Moving Average (EMA) technical indicators to implement a quantitative trading strategy based on trend following. It is mainly suitable for trending markets, entering when price reversals are identified to profit from the trend.
- EMA to determine current trend direction. The strategy uses 20-day, 50-day and 200-day EMA. When price is above these EMAs, an uptrend is identified.
- RSI to identify overbought/oversold levels. A standard 14-period RSI, with overbought threshold at 70 and oversold threshold at 30.
Long entry signal:
- RSI below 30 level, indicating oversold conditions where price may rebound
- Price above either 20-day, 50-day or 200-day EMA, showing an upward trending market
When both criteria are met, a long position is entered.
Maximum loss for each trade is limited to 3% of total account value. Stop loss placement needs to consider market characteristics.
Position sizing at entry: Max Loss / (Entry Price - Stop Loss Price) = Position Size
This effectively controls per trade risk.
Main exit signals:
- RSI rises above 70 level, price may fall due to overbought conditions
- Price drops below either 20-day, 50-day or 200-day EMA, trend reversal
When either signal occurs, the position is closed.
The strategy combines the advantages of trend following and mean reversion. The EMA determines overall trend, then entry signals happen at potential reversal zones, benefiting from both trend and reversals for stability. RSI parameters can also be optimized for different markets, making the strategy robust.
The fixed max loss per trade protects capital by directly controlling trade risk level.
The strategy works well in obvious trending markets. In complex and volatile environments, using EMA for trend may have limitations. Also RSI has some lagging effect, needing confirmation from actual price action.
Stop loss placement is critical to PnL, needing careful testing for different markets. If too wide, single loss can expand; if too tight, noise may trigger unwanted stops. Live testing is required for ongoing optimization.
Testing different RSI parameters to fit more markets. Finding optimal trade size ratios. Adding other technical indicators to build more robust entry/exit systems. These are all options worth exploring.
The strategy integrates the strengths of trend following and mean reversion strategies. Entry happens on potential reversal while identifying the bigger trend. RSI optimization adapts it to more market regimes. The fixed trade risk level keeps operation stable over the medium to long term. Further improvements are possible through adjustments and robustness testing using different markets and styles.
[/trans]
Strategy Arguments
| Argument | Default | Description |
|---|---|---|
| v_input_1 | 14 | Longueur du RSI |
| v_input_2 | 70 | Niveau de Surachat RSI |
| v_input_3 | 30 | Niveau de Survente RSI |
| v_input_4 | 0.03 | Risque par Trade (3%) |
| v_input_5 | true | Distance du Stop-Loss en pips |
Source (PineScript)
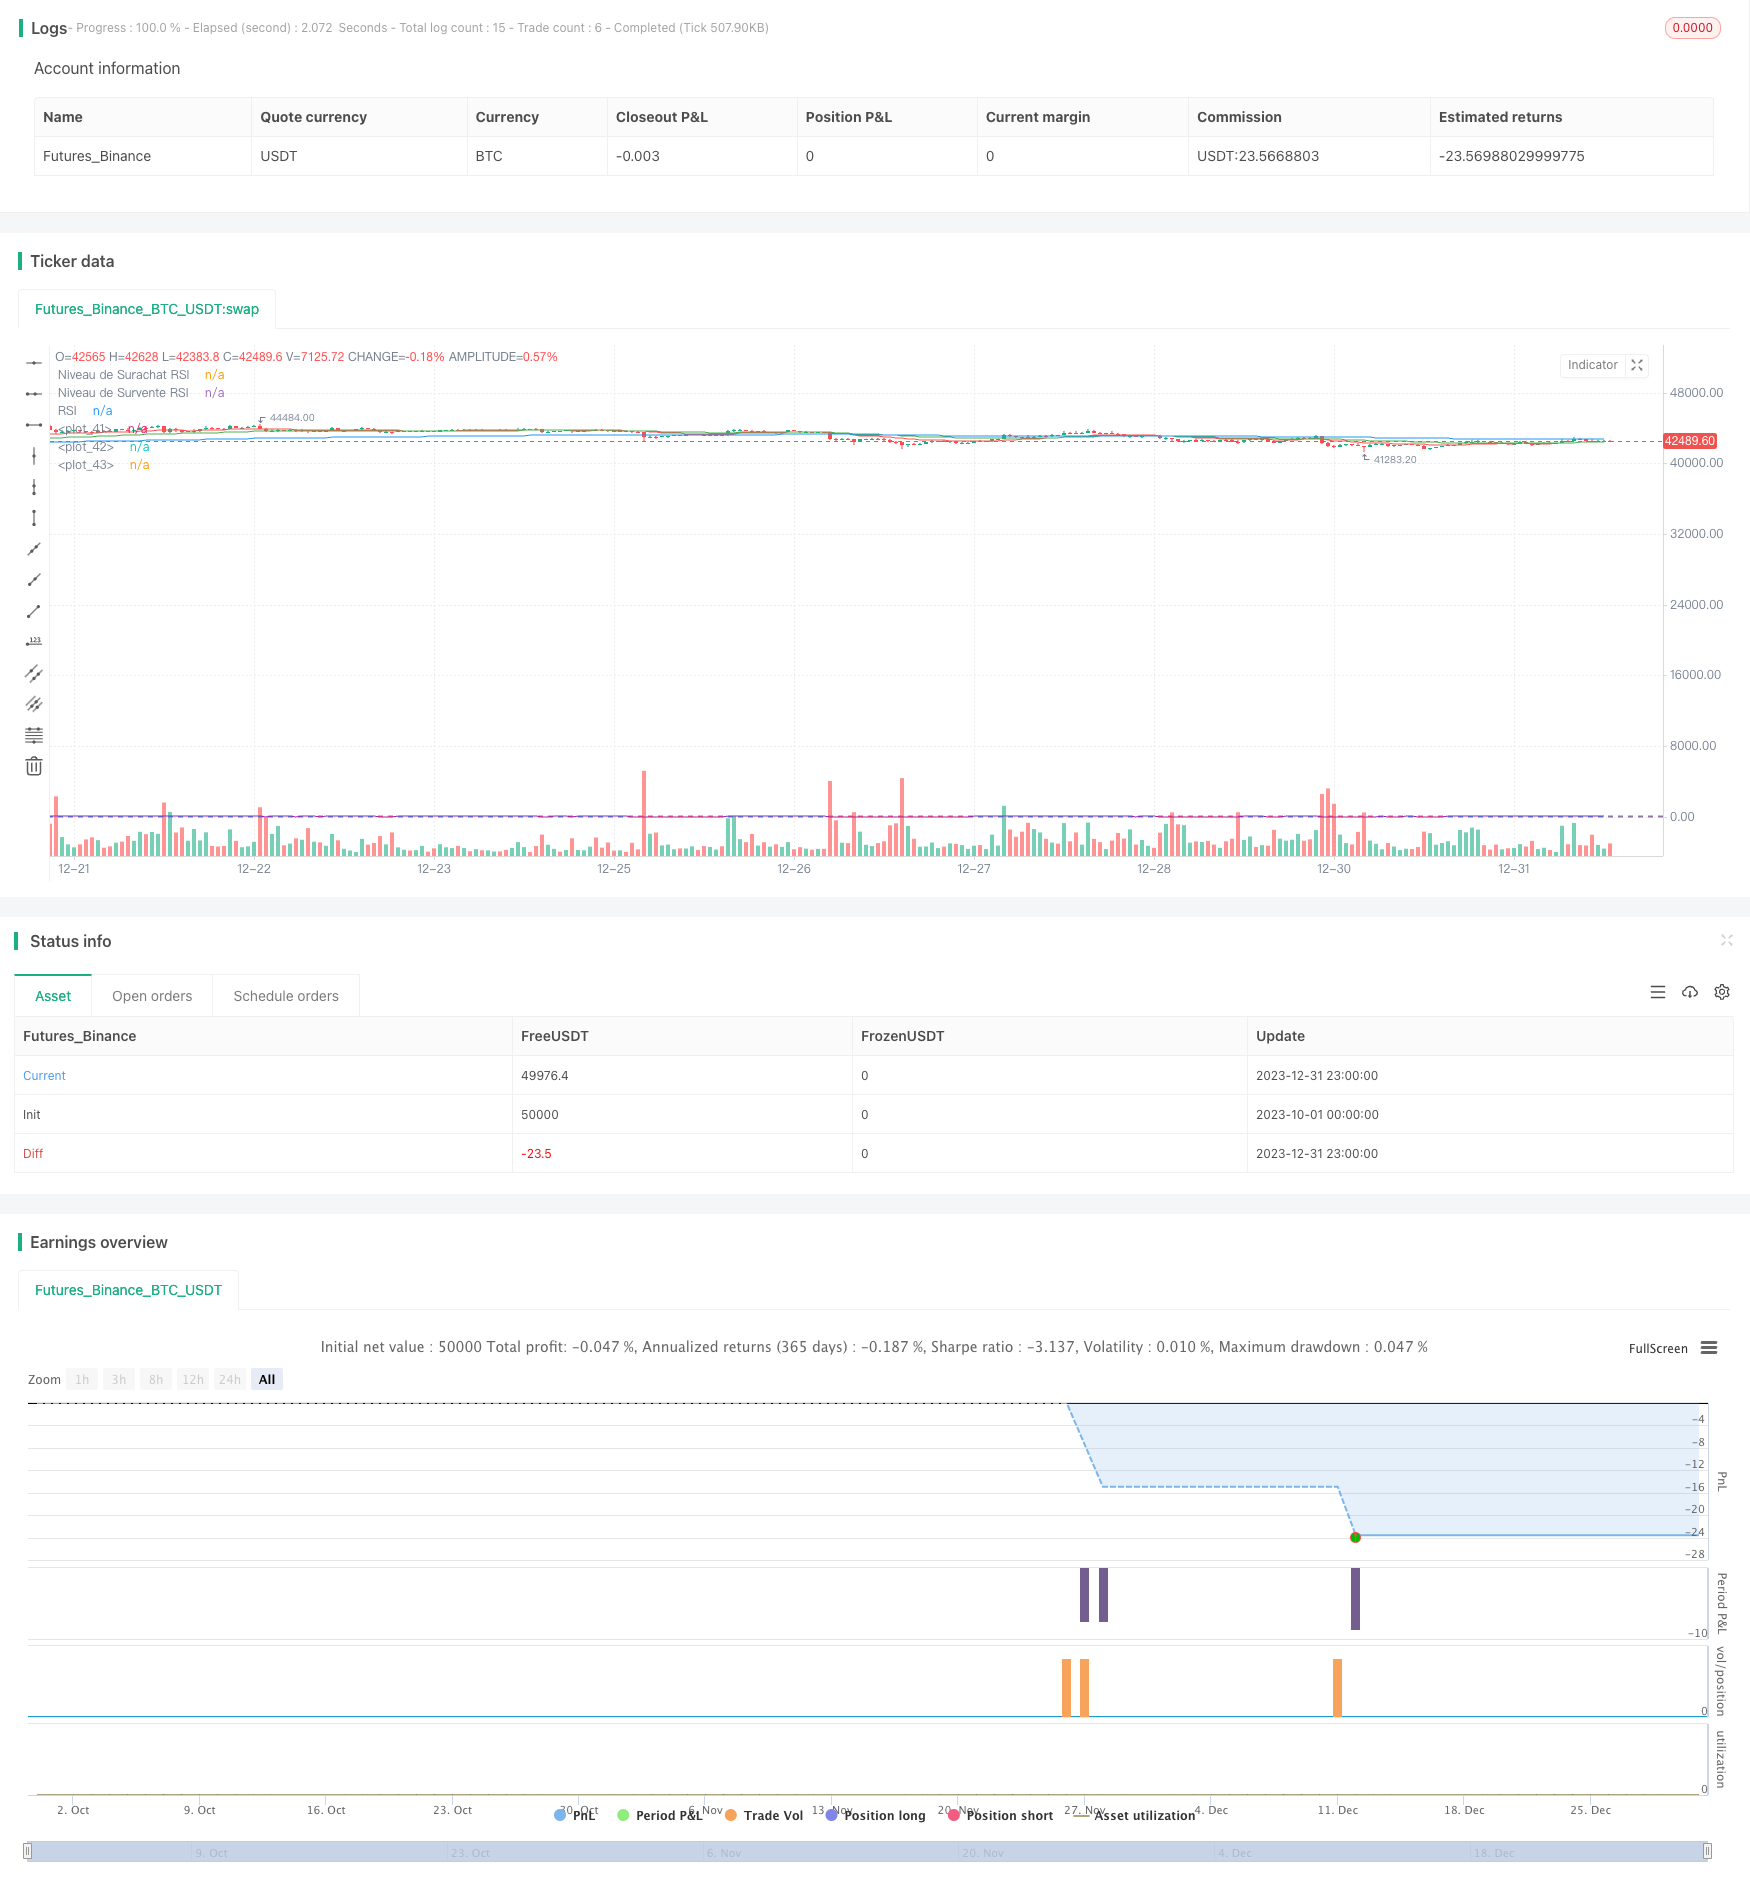
/*backtest
start: 2023-10-01 00:00:00
end: 2023-12-31 23:59:59
period: 1h
basePeriod: 15m
exchanges: [{"eid":"Futures_Binance","currency":"BTC_USDT"}]
*/

//@version=4
strategy("Stratégie RSI et EMA avec Gestion du Risque", overlay=true)

// Paramètres de la stratégie
rsiLength = input(14, "Longueur du RSI")
rsiOverbought = input(70, "Niveau de Surachat RSI")
rsiOversold = input(30, "Niveau de Survente RSI")

// Calcul du RSI
rsiValue = rsi(close, rsiLength)

// Paramètres des EMA
ema20 = ema(close, 20)
ema50 = ema(close, 50)
ema200 = ema(close, 200)

// Paramètre du risque par trade
riskPerTrade = input(0.03, "Risque par Trade (3%)")

// Distance du stop-loss en pips (à ajuster selon votre stratégie)
stopLossPips = input(1, "Distance du Stop-Loss en pips")

// Calcul de la taille de position et du stop-loss
calculatePositionSize(entryPrice, stopLossPips) =>
    stopLossPrice = entryPrice - stopLossPips * syminfo.mintick
    riskPerTradeValue = strategy.equity * riskPerTrade
    positionSize = riskPerTradeValue / (entryPrice - stopLossPrice)
    positionSize

// Conditions d'entrée
longCondition = (rsiValue < rsiOversold) and (close > ema20 or close > ema50 or close > ema200)
if longCondition
    strategy.entry("Long", strategy.long, qty=1)

// Conditions de sortie
exitCondition = (rsiValue > rsiOverbought) or (close < ema20 or close < ema50 or close < ema200)
if exitCondition
    strategy.close("Long")

// Affichage des EMA et RSI sur le graphique
plot(ema20, color=color.red)
plot(ema50, color=color.green)
plot(ema200, color=color.blue)
hline(rsiOverbought, "Niveau de Surachat RSI", color=color.red)
hline(rsiOversold, "Niveau de Survente RSI", color=color.blue)
plot(rsiValue, "RSI", color=color.purple)
Detail
https://www.fmz.com/strategy/439957
Last Modified
2024-01-25 12:19:32