Name
基于RSI和SMA的短期交易策略Short-Term-Trading-Strategy-Based-on-RSI-and-SMA
Author
ChaoZhang
Strategy Description
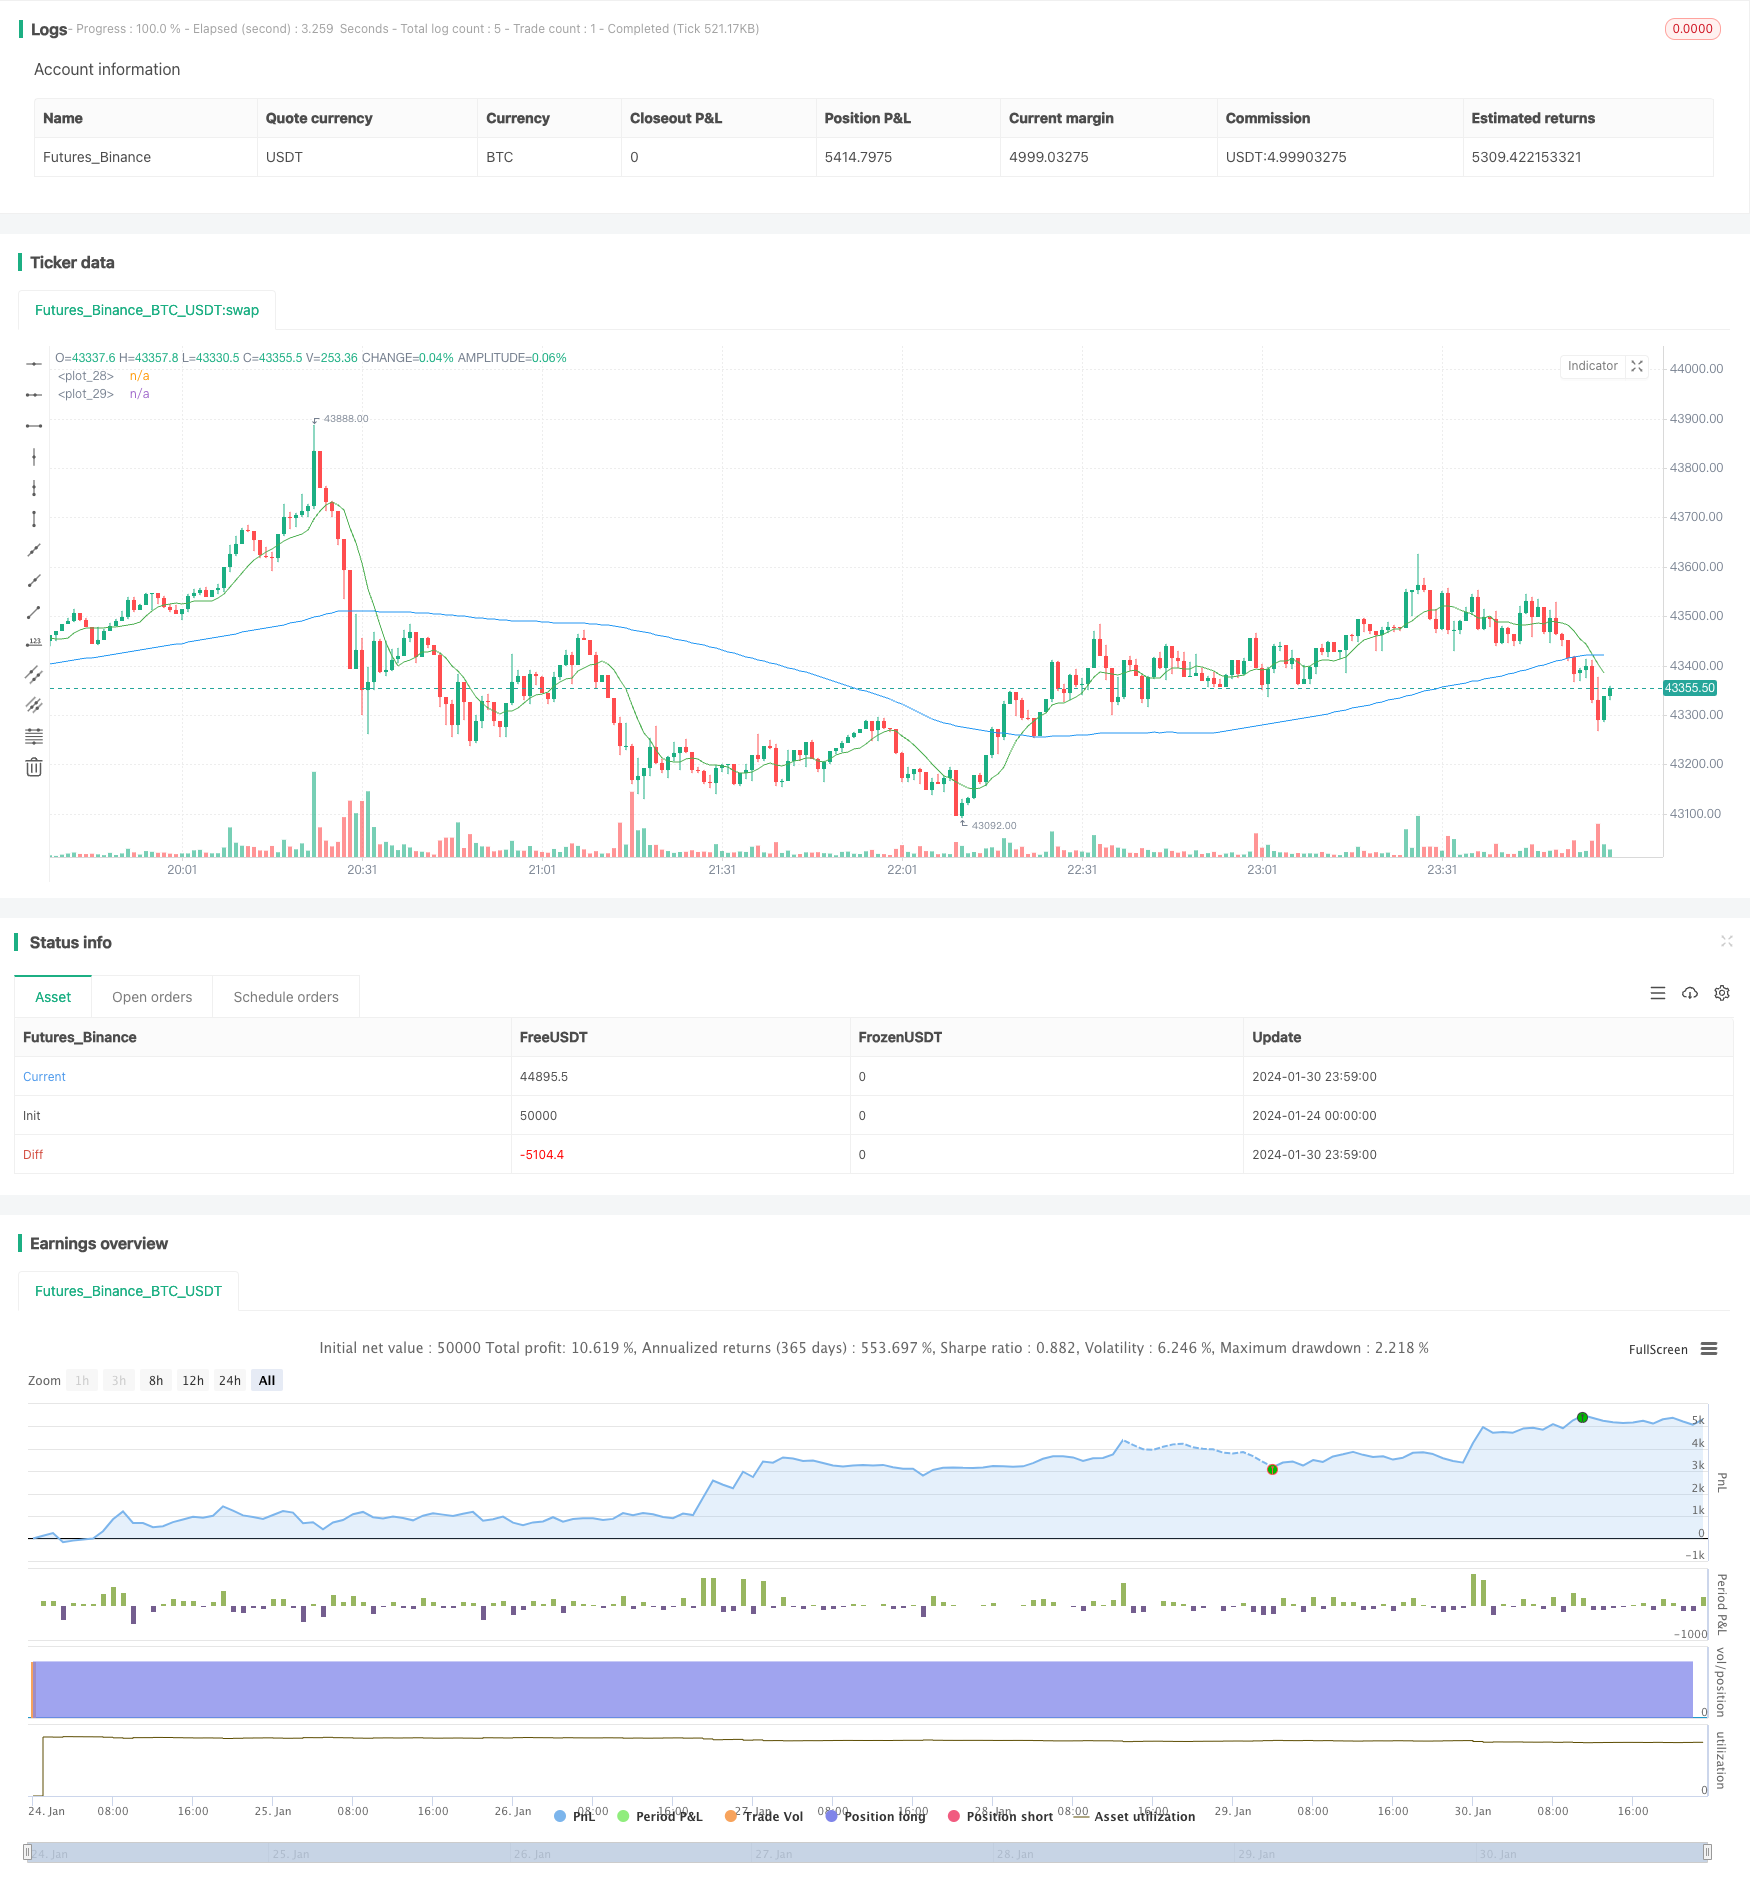
本策略名为“短期RSI和SMA百分比变化”。它利用了RSI和移动平均这样的常用技术指标来决定交易的入场和退出。RSI是一个0到100范围内的动量指标,它可以显示市场的超买超卖现象。SMA是一种简单的移动平均线,它可以反应价格的短期和长期趋势。本策略基于这两个指标构建进入和退出信号,回测显示可以获得较好的效果。
当RSI大于50时视为多头信号。这表示市场处于均衡到多头的区域。当9日SMA高于100日SMA时,表示短期趋势好于长期趋势,可以入场做多。此外,如果短期的9日SMA相对价格的变化超过6%,则表示短期趋势加速,也是入场信号。
如果已经持仓做多,本策略会利用抛物线止损来锁定利润。它会根据设置的百分比尾随止损,当价格出现回撤时会退出仓位。
本策略结合了趋势指标和超买超卖指标,可以在比较明确的趋势出现时入场,同时也避开市场正在反转的时期,大大降低了交易的风险。止损策略也可以锁定利润,防止利润在趋势反转时全部蒸发。
回测结果显示,本策略可以在比较明确的短期趋势中获利,效果较好。它适合那些追求高频交易的投资者。
本策略依赖于RSI和SMA等指标,这些指标都有一定的滞后性。当突发事件导致市场快速反转时,本策略可能无法及时退出,导致较大的亏损。
此外,高频交易需要承担更高的交易费用。如果交易频次过高,累积的交易费用也会对利润造成影响。
本策略可以考虑结合更多指标来决定入场和出场信号,例如加入交易量指标避免虚假突破。止损策略也可以调整为更加灵活的方式,考虑市场波动的因素。
此外,可以对交易品种、周期参数进行优化,寻找最佳的参数组合。也可以考虑跨周期交易,利用更高周期确定趋势方向,更低周期决定入场。
本策略“短期RSI和SMA百分比变化”综合运用了RSI和SMA等常用技术指标,构建短期交易策略。它可以抓住比较明确的短期趋势获利,同时也具有止损来锁定利润。该策略适合喜欢高频交易的投资者,但也需要警惕市场快速反转的风险。通过进一步优化,本策略可以获得更好的效果。
||
This strategy is named "Short-Term RSI and SMA Percentage Change". It utilizes common technical indicators like RSI and moving average to determine entry and exit of trades. RSI is a momentum oscillator that has a value between 0 and 100, where a value above 70 is considered overbought and below 30 oversold. SMA is a simple moving average that can reflect short-term and long-term price trends. This strategy builds entry and exit signals based on these two indicators, and backtest shows it can achieve good performance.
When RSI is above 50, it is considered a bullish signal. This indicates the market is in equilibrium to bullish zone. When 9-day SMA is above 100-day SMA, it means the short-term trend is better than the long-term trend, and we can enter a long position. In addition, if the short-term 9-day SMA has a relative change of more than 6% to price, it indicates acceleration of short-term trend, which is also an entry signal.
If already in a long position, this strategy will use parabolic SAR trailing stop to lock in profits. It will exit positions when price pulls back according to the percentage of trailing stop loss set.
This strategy combines trend indicators and oscillators, so that it can enter the market when a clear trend appears, while avoiding periods when the market is reversing, greatly reducing trading risk. The stop loss strategy can also lock in profits and prevent profits from evaporating completely when trend reverses.
Backtest shows this strategy can profit in fairly obvious short-term trends with good results. It suits investors who pursue high frequency trading.
This strategy relies on indicators like RSI and SMA, which have certain laggingness. When sudden events cause rapid market reversal, this strategy may fail to exit in time, leading to large losses.
In addition, high frequency trading bears higher trading costs. If trading frequency is too high, accumulated trading fees can also impact profits.
This strategy can consider incorporating more indicators to determine entry and exit signals, such as adding volume indicators to avoid false breakouts. Stop loss strategy can also be adjusted to more flexible ways, taking into account market fluctuations.
In addition, optimization can be done on trading products, cycle parameters to find the best parameter combination. Cross-cycle trading can also be considered, using higher cycles to determine trend direction, and lower cycles to decide entry.
This strategy "Short-term RSI and SMA Percentage Change" comprehensively employs common technical indicators like RSI and SMA to construct short-term trading strategy. It can seize fairly obvious short-term trends to profit, while also having stops to lock in profits. This strategy suits investors who like high frequency trading, but the risk of rapid market reversal also needs attention. With further optimization, this strategy can achieve better results.
[/trans]
Strategy Arguments
| Argument | Default | Description |
|---|---|---|
| v_input_1 | true | Show Date Range |
| v_input_2 | 14 | length |
| v_input_float_1 | 5 | Trail Long Loss (%) |
| v_input_float_2 | 5 | Trail Short Loss (%) |
Source (PineScript)
/*backtest
start: 2024-01-24 00:00:00
end: 2024-01-31 00:00:00
period: 1m
basePeriod: 1m
exchanges: [{"eid":"Futures_Binance","currency":"BTC_USDT"}]
*/

// This source code is subject to the terms of the Mozilla Public License 2.0 at https://mozilla.org/MPL/2.0/
// © Coinrule

//@version=5
strategy("Short Term RSI and SMA Percentage Change",
         overlay=true,
         initial_capital=1000,
         process_orders_on_close=true,
         default_qty_type=strategy.percent_of_equity,
         default_qty_value=100,
         commission_type=strategy.commission.percent,
         commission_value=0.1)

showDate = input(defval=true, title='Show Date Range')
timePeriod = time >= timestamp(syminfo.timezone, 2022, 5, 1, 0, 0)
notInTrade = strategy.position_size <= 0

//==================================Buy Conditions============================================

//RSI
length = input(14)
rsi = ta.rsi(close, length)
buyCondition1 = rsi > 50

//MA
SMA9 = ta.sma(close, 9)
SMA100 = ta.sma(close, 100)
plot(SMA9, color = color.green)
plot(SMA100, color = color.blue)
buyCondition2 = (SMA9 > SMA100)

//Calculating MA Percentage Change
buyMA = (close/SMA9)
buyCondition3 = buyMA >= 0.06

if (buyCondition1 and buyCondition2 and buyCondition3 and timePeriod) //and buyCondition
    strategy.entry("Long", strategy.long)

//==================================Sell Conditions============================================

// Configure trail stop level with input options
longTrailPerc = input.float(title='Trail Long Loss (%)', minval=0.0, step=0.1, defval=5) * 0.01
shortTrailPerc = input.float(title='Trail Short Loss (%)', minval=0.0, step=0.1, defval=5) * 0.01

// Determine trail stop loss prices
longStopPrice = 0.0
shortStopPrice = 0.0

longStopPrice := if strategy.position_size > 0
    stopValue = close * (1 - longTrailPerc)
    math.max(stopValue, longStopPrice[1])
else
    0

shortStopPrice := if strategy.position_size < 0
    stopValue = close * (1 + shortTrailPerc)
    math.min(stopValue, shortStopPrice[1])
else
    999999

strategy.exit('Exit', stop = longStopPrice, limit = shortStopPrice)
Detail
https://www.fmz.com/strategy/440681
Last Modified
2024-02-01 10:35:30